Market Overview
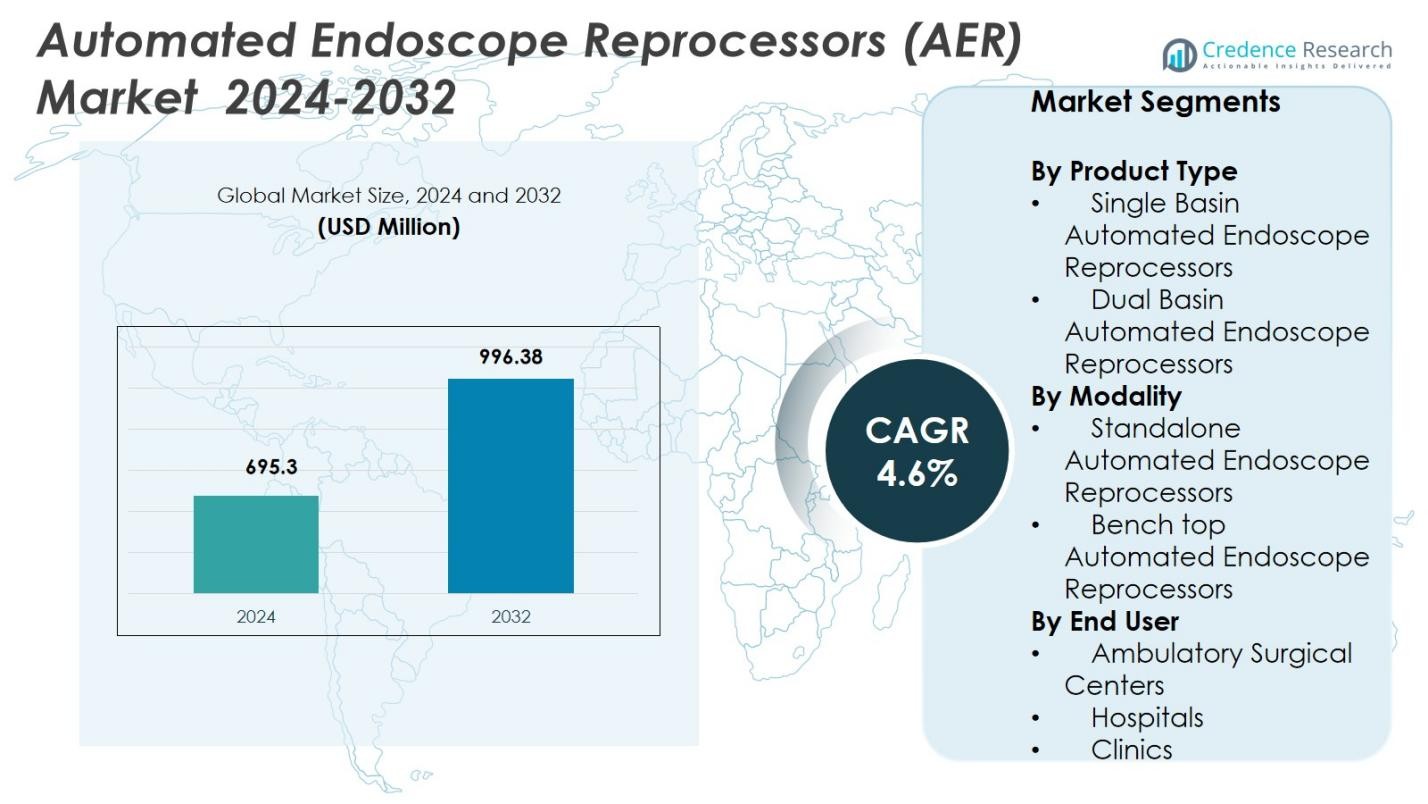
Automated Endoscope Reprocessors (AER) Market size was valued at USD 695.3 Million in 2024 and is anticipated to reach USD 996.38 Million by 2032, at a CAGR of 4.6% during the forecast period.
| REPORT ATTRIBUTE |
DETAILS |
| Historical Period |
2020-2023 |
| Base Year |
2024 |
| Forecast Period |
2025-2032 |
| Automated Endoscope Reprocessors (AER) Market Size 2024 |
USD 695.3 Million |
| Automated Endoscope Reprocessors (AER) Market, CAGR |
4.6% |
| Automated Endoscope Reprocessors (AER) Market Size 2032 |
USD 996.38 Million |
The Automated Endoscope Reprocessors (AER) Market hosts several key players including Custom Ultrasonics Inc., STERIS Plc., Hoya Corporation, Olympus Corporation, Advanced Sterilization Products Services Inc., Laboratory Anios, Getinge AB, Metull Zug AG, Steelco S.p.A., and Cantel Medical Corp. North America leads regional adoption with a 38.6% market share, supported by advanced healthcare infrastructure and rigorous infection control standards. Europe follows with a 29.4% share, driven by strong public health systems and regulatory compliance. Asia‑Pacific commands a 22.7% share, fueled by expanding healthcare access, rising endoscopy volumes, and increasing demand for automated reprocessing solutions. Collectively, these established providers and leading geographies shape AER market dynamics through product innovation, wide distribution networks, and regional demand concentration.
Access crucial information at unmatched prices!
Request your sample report today & start making informed decisions powered by Credence Research Inc.!
Download Sample
Market Insights
- The Automated Endoscope Reprocessors (AER) Market was valued at USD 695.3 Million in 2024 and is expected to grow at a CAGR of 4.6%.
- Rising demand for minimally invasive procedures and strict infection control regulations drive strong adoption of AERs, especially Dual Basin models which hold a 58.4% share in the product type segment.
- Integration of smart features such as IoT‑enabled monitoring, automated dosing, and digital documentation emerges as a key trend enhancing safety and operational efficiency.
- The presence of established providers like Custom Ultrasonics Inc., STERIS Plc., Olympus Corporation, Getinge AB, and Steelco S.p.A. intensifies market competition and encourages continuous product innovation and broad geographic availability.
- Regional demand remains concentrated in North America (38.6% share) and Europe (29.4%), while Asia‑Pacific grows rapidly with a 22.7% share, reflecting expanding healthcare infrastructure and increased endoscopy procedure volumes.
 Market Segmentation Analysis:
By Product Type
In the Automated Endoscope Reprocessors (AER) Market, Dual Basin Automated Endoscope Reprocessors dominated the product type segment in 2024 with a 58.4% share, driven by their ability to process multiple endoscopes simultaneously, reduce turnaround times, and enhance workflow efficiency in high-volume healthcare settings. Their advanced disinfection features, improved rinse cycles, and compatibility with diverse endoscope models further support widespread adoption across hospitals and surgical centers. Single basin systems held the remaining share, mainly serving smaller facilities with limited procedure volumes.
- For instance,STERIS’s front-loading dual basin reprocessor automates high-level disinfection for flexible endoscopes, integrating with hospital IT for cycle tracking and compliance, widely used in U.S. hospitals.
By Modality
Within the modality segment, Standalone Automated Endoscope Reprocessors led the market in 2024 with a 62.1% share, supported by rising installation in large healthcare institutions seeking robust, high-capacity systems that ensure compliance with stringent reprocessing standards. Their integrated drying, monitoring, and automated dosing features enhance endoscope safety and operational consistency, driving preference over bench-top units. Bench-top AERs accounted for a smaller share, serving facilities with lower procedure loads and limited space requirements.
- For instance, STERIS Plc. offers pass‑through standalone AER configurations capable of circulating high‑level disinfectant through both exterior surfaces and internal endoscope channels, ensuring consistent high‑level disinfection and rinsing cycles.
By End User
Among end users, Hospitals dominated the AER market in 2024, accounting for a 66.7% share, fueled by higher patient volumes, expanded endoscopy departments, and strict infection control protocols that necessitate advanced, automated reprocessing solutions. Hospitals increasingly invest in dual-basin, high-capacity AERs to reduce cross-contamination risks, optimize throughput, and comply with regulatory guidelines. Ambulatory surgical centers and clinics represented the remaining market share, adopting AERs primarily to enhance disinfection reliability and streamline workflow efficiency.
Key Growth Drivers
Rising Endoscopy Procedure Volumes
Growing global demand for minimally invasive procedures continues to expand the use of gastrointestinal, pulmonology, and urology endoscopes, directly increasing the need for reliable reprocessing systems. As hospitals and ambulatory centers perform higher volumes of diagnostic and therapeutic endoscopies, automated reprocessors become essential for ensuring rapid turnaround, consistent disinfection quality, and reduced cross-contamination risks. This surge in procedure counts drives steady adoption of AERs across both developed and emerging healthcare markets.
- For instance, Medivators launched the ADVANTAGE® Plus, an AER designed to process complex duodenoscopes faster, supporting hospitals in handling increased throughput demands without compromising disinfection quality.
Stringent Infection Control and Reprocessing Standards
Governments and healthcare regulatory bodies are enforcing stricter guidelines for endoscope reprocessing due to past contamination incidents and rising concern over healthcare-associated infections. Compliance with standards issued by FDA, CDC, AAMI, and equivalent global agencies pushes healthcare facilities to replace manual or semi-automated systems with fully automated AERs. These devices offer validated, standardized, and traceable disinfection cycles, making them critical for meeting accreditation requirements and minimizing liability associated with improper reprocessing.
- For instance, the U.S. FDA issued safety communications after outbreaks linked to duodenoscopes, urging use of enhanced reprocessing protocols.
Technological Advancements Enhancing Safety and Efficiency
Technological innovations such as RFID tracking, automated detergent dosing, integrated drying functions, and digital documentation significantly enhance AER reliability and workflow efficiency. Newer models deliver improved leak testing, reprocessing cycle optimization, and better chemical compatibility, supporting consistent outcomes across different endoscope types. These advancements reduce operator dependency, lower error rates, and improve overall hygiene standards, encouraging healthcare facilities to upgrade older systems and adopt advanced AER technologies.
Key Trends & Opportunities
Integration of Digital Monitoring and IoT Capabilities
A major trend shaping the market is the integration of digital monitoring solutions, including IoT-enabled tracking, cycle documentation, and predictive maintenance features. Healthcare facilities increasingly seek reprocessors that provide real-time performance insights, remote monitoring, and automated alerts to support quality assurance. This shift toward connected AER systems creates new opportunities for manufacturers to deliver smarter platforms that enhance traceability, meet audit expectations, and streamline reprocessing workflows.
- For instance, Discovery Health implemented Striim’s Change Data Capture technology, reducing data processing times from 24 hours to seconds for integrated systems. This enables real-time analytics and responsive decisions in healthcare operations.
Growing Adoption in Emerging Healthcare Markets
Expanding healthcare infrastructure and rising investment in hospital modernization across Asia-Pacific, Latin America, and the Middle East offer large growth opportunities. These regions are witnessing increased uptake of endoscopy procedures and improved awareness of infection prevention protocols. As governments emphasize patient safety and equip hospitals with advanced sterilization technologies, demand for cost-effective and high-performance AER solutions grows. Manufacturers targeting these markets with localized service networks and affordable product lines can benefit significantly.
- For instance, Medtronic announced a $350 million investment in its Engineering & Innovation Center in Hyderabad, India, to enhance local manufacturing and R&D for medical devices amid healthcare infrastructure localization efforts.
Key Challenges
High Acquisition and Maintenance Costs
Despite their importance, AERs represent a considerable financial burden for smaller hospitals, ambulatory centers, and clinics, as procurement, installation, and upkeep require significant investment. The cost of consumables, chemicals, and replacement parts further increases operational expenses. Budget limitations often delay system upgrades or push facilities toward manual disinfection methods, slowing adoption in cost-sensitive healthcare settings. This makes affordability a persistent challenge for broader market penetration.
Complexity of Endoscope Designs and Compatibility Issues
Modern endoscopes feature intricate channels and delicate materials, making thorough cleaning and compatibility with reprocessing chemicals more challenging. Ensuring that AERs work efficiently across a wide variety of endoscope models requires continuous technological refinement and strict validation processes. Incompatible chemicals or improper cycle parameters can risk equipment damage or ineffective disinfection. This complexity creates operational hurdles for healthcare staff, who must ensure proper system configuration, training, and adherence to reprocessing protocols.
Regional Analysis
North America
North America led the Automated Endoscope Reprocessors (AER) Market in 2024 with a 38.6% share, supported by advanced healthcare infrastructure, high adoption of minimally invasive procedures, and strict enforcement of infection prevention regulations. Hospitals and ambulatory surgical centers across the U.S. and Canada continue to invest in high-capacity, automated systems to meet reprocessing standards set by FDA, CDC, and AAMI. The region’s strong presence of global manufacturers, rapid technological upgrades, and increasing focus on workflow optimization further strengthen market growth. Continuous replacement of aging equipment also drives steady demand.
Europe
Europe accounted for a 29.4% share of the AER market in 2024, driven by well-established public healthcare systems, stringent sterilization guidelines, and strong compliance with EU medical device regulations. Countries such as Germany, France, the U.K., and Italy show high adoption due to expanding endoscopy units and growing emphasis on standardized disinfection practices. Investments in infection control infrastructure and government-backed modernization programs continue to improve procedural safety. Increasing use of advanced endoscopes and rising focus on cross-contamination prevention further boost demand for automated, high-efficiency reprocessing systems.
Asia-Pacific
Asia-Pacific captured a 22.7% share in 2024 and represents the fastest-growing regional market due to rising healthcare expenditure, rapid hospital expansion, and increasing patient access to endoscopy services. Countries including China, Japan, India, and South Korea are strengthening infection control protocols, prompting facilities to adopt automated reprocessors over manual cleaning practices. Growth is further supported by rising awareness of healthcare-associated infections and expanding gastrointestinal and respiratory disease diagnostics. Technological upgrades, improving reimbursement environments, and growing medical tourism also fuel AER adoption across the region.
Latin America
Latin America held a 6.1% share in 2024, supported by gradual improvements in hospital infrastructure and increasing demand for advanced sterilization equipment in countries such as Brazil, Mexico, and Argentina. The region is witnessing rising adoption of minimally invasive procedures and greater emphasis on reducing infection risks in endoscopy units. Although budget constraints limit rapid adoption, targeted government investments and private healthcare expansion drive steady market penetration. Growing training initiatives and partnerships with global sterilization solution providers further support the uptake of automated reprocessing systems.
Middle East & Africa
The Middle East & Africa region accounted for a 3.2% share of the market in 2024, driven by ongoing modernization of healthcare facilities and increasing investment in high-quality surgical and diagnostic services. Countries such as the UAE, Saudi Arabia, and South Africa are adopting advanced sterilization technologies to meet international infection control standards. Growing prevalence of gastrointestinal and respiratory conditions and rising procedure volumes contribute to AER demand. However, limited budgets and uneven healthcare development across parts of Africa continue to restrict widespread adoption, creating a mixed growth landscape.
Market Segmentations:
By Product Type
- Single Basin Automated Endoscope Reprocessors
- Dual Basin Automated Endoscope Reprocessors
By Modality
- Standalone Automated Endoscope Reprocessors
- Bench top Automated Endoscope Reprocessors
By End User
- Ambulatory Surgical Centers
- Hospitals
- Clinics
By Geography
- North America
- Europe
- Germany
- France
- U.K.
- Italy
- Spain
- Rest of Europe
- Asia Pacific
- China
- Japan
- India
- South Korea
- South-east Asia
- Rest of Asia Pacific
- Latin America
- Brazil
- Argentina
- Rest of Latin America
- Middle East & Africa
- GCC Countries
- South Africa
- Rest of the Middle East and Africa
Competitive Landscape
Competitive landscape in the Automated Endoscope Reprocessors (AER) Market includes key players such as Custom Ultrasonics Inc., STERIS Plc., Hoya Corporation, Olympus Corporation, Advanced Sterilization Products Services Inc., Laboratory Anios, Getinge AB, Metull Zug AG, Steelco S.p.A., and Cantel Medical Corp. The market is characterized by strong competition driven by continuous technological innovation, product differentiation, and global expansion strategies. Leading companies focus on enhancing system efficiency, integrating IoT-based monitoring, and offering customizable solutions for diverse healthcare facilities. Strategic collaborations, mergers, and regional partnerships strengthen distribution networks, particularly in high-growth Asia-Pacific and emerging markets. Product upgrades emphasizing dual-basin systems, automated dosing, and advanced drying mechanisms further increase market competitiveness. Additionally, emphasis on regulatory compliance, staff training programs, and post-sales support reinforces brand loyalty. Overall, competitive strategies revolve around innovation, quality assurance, and broadening market presence to maintain leadership in the evolving AER market.
Key Player Analysis
- Laboratory Anios
- Steelco S.p.A.
- STERIS Plc.
- Metull Zug AG
- Cantel Medical Corp.
- Getinge AB
- Advanced Sterilization Products Services Inc.
- Olympus Corporation
- Hoya Corporation
- Custom Ultrasonics Inc.
Recent Developments
- In March 2024, STERIS Plc. rolled out an upgraded AER system featuring enhanced cycle‑verification functionality, designed to support compliance with FDA and CDC reprocessing guidelines.
- In July 2023, HOYA Corporation acquired the remaining 49% stake of Wassenburg Medical B.V., making it the sole shareholder and consolidating its reprocessing and sterilization offering.
- In June 2024, Steelco S.p.A. entered a joint venture with Belimed AG to develop advanced cleaning and sterilization solutions, strengthening their combined capability to supply AER and related sterilization systems globally.
Shape Your Report to Specific Countries or Regions & Enjoy 30% Off!
Report Coverage
The research report offers an in-depth analysis based on Product Type, Modality, End User and Geography. It details leading market players, providing an overview of their business, product offerings, investments, revenue streams, and key applications. Additionally, the report includes insights into the competitive environment, SWOT analysis, current market trends, as well as the primary drivers and constraints. Furthermore, it discusses various factors that have driven market expansion in recent years. The report also explores market dynamics, regulatory scenarios, and technological advancements that are shaping the industry. It assesses the impact of external factors and global economic changes on market growth. Lastly, it provides strategic recommendations for new entrants and established companies to navigate the complexities of the market.
Future Outlook
- Adoption of dual-basin AERs will continue to grow across high-volume hospitals and surgical centers.
- Integration of IoT and digital monitoring features will enhance traceability and workflow efficiency.
- Emerging markets in Asia-Pacific and Latin America will witness rapid uptake of AER systems.
- Regulatory compliance requirements will drive replacement of manual and semi-automated systems.
- Technological advancements in automated drying, leak testing, and chemical dosing will improve disinfection outcomes.
- Hospitals will increasingly invest in high-capacity standalone AERs to manage growing endoscopy procedure volumes.
- Collaboration between manufacturers and healthcare providers will support customized solutions and training programs.
- Rising awareness of infection prevention will accelerate demand in clinics and ambulatory surgical centers.
- Integration with hospital management and electronic health record systems will streamline reporting and audits.
- Continuous innovation in compact bench-top models will expand adoption in space-constrained facilities.


