Market Overview
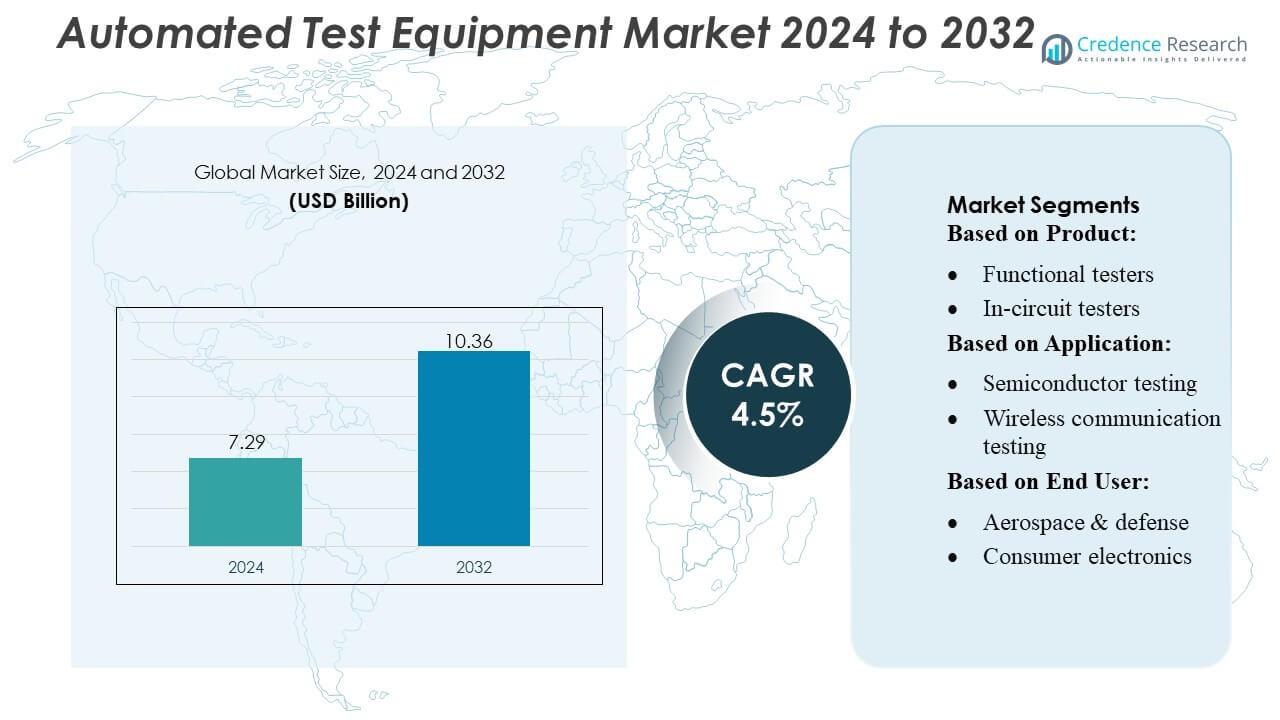
Automated Test Equipment Market size was valued USD 7.29 billion in 2024 and is anticipated to reach USD 10.36 billion by 2032, at a CAGR of 4.5% during the forecast period.
| REPORT ATTRIBUTE |
DETAILS |
| Historical Period |
2020-2023 |
| Base Year |
2024 |
| Forecast Period |
2025-2032 |
| Automated Test Equipment Market Size 2024 |
USD 7.29 Billion |
| Automated Test Equipment Market, CAGR |
4.5% |
| Automated Test Equipment Market Size 2032 |
USD 10.36 Billion |
The Automated Test Equipment (ATE) market is led by prominent players such as Teradyne Inc., Cohu, Inc., VIAVI Solutions Inc., Aemulus Corporation, STAr Technologies Inc., ADVANTEST CORPORATION, Chroma ATE Inc., Roos Instruments, TESEC Corporation, and Astronics Corporation. These companies focus on innovation, offering high-precision, modular, and AI-enabled testing solutions to cater to semiconductor, automotive, aerospace, and telecommunications sectors. They leverage strategic initiatives such as mergers, acquisitions, and regional expansions to strengthen their competitive positioning. North America emerges as the leading region, capturing approximately 35% of the global market share, driven by advanced semiconductor manufacturing, aerospace and defense applications, and rapid adoption of 5G and autonomous vehicle technologies. Strong R&D investments and stringent quality standards further reinforce the region’s dominance and the market leadership of these top players.
Access crucial information at unmatched prices!
Request your sample report today & start making informed decisions powered by Credence Research Inc.!
Download Sample
Market Insights
- The Automated Test Equipment market size was valued at USD 7.29 billion in 2024 and is projected to reach USD 10.36 billion by 2032, growing at a CAGR of 4.5% during the forecast period.
- Growth is driven by increasing complexity in semiconductors, rising adoption of 5G, IoT, electric vehicles, and the need for high-precision, high-throughput testing solutions across automotive, aerospace, and telecommunications sectors.
- Key trends include integration of AI and machine learning in ATE systems, modular and scalable testing platforms, and expansion into emerging markets, particularly Asia-Pacific, Latin America, and the Middle East.
- Competitive analysis shows major players focusing on innovation, strategic mergers and acquisitions, regional expansions, and customized solutions to maintain market share in functional, mixed-signal, RF, and in-circuit tester segments.
- North America holds the leading regional share at approximately 35%, followed by Asia-Pacific and Europe, driven by semiconductor manufacturing, aerospace & defense, and advanced electronics applications.
Market Segmentation Analysis:
By Product:
Functional testers dominate the product segment, capturing the largest market share of approximately 32%. These testers are widely adopted due to their ability to perform end-to-end validation of electronic devices efficiently, ensuring operational reliability. In-circuit testers and mixed-signal testers follow closely, offering targeted testing of printed circuit boards and mixed-signal devices, respectively. Growth in functional testers is driven by increasing complexity in electronics, demand for high throughput testing, and stringent quality standards across semiconductor and consumer electronics industries, which necessitate robust, accurate, and automated testing solutions.
- For instance, Cohu’s recently launched Diamondx tester — when paired with the new VI100 instrument — enables four‑quadrant voltage and current sourcing/measurement, with arbitrary waveform source and capture for analog and power‑management ICs; this configuration reportedly reduces test time by up to 80% compared with legacy systems.
By Application:
Semiconductor testing leads the application segment with an estimated market share of 35%, fueled by rapid advancements in semiconductor fabrication and rising demand for high-performance chips in consumer electronics, automotive, and telecommunications. Automotive electronics testing and wireless communication testing are gaining traction due to the expansion of electric vehicles and 5G infrastructure, respectively. Key drivers include the need for defect-free semiconductor devices, reduction of time-to-market, and integration of automated testing solutions capable of handling complex designs and mixed-signal environments efficiently.
- For instance, Samsara’s Vehicle Gateway device provides real-time connectivity via 4G LTE and built-in WiFi hotspot — delivering up to 10× speed advantage over 3G devices.
By End-user:
The aerospace & defense segment holds the dominant position with around 28% market share, supported by rigorous reliability and safety standards for avionics, military systems, and satellite electronics. Automotive and consumer electronics sectors are expanding rapidly as EV adoption, smart devices, and connected systems increase the demand for precise testing solutions. Drivers include stringent regulatory compliance, growing electronics complexity, and increasing adoption of automated, high-speed testing equipment to enhance quality, minimize errors, and optimize production efficiency across high-reliability end-user industries.
Key Growth Drivers
- Rising Complexity of Electronic Devices:
The increasing complexity of semiconductors and electronic devices drives demand for advanced automated test equipment. High-performance chips, multi-layer PCBs, and mixed-signal designs require precise, high-throughput testing to ensure quality and reliability. This trend is particularly prominent in automotive electronics, aerospace systems, and consumer devices, where failures can be costly. Manufacturers are investing in ATE solutions that can efficiently handle complex testing scenarios, reduce human errors, and accelerate time-to-market, reinforcing the market’s robust growth trajectory.
- For instance, VALOR™ Lab‑as‑a‑Service facility now offers over‑the‑air (OTA) performance testing of Massive‑MIMO systems with support for up to 16 spatial layers in parallel, enabling realistic real‑world validation of 5G radio units.
- Expansion of Emerging Technologies:
Adoption of emerging technologies such as 5G, IoT, and electric vehicles is fueling ATE market growth. 5G infrastructure and connected devices demand rigorous validation of high-frequency circuits, while EVs and autonomous vehicles require extensive functional and reliability testing of sophisticated electronic modules. These technological advancements create opportunities for innovative testers, including mixed-signal and radio frequency testers, driving higher adoption of automated testing solutions. Companies are focusing on scalable and adaptable ATE systems to meet the evolving needs of these high-growth sectors.
- For instance, AMB5600 supports up to 1,536 digital channels, 576 device‑power‑supply (DPS) channels, and accepts voltages from –2 V to 11 V with current supply up to 4 A — enabling comprehensive testing of digital, analog, RF, and power ICs with a single system.
- Stringent Quality and Regulatory Standards:
Regulatory compliance and the need for zero-defect production are major drivers for ATE adoption. Industries such as aerospace, defense, and medical electronics enforce strict safety and reliability standards, necessitating thorough automated testing. ATE enables manufacturers to detect faults early, reduce product recalls, and maintain consistent quality. The demand for automated, high-precision testing systems is further reinforced by global quality certifications and industry benchmarks, pushing companies to integrate advanced ATE solutions into their production and testing workflows.
Key Trends & Opportunities
- Integration of AI and Machine Learning:
The integration of AI and machine learning into ATE systems is transforming testing efficiency and accuracy. Predictive analytics and automated fault detection allow faster identification of defects and optimization of testing processes. AI-driven ATE can adapt to complex designs and reduce human intervention, lowering operational costs. This trend presents opportunities for vendors to develop intelligent, self-learning testing platforms that enhance throughput and support next-generation electronics, particularly in semiconductor fabrication, automotive electronics, and advanced communication systems.
- For instance, Geotab currently processes approximately 100 billion data points per day from its connected vehicles. The figure of 55 billion mentioned in the original statement was accurate in earlier reporting periods.
- Shift Toward Modular and Scalable Solutions:
Manufacturers increasingly prefer modular and scalable ATE solutions that can accommodate evolving product designs and higher testing volumes. Modular systems enable easy upgrades, integration of new testing modules, and customization based on application requirements. This trend is significant in sectors like automotive and aerospace, where product lifecycles are short and technological upgrades frequent. The opportunity lies in providing flexible ATE platforms that reduce initial investment costs while supporting long-term growth and adaptation to emerging testing needs.
- For instance, HCSS Telematics integrates directly with HCSS Safety and HeavyJob, capturing more than 60 field safety forms and incident types on a single cloud platform, and its GPS modules log vehicle data at 1-second intervals to verify speeding, idling, and restricted-zone violations.
- Expansion in Emerging Markets:
Emerging markets in Asia-Pacific and Latin America offer substantial growth opportunities for the ATE industry due to rising electronics manufacturing, semiconductor fabrication, and automotive production. Increasing local demand for high-quality electronic devices drives the adoption of automated testing systems. Companies are expanding their presence in these regions through localized solutions and strategic partnerships, capitalizing on growing industrialization, low-cost manufacturing advantages, and supportive government initiatives to boost electronics production and technological infrastructure.
Key Challenges
- High Initial Investment and Maintenance Costs:
The high capital expenditure required for advanced ATE systems poses a significant challenge for small and mid-sized manufacturers. Installation, integration, and ongoing maintenance costs are substantial, limiting accessibility and adoption. Additionally, frequent technological upgrades can further increase expenses. This challenge drives the need for cost-effective, modular, or rental-based solutions, yet upfront investments remain a barrier, particularly for startups and emerging market players seeking to implement automated testing without compromising quality or efficiency.
- Rapid Technological Evolution and Skill Gap:
Rapid technological advancements in electronics and testing equipment create challenges in keeping ATE systems updated. Manufacturers must frequently upgrade hardware and software to support new device architectures and testing protocols. Additionally, the scarcity of skilled personnel to operate and maintain sophisticated ATE systems restricts effective utilization. Bridging this skill gap through training and automation solutions is critical, as failure to adapt may result in inefficient testing, higher defect rates, and reduced competitiveness in high-technology sectors.
Regional Analysis
North America:
North America leads the ATE market with an approximate 35% share, driven by advanced semiconductor fabrication, aerospace & defense, and automotive electronics sectors. High adoption of 5G, IoT, and autonomous vehicle technologies fuels demand for functional, RF, and mixed-signal testers. Strong R&D investments, stringent quality regulations, and a focus on high-throughput automated testing enhance regional growth. Key players prioritize AI-integrated and modular testing solutions to optimize efficiency, reduce defects, and accelerate time-to-market, solidifying North America’s position as a mature and innovation-driven ATE market.
Asia-Pacific:
Asia-Pacific accounts for around 30% of the global ATE market and is the fastest-growing region. China, Japan, South Korea, and India drive growth due to expanding semiconductor production, consumer electronics manufacturing, and automotive electronics, particularly electric vehicles. Rising 5G deployment and IoT adoption further boost demand for functional, mixed-signal, and RF testers. Cost-effective manufacturing, government support, and industrial modernization encourage widespread ATE adoption. Vendors focus on scalable, high-speed testing solutions to meet increasing production volumes and stringent quality standards, making Asia-Pacific a critical growth engine for the global ATE market.
Europe:
Europe contributes approximately 20–25% of the ATE market, led by Germany, France, and the UK. Aerospace, automotive, and industrial electronics sectors are primary drivers, supported by stringent safety and quality regulations. The transition to electric vehicles, advanced driver-assistance systems (ADAS), and Industry 4.0 initiatives increases demand for automated functional and in-circuit testers. European manufacturers prioritize precision, modular ATE systems, and AI-driven testing to reduce defects, enhance productivity, and maintain compliance with global standards. Investments in smart factories and high-reliability electronics further strengthen Europe’s strategic position in the global ATE landscape.
Latin America:
Latin America represents about 5–7% of the ATE market, with growth driven by industrial modernization, automotive electronics, and consumer electronics assembly. Brazil, Mexico, and Argentina are key contributors as manufacturers adopt automated testing solutions to improve quality and reduce production errors. Cost-effective ATE systems and modular platforms are gaining traction among mid-sized enterprises. Expansion of manufacturing infrastructure, rising electronics consumption, and increasing local semiconductor initiatives create opportunities for vendors to establish localized solutions, catering to both production efficiency and compliance with international quality standards in the region.
Middle East & Africa (MEA):
The Middle East & Africa account for roughly 3–5% of the ATE market. Growth is primarily fueled by aerospace, defense, and telecommunications sectors, with countries like UAE, Saudi Arabia, and South Africa leading adoption. Investments in smart city projects, satellite technology, and industrial electronics drive demand for functional and RF testers. Market growth is constrained by lower electronics manufacturing density, but opportunities exist for modular and cost-efficient ATE solutions. Strategic partnerships and localized deployment of testing systems enable vendors to penetrate these emerging markets and meet rising quality and reliability requirements.
Market Segmentations:
By Product:
- Functional testers
- In-circuit testers
By Application:
- Semiconductor testing
- Wireless communication testing
By End User:
- Aerospace & defense
- Consumer electronics
By Geography
- North America
- Europe
- Germany
- France
- U.K.
- Italy
- Spain
- Rest of Europe
- Asia Pacific
- China
- Japan
- India
- South Korea
- South-east Asia
- Rest of Asia Pacific
- Latin America
- Brazil
- Argentina
- Rest of Latin America
- Middle East & Africa
- GCC Countries
- South Africa
- Rest of the Middle East and Africa
Competitive Landscape
The Automated Test Equipment market include Teradyne Inc., Cohu, Inc, VIAVI Solutions Inc., Aemulus Corporation, STAr Technologies Inc., ADVANTEST CORPORATION, Chroma ATE Inc., Roos Instruments, TESEC Corporation, and Astronics Corporation. The Automated Test Equipment market is highly competitive, driven by rapid technological advancements and growing demand across semiconductor, automotive, aerospace, and telecommunications sectors. Companies focus on innovation through AI- and machine learning-enabled testing solutions, modular and scalable platforms, and high-throughput systems to enhance accuracy and efficiency. Strategic initiatives such as mergers, acquisitions, regional expansions, and tailored solutions for emerging applications strengthen market positions. Vendors differentiate themselves by offering reliable, flexible, and industry-compliant testing solutions, while adopting smart manufacturing and Industry 4.0 integration to address evolving customer requirements, reduce defects, and optimize production cycles in increasingly complex electronics environments.
Shape Your Report to Specific Countries or Regions & Enjoy 30% Off!
Key Player Analysis
- Teradyne Inc.
- Cohu, Inc
- VIAVI Solutions Inc.
- Aemulus Corporation
- STAr Technologies Inc.
- ADVANTEST CORPORATION
- Chroma ATE Inc.
- Roos Instruments
- TESEC Corporation
- Astronics Corporation
Recent Developments
- In October 2025, Advantest introduced several new solutions and platforms aimed at tackling the growing complexity of advanced semiconductor chips for AI and high-performance computing (HPC) applications.
- In March 2025, Keysight Technologies and Analog Devices (ADI) partnered to demonstrate 6G FR3 front-end characterization at Mobile World Congress 2025. The demonstration used Keysight’s PNA-X analyzers with a full 6-18 GHz signal chain from Analog Devices to streamline the characterization of complex RF components, reducing development time and minimizing errors.
- In February 2025, Advantest Corporation announced the T5801 Ultra-High-Speed DRAM Test System, designed to test new memory technologies like GDDR7, LPDDR6, and DDR6 to meet the demands of AI and HPC applications.
- In January 2025, Teradyne and Infineon Technologies entered a strategic partnership that includes Teradyne acquiring Infineon’s automated test equipment (ATE) division in Regensburg, Germany. This collaboration aims to advance power semiconductor testing, with the acquisition allowing Teradyne to accelerate its power semiconductor roadmap and Infineon to benefit from continued manufacturing support.
Report Coverage
The research report offers an in-depth analysis based on Product, Application, End-User and Geography. It details leading market players, providing an overview of their business, product offerings, investments, revenue streams, and key applications. Additionally, the report includes insights into the competitive environment, SWOT analysis, current market trends, as well as the primary drivers and constraints. Furthermore, it discusses various factors that have driven market expansion in recent years. The report also explores market dynamics, regulatory scenarios, and technological advancements that are shaping the industry. It assesses the impact of external factors and global economic changes on market growth. Lastly, it provides strategic recommendations for new entrants and established companies to navigate the complexities of the market.
Future Outlook
- Demand for high-precision testing solutions will continue to grow with increasing electronics complexity.
- Adoption of AI and machine learning in testing systems will enhance accuracy and reduce testing time.
- Expansion of 5G, IoT, and semiconductor industries will drive increased deployment of ATE systems.
- Automotive electronics, especially electric vehicles and ADAS, will significantly boost market growth.
- Modular and scalable ATE platforms will gain preference for flexibility and cost efficiency.
- Emerging markets in Asia-Pacific, Latin America, and the Middle East will offer substantial growth opportunities.
- Integration with smart manufacturing and Industry 4.0 will become a standard requirement.
- High demand for reliable, zero-defect testing will push innovation in advanced functional and mixed-signal testers.
- Strategic partnerships, acquisitions, and localized manufacturing will strengthen regional market presence.
- Continuous technological evolution will encourage development of faster, energy-efficient, and compact testing systems.


