Market Overview
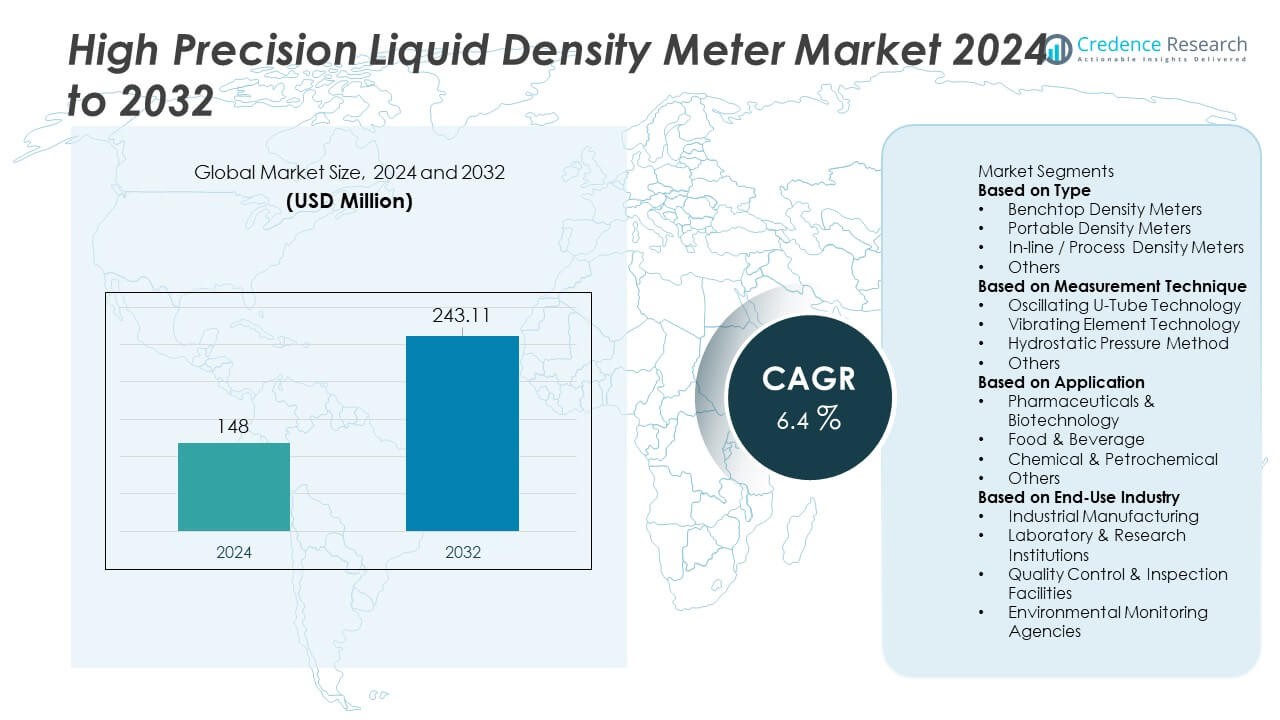
The High Precision Liquid Density Meter Market was valued at USD 148 million in 2024 and is projected to reach USD 243.11 million by 2032, expanding at a CAGR of 6.4% during the forecast period.
| REPORT ATTRIBUTE |
DETAILS |
| Historical Period |
2020-2023 |
| Base Year |
2024 |
| Forecast Period |
2025-2032 |
| High Precision Liquid Density Meter Market Size 2024 |
USD 148 Million |
| High Precision Liquid Density Meter Market, CAGR |
6.4% |
| High Precision Liquid Density Meter Market Size 2032 |
USD 243.11 Million |
The High Precision Liquid Density Meter market is shaped by major players including Anton Paar GmbH, METTLER TOLEDO, Kyoto Electronics Manufacturing, Rudolph Research Analytical, Endress+Hauser Group, Thermo Fisher Scientific, Yokogawa Electric Corporation, Emerson Electric Co., Berthold Technologies, and KEM Electronics. These companies compete through advancements in oscillating U-tube systems, automated calibration, and high-stability temperature control. North America leads the global market with a 36% share, supported by strong pharmaceutical, biotech, and chemical manufacturing activity. Europe follows with a 31% share, driven by strict quality standards and advanced laboratory infrastructure. Asia Pacific continues to expand rapidly with a 24% share, fueled by industrial growth and rising investments in precision testing.
Access crucial information at unmatched prices!
Request your sample report today & start making informed decisions powered by Credence Research Inc.!
Download Sample
Market Insights
- The High Precision Liquid Density Meter market reached USD 148 million in 2024 and will grow to USD 243.11 million by 2032 at a CAGR of 6.4%.
- Market growth is driven by rising demand for automated quality control, with benchtop density meters leading the type segment at 48% share due to high accuracy and laboratory adoption.
- Key trends include strong preference for oscillating U-tube technology, which dominates the measurement technique segment with a 55% share, supported by rapid testing and high precision.
- Leading players such as Anton Paar, METTLER TOLEDO, KEM, Rudolph Research Analytical, Endress+Hauser, and Thermo Fisher compete through digital integration, advanced sensors, and in-line monitoring solutions.
- North America leads with a 36% share, followed by Europe at 31%, while Asia Pacific grows rapidly with a 24% share driven by expanding pharmaceutical, chemical, and biotech industries across major economies.
 Market Segmentation Analysis:
By Type
Benchtop density meters lead this segment with a market share of 48%, driven by their superior accuracy, temperature stability, and suitability for controlled laboratory environments. These systems support complex quality testing across pharmaceuticals, chemicals, and food processing, making them the preferred choice for high-precision workflows. Portable meters gain traction due to field measurement needs, while in-line process meters expand in automated production lines that require continuous monitoring. Growing demand for real-time quality control and digital integration strengthens market growth. Manufacturers focus on advanced sensors, low-maintenance designs, and automated calibration to enhance reliability and adoption across industries.
- For instance, Anton Paar’s DMA 501 uses a digital U-tube sensor that delivers density repeatability of 0.0002 g/cm³ and includes a Peltier-based temperature system with a control accuracy of 0.3 °C.
By Measurement Technique
Oscillating U-tube technology dominates this segment with a market share of 55%, supported by its proven precision, fast measurement cycle, and adaptability across various fluid types. Industries rely on this technique for high-reliability results in pharmaceutical formulation, petrochemical blending, and beverage analysis. Vibrating element technology gains momentum in process environments requiring durable sensors. The hydrostatic pressure method sees selective use in specialized applications but remains less scalable. Growing demand for automated density verification and compatibility with digital lab systems pushes manufacturers to enhance sensitivity, thermal compensation, and error reduction in oscillation-based instruments.
- For instance, Mettler Toledo’s DensitoPro uses an oscillating U-tube module capable of density resolution of 0.0001 g/cm³ and temperature compensation up to 40 °C.
By Application
Pharmaceuticals and biotechnology hold the leading position with a market share of 42%, driven by strict regulatory needs for formulation accuracy, purity assessment, and batch consistency. Density meters support drug development, biologics processing, and quality validation, making them essential tools in regulated labs. The food and beverage sector expands adoption for sugar content testing, alcohol measurement, and ingredient standardization. Chemical and petrochemical industries rely on density evaluation for refining, blending, and fluid characterization. Increasing emphasis on precision, quality assurance, and digital compliance continues to push demand across all key application areas.
Key Growth Drivers
Growing Adoption of Automated Quality Control Systems
Industries increasingly integrate automated quality control systems to enhance accuracy, reduce manual errors, and streamline production workflows. High precision liquid density meters support these needs by offering fast measurements, digital data logging, and seamless connectivity with laboratory information systems. Manufacturers in pharmaceuticals, food processing, and chemicals rely on automated density checks to maintain product consistency and meet regulatory standards. This shift toward automation encourages investment in advanced benchtop and in-line density meters, strengthening market growth. Rising pressure to improve throughput and reduce operational variability continues to drive adoption across global manufacturing environments.
- For instance, Endress+Hauser’s Liquiphant FTL51B can be used with an external Density Computer FML621 to calculate density and concentration values using the sensor’s frequency signal, and supports device integration through communication options such as 4-20mA HART or Bluetooth® wireless technology.
Expansion of Pharmaceutical and Biotech Manufacturing
The rise in biologics, vaccines, and complex drug formulations significantly increases demand for precise liquid characterization tools. Density meters play a vital role in concentration measurement, solvent analysis, and formulation stability testing. Regulatory bodies emphasize stringent quality control, further boosting adoption in research labs and production lines. Growing investment in biotech facilities across Asia Pacific and Europe strengthens the need for high-accuracy density solutions. As pharmaceutical companies scale global operations, advanced density meters become essential for ensuring purity, compliance, and batch-to-batch consistency.
- For instance, Rudolph Research Analytical’s DDM 2911 provides a standard density accuracy of 0.00005 g/cm³ and measures viscosity-corrected density across a temperature range of 0–100 °C.
Increasing Use in Chemical and Petrochemical Process Optimization
Chemical and petrochemical industries prioritize accurate density measurement to support refining, blending, reaction monitoring, and safety compliance. High precision density meters enable real-time insights that improve process efficiency and reduce material waste. In-line systems gain strong traction for continuous monitoring in harsh industrial environments. Rising demand for specialty chemicals and energy storage fluids further expands application scope. As companies pursue operational excellence and tighter control over production parameters, precision density measurement becomes a key requirement across industrial facilities.
Key Trends & Opportunities
Advancements in Digital Integration and Smart Measurement Platforms
Digital connectivity accelerates adoption of density meters with features such as cloud integration, automated calibration, and intelligent error correction. Labs and factories increasingly prefer instruments that sync with LIMS platforms and offer real-time dashboard visibility. Touchscreen interfaces, remote diagnostics, and data traceability enhance usability and compliance. These innovations support faster workflows and create opportunities for next-generation density systems tailored to smart manufacturing environments.
- For instance, Yokogawa’s general-purpose data acquisition systems, such as those in the SMARTDAC+ platform, acquire various data types like temperature and pressure with high accuracy. The data acquisition systems are equipped with an Ethernet interface and support FTP (File Transfer Protocol) for automated, secure file transfer and data redundancy to a file server or PC.
Growth of Portable and Field-Ready Density Measurement Solutions
Demand rises for portable density meters as industries expand field testing needs in oil extraction, wastewater analysis, and energy storage fluids. Compact devices offer rapid readings without extensive laboratory setups, improving operational efficiency in remote sites. Manufacturers invest in rugged designs, battery-efficient components, and multi-parameter measurement capabilities. This trend opens new opportunities for end users requiring mobility and real-time assessment outside controlled environments.
- For instance, KEM’s DA-130N handheld density meter delivers measurement accuracy of with an automatically sensed reading cycle that varies by sample. The device operates for approximately 90 hours on two AAA alkaline batteries. It is a portable device used for reliable field testing in various environments, measuring samples with a viscosity of up to.
Key Challenges
High Cost of Advanced Density Measurement Systems
High precision instruments often involve significant investment due to advanced sensors, thermal stabilization units, and digital control systems. These costs limit adoption among small laboratories, emerging manufacturers, and cost-sensitive industries. Additional expenses for calibration, maintenance, and operator training further increase total ownership. Price barriers restrict wider penetration in developing regions, where low-cost alternatives still dominate. Manufacturers must balance precision with affordability to expand reach.
Operational Limitations in Harsh or Variable Environments
Although advanced density meters offer strong accuracy, performance can vary in extreme temperatures, corrosive media, or high-vibration industrial settings. In-line systems require robust materials and specialized installation to ensure stable readings. Portable models may struggle with rapid temperature fluctuations or inconsistent sample handling. These technical limitations impact measurement reliability, especially in demanding chemical or petrochemical operations. Improved durability and environmental compensation features remain critical for broader adoption.
Regional Analysis
North America
North America holds a market share of 36%, driven by strong adoption of advanced analytical instruments across pharmaceuticals, biotechnology, and chemical processing. The region benefits from well-established laboratory infrastructure and strict regulatory standards that require high-accuracy liquid testing. Demand rises as manufacturers integrate automated density measurement into quality control and research workflows. The U.S. leads due to significant investment in biopharmaceutical production and process monitoring technologies. Growth in battery research and energy storage fluids also supports wider use of precision density meters. Strong presence of global instrument manufacturers further strengthens regional market expansion.
Europe
Europe accounts for a market share of 31%, supported by strong industrial manufacturing, chemical production, and well-developed pharmaceutical ecosystems. Countries such as Germany, Switzerland, and the U.K. adopt high-precision density meters for formulation control, purity verification, and regulatory compliance. The region’s focus on research excellence and automation accelerates demand for benchtop and in-line systems. Environmental monitoring agencies also expand usage for wastewater evaluation and process safety. Strong emphasis on quality assurance and clean production standards continues to drive sustained adoption across laboratories and industrial facilities.
Asia Pacific
Asia Pacific holds a market share of 24%, driven by growing investments in pharmaceuticals, food processing, and specialty chemicals across China, India, Japan, and South Korea. Expanding biotech manufacturing and rising quality-control requirements strengthen demand for high-precision density measurement tools. Rapid industrialization increases adoption of in-line process meters in chemical and petrochemical plants. Regional interest in battery materials and electric vehicle fluids also creates new application opportunities. Improving laboratory infrastructure and growing awareness of automation support long-term market growth across both emerging and developed APAC economies.
Latin America
Latin America captures a market share of 6%, supported by increasing modernization of chemical processing plants, food and beverage industries, and pharmaceutical facilities in Brazil, Mexico, and Argentina. Demand rises for reliable quality-control tools that ensure consistency in production and regulatory compliance. The region gradually adopts benchtop and portable density meters to support laboratory testing and field inspections. Growing investments in petrochemical projects and wastewater treatment also contribute to market expansion. Although adoption remains limited by budget constraints, interest continues to rise among industrial users aiming to improve process accuracy.
Middle East & Africa
The Middle East & Africa region holds a market share of 3%, shaped by demand from oil and gas processing, petrochemical refining, and environmental monitoring sectors. Gulf countries invest in advanced analytical instruments to improve process optimization and ensure fluid quality in large-scale industrial plants. The region also sees growing usage in water treatment and food manufacturing. Adoption remains concentrated within high-investment industries due to the cost of advanced density meters. However, expanding research facilities and industrial automation initiatives support gradual growth across key countries including the UAE, Saudi Arabia, and South Africa.
Market Segmentations:
By Type
- Benchtop Density Meters
- Portable Density Meters
- In-line / Process Density Meters
- Others
By Measurement Technique
- Oscillating U-Tube Technology
- Vibrating Element Technology
- Hydrostatic Pressure Method
- Others
By Application
- Pharmaceuticals & Biotechnology
- Food & Beverage
- Chemical & Petrochemical
- Others
By End-Use Industry
- Industrial Manufacturing
- Laboratory & Research Institutions
- Quality Control & Inspection Facilities
- Environmental Monitoring Agencies
By Geography
- North America
- Europe
- Germany
- France
- U.K.
- Italy
- Spain
- Rest of Europe
- Asia Pacific
- China
- Japan
- India
- South Korea
- South-east Asia
- Rest of Asia Pacific
- Latin America
- Brazil
- Argentina
- Rest of Latin America
- Middle East & Africa
- GCC Countries
- South Africa
- Rest of the Middle East and Africa
Competitive Landscape
The competitive landscape features leading players such as Anton Paar GmbH, METTLER TOLEDO, Kyoto Electronics Manufacturing, Rudolph Research Analytical, Endress+Hauser Group, Thermo Fisher Scientific, Yokogawa Electric Corporation, Emerson Electric Co., Berthold Technologies, and KEM Electronics. These companies strengthen their market position by focusing on high-accuracy measurement technologies, automated calibration systems, and enhanced temperature compensation capabilities. Manufacturers prioritize oscillating U-tube and vibrating element technologies to deliver reliable performance across laboratory and industrial environments. Product innovation centers on digital interfaces, LIMS connectivity, touchscreen controls, and real-time data monitoring. Companies also expand their portfolios with in-line process density meters to address continuous production needs in chemicals, oil and gas, and pharmaceuticals. Strategic partnerships, global distribution expansion, and R&D investments support competitive differentiation. As market demand shifts toward automation, smart capabilities, and low-maintenance systems, leading players continue to enhance precision, durability, and user-friendly designs to attract both industrial and research users.
Key Player Analysis
- Anton Paar GmbH
- METTLER TOLEDO
- Kyoto Electronics Manufacturing (KEM)
- Rudolph Research Analytical
- Endress+Hauser Group
- Thermo Fisher Scientific
- Yokogawa Electric Corporation
- KEM Electronics
- Emerson Electric Co.
- Berthold Technologies
Recent Developments
- In November 2025, the Endress+Hauser Group expanded its Waldheim facility to increase capacity for liquid analysis sensors and components.
- In July 2025, Anton Paar GmbH launched a new generation of digital density meters — from the DMA 502 benchtop units to the highly accurate DMA 6002 with six-digit repeatability.
Shape Your Report to Specific Countries or Regions & Enjoy 30% Off!
Report Coverage
The research report offers an in-depth analysis based on Type, Measurement Technique, Application, End-Use Industry and Geography. It details leading market players, providing an overview of their business, product offerings, investments, revenue streams, and key applications. Additionally, the report includes insights into the competitive environment, SWOT analysis, current market trends, as well as the primary drivers and constraints. Furthermore, it discusses various factors that have driven market expansion in recent years. The report also explores market dynamics, regulatory scenarios, and technological advancements that are shaping the industry. It assesses the impact of external factors and global economic changes on market growth. Lastly, it provides strategic recommendations for new entrants and established companies to navigate the complexities of the market.
Future Outlook
- Demand for automated density measurement will rise as industries adopt digital quality control.
- Adoption of oscillating U-tube technology will strengthen due to its precision and stability.
- In-line process density meters will expand as factories focus on real-time monitoring.
- Portable density meters will gain traction for field testing in oil, energy, and environmental sectors.
- Smart connectivity features and LIMS integration will become standard in laboratory instruments.
- Pharmaceutical and biotech industries will drive strong demand for high-accuracy liquid measurement.
- Chemical and petrochemical plants will invest more in continuous density monitoring systems.
- Manufacturers will focus on improving thermal compensation and vibration resistance.
- Growth in battery materials and energy storage fluids will create new testing requirements.
- Emerging markets will adopt advanced density meters as industrial automation accelerates.



