
Market overview
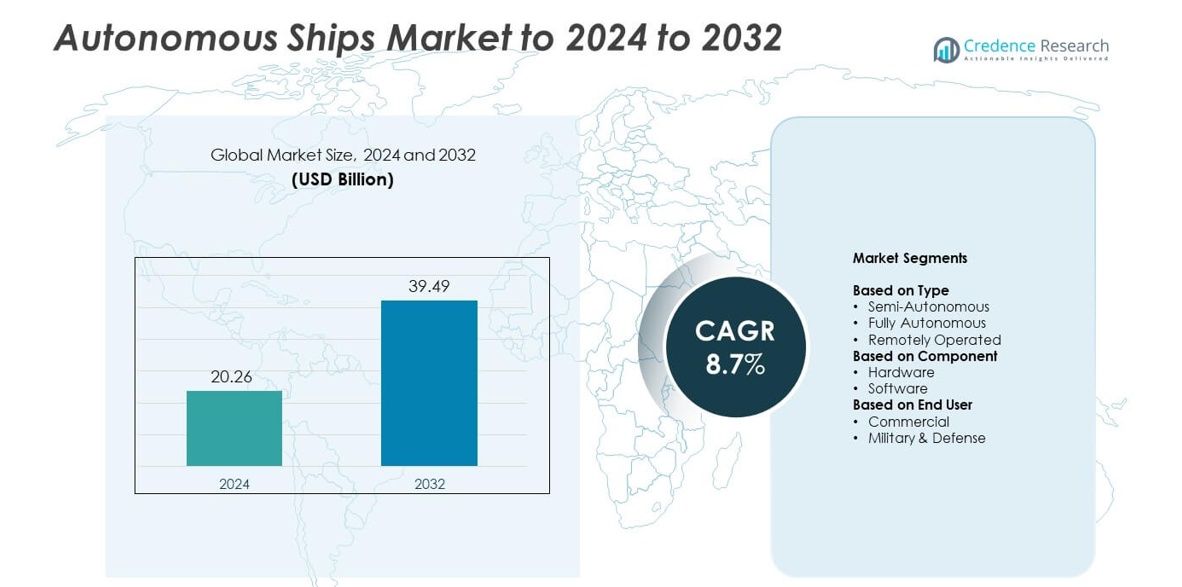
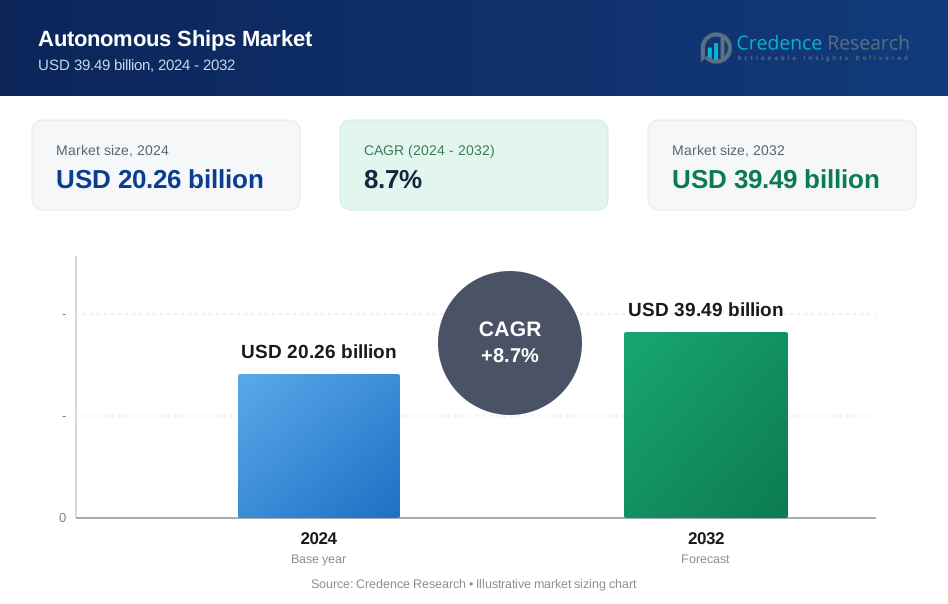
Autonomous Ships Market size was valued at USD 20.26 billion in 2024 and is anticipated to reach USD 39.49 billion by 2032, at a CAGR of 8.7% during the forecast period.
| REPORT ATTRIBUTE | DETAILS |
|---|---|
| Historical Period | 2020-2023 |
| Base Year | 2024 |
| Forecast Period | 2025-2032 |
| Autonomous Ships Market Size 2024 | USD 20.26 billion |
| Autonomous Ships Market, CAGR | 8.7% |
| Autonomous Ships Market Size 2032 | USD 39.49 billion |
The Autonomous Ships Market is shaped by leading companies that advance AI navigation, remote-operation systems, and integrated sensor technologies to support higher autonomy levels across global fleets. These players focus on enhancing safety, improving route efficiency, and reducing crew dependence, which strengthens adoption in both commercial and defense applications. North America emerged as the leading region in 2024 with about 34% share, supported by strong digital port infrastructure and significant investment in unmanned surface vessel programs. Europe followed with roughly 30% share, driven by extensive autonomous ship trials and advanced maritime innovation hubs.
Market Insights
- The Autonomous Ships Market reached USD 20.26 billion in 2024 and is projected to hit USD 39.49 billion by 2032 at a CAGR of 8.7%.
- Market growth is driven by rising demand for reduced-crew operations, improved voyage safety, and wider adoption of AI-based navigation across commercial and defense fleets.
- Key trends include expansion of remote fleet management, deployment of predictive tools, and increasing interest in sustainable and fuel-efficient autonomous vessel designs across major shipping routes.
- Competition intensifies as technology providers upgrade sensors, control systems, and communication platforms, while shipyards integrate advanced autonomy packages to strengthen market positioning.
- North America led the market with about 34% share, followed by Europe at nearly 30% and Asia Pacific at around 27%, while semi-autonomous vessels dominated the type segment with about 46% share.
Market Segmentation Analysis:
By Type
The semi-autonomous category led the Autonomous Ships Market in 2024 with about 46% share. Shipowners favored this type because semi-autonomous vessels balance automation and human oversight, reducing operational errors while keeping costs manageable. The format gained traction in cargo transport and offshore operations due to improved navigation accuracy and lower crew requirements. Fully autonomous vessels grew steadily as AI-based control systems improved, while remotely operated ships advanced in surveillance and short-route applications. Rising demand for safer maritime operations helped strengthen adoption across key shipping fleets.
- For instance, Rolls‑Royce logged close to 400 hours of sea trials of autonomous ferry operations in Finland.
By Component
Hardware dominated the component segment in 2024 with nearly 58% share. Growing installation of sensors, radar units, GPS modules, propulsion control systems, and advanced communication devices supported strong demand. Hardware platforms remained essential for real-time obstacle detection, route optimization, and remote monitoring across complex sea conditions. Software solutions expanded at a faster pace as operators adopted AI navigation, predictive maintenance, and autonomous decision-support tools. Increasing investment in integrated control ecosystems drove long-term growth for software upgrades across commercial and defense fleets.
- For instance, the Furuno FAR-1513 series radar has a transmitter power of 12 kW, while the Furuno FAR-1523 series radar has a transmitter power of 25 kW.
By End User
The commercial segment held the leading position in 2024 with about 62% share due to rapid automation in cargo shipping, container handling, and offshore logistics. Companies adopted autonomous technologies to cut operational costs, increase route efficiency, and improve safety during long voyages. Military and defense applications grew as navies deployed unmanned surface vessels for surveillance, mine-countermeasure missions, and reconnaissance. Rising focus on reduced-crew and crewless maritime operations supported wider adoption across global defense programs.
Key Growth Drivers
Rising Demand for Reduced-Crew and Crewless Operations
Growing pressure to cut operating costs and improve voyage safety pushed shipping companies to adopt reduced-crew and crewless vessel formats. Autonomous navigation systems lowered human error, improved route accuracy, and enabled long-distance operations with fewer personnel. Rising labor shortages across global maritime fleets further strengthened adoption. Freight operators also used autonomous functions to boost fuel efficiency and maintain consistent performance under harsh sea conditions. These factors made reduced-crew capability a major growth driver for the Autonomous Ships Market.
- For instance, Mitsui O.S.K. Lines conducted sea-trials for unmanned or semi-autonomous navigation of commercial vessels over about 750 km in one route.
Advancements in Sensors, AI, and Control Systems
Improved sensor accuracy, machine-learning algorithms, and advanced control units accelerated autonomous vessel development. Modern radar, LiDAR, GPS, and onboard analytics enhanced real-time detection and decision-making during complex marine operations. These technologies supported reliable navigation across congested routes and low-visibility environments. Maritime companies invested heavily in integrated AI platforms to boost vessel autonomy levels. This technological progress established advanced sensor and AI ecosystems as a key growth driver for the Autonomous Ships Market.
- For instance, ABB’s “Ability Marine Pilot Vision” system offers full 360-degree visibility and sensor fusion for real-time situational awareness on vessels.
Expansion of Smart Ports and Digital Maritime Infrastructure
Growth in smart port infrastructure strengthened adoption of autonomous vessels by enabling seamless data exchange between ships and coastal systems. Digital tracking, automated berthing, and high-bandwidth communication networks improved traffic management and reduced docking delays. Shipping companies adopted these capabilities to cut turnaround time and enhance cargo handling efficiency. Governments invested in port modernization to support future autonomous fleet deployment. This broad digital expansion acted as a key growth driver within the Autonomous Ships Market.
Key Trends and Opportunities
Growth of Remote Fleet Management and Predictive Operations
Maritime operators expanded remote-control centers to manage vessel fleets from land-based hubs. This trend improved operational visibility, reduced onboard staffing needs, and enabled continuous monitoring across global routes. Predictive analytics created new opportunities by reducing maintenance disruptions and improving fuel use. Companies used data-driven insights to optimize shipping schedules and avoid risk zones. Remote and predictive capabilities positioned the market for long-term digital transformation.
- For instance, The autonomous and fully electric container vessel Yara Birkeland was a collaboration between the chemical company Yara International (owner) and the maritime technology company Kongsberg, and built by the Norwegian shipbuilder Vard. The vessel is 80 meters (262 feet) long with a beam (width) of approximately 15 meters (49 feet).
Increased Deployment of Autonomous Systems in Defense Operations
Navies adopted autonomous surface vessels for surveillance, reconnaissance, and mine-countermeasure missions. These platforms offered low-risk operation in high-threat environments and supported real-time intelligence gathering. Defense agencies invested in high-end navigation, communication encryption, and multi-vessel coordination systems. Growing military interest opened new opportunities for manufacturers to supply purpose-built unmanned vessels. This defense-focused adoption shaped one of the strongest trends and opportunities in the Autonomous Ships Market.
- For instance, Elbit Systems’ “Seagull USV” can operate continuously for more than 4 days at sea and is designed for unmanned surface missions.
Rising Interest in Sustainable and Fuel-Efficient Autonomous Vessels
Shipping companies sought autonomous designs that reduce emissions and improve fuel savings. AI-based routing optimized engine loads and selected low-consumption pathways for long voyages. Electric and hybrid propulsion systems gained traction as operators pursued greener operations. Governments supported this shift with emission targets and carbon-reduction mandates. The push toward sustainability created strong opportunities for next-generation autonomous vessel development.
Key Challenges
High Integration Costs and Limited Return for Small Operators
Autonomous vessels require significant investment in sensors, communication units, AI software, and navigation hardware. Many small and mid-size shipping companies found these upfront costs difficult to justify without immediate financial return. Integration became more complex for older fleets where retrofitting required major structural updates. These cost pressures slowed adoption and formed a key challenge for the Autonomous Ships Market.
Regulatory Gaps and Safety Compliance Issues
Global maritime regulations for autonomous vessels remain incomplete, creating uncertainty for commercial deployment. Differences in national rules complicate cross-border routes and slow large-scale adoption. Safety certification, liability rules, and collision-avoidance guidelines continue to evolve, causing delays for manufacturers and operators. Ensuring compliance across diverse shipping regions remains a key challenge affecting market expansion.
Regional Analysis
North America
North America led the Autonomous Ships Market in 2024 with about 34% share due to strong adoption of advanced navigation systems, high defense spending, and early deployment of semi-autonomous commercial vessels. The U.S. invested in unmanned surface vessels for surveillance and logistics, while Canada supported upgrades in maritime safety technologies. Strong digital port infrastructure and active technology partnerships between shipbuilders and AI firms improved operational readiness. Growing interest in reduced-crew shipping and robust regulatory frameworks further strengthened the region’s leadership.
Europe
Europe held roughly 30% share in 2024, supported by strong maritime innovation programs and active government initiatives promoting autonomous vessel trials. Norway, Finland, and the U.K. led development with purpose-built test zones, zero-emission vessel research, and remote-operation centers. Commercial operators adopted autonomous solutions to improve safety across busy shipping lanes and cut emissions under strict environmental mandates. Integration of smart port systems across Western Europe supported smoother data exchange, making the region a major hub for autonomous maritime advancements.
Asia Pacific
Asia Pacific accounted for about 27% share in 2024, driven by rapid expansion in commercial shipping, strong investment in digital port infrastructure, and rising defense modernization programs. China, Japan, and South Korea advanced domestic autonomous shipbuilding projects and strengthened AI-based navigation research. Large fleet sizes and high cargo traffic supported strong adoption across commercial routes. Regional governments encouraged smart maritime corridors to improve logistics flow. Demand for reduced-crew vessels in coastal and intra-Asia trade boosted long-term growth potential.
Latin America
Latin America captured close to 5% share in 2024, supported by gradual adoption of digital maritime systems and rising investments in port modernization. Brazil and Mexico led regional activity with increased interest in autonomous technologies for offshore energy, coastal surveillance, and cargo handling. Limited funding and slower regulatory development kept adoption moderate, yet pilot projects expanded across major ports. Growth potential improved as shipping companies explored reduced-crew formats to lower operational costs and enhance route efficiency.
Middle East and Africa
Middle East and Africa held about 4% share in 2024, driven by selective adoption across high-value maritime hubs such as the UAE, Saudi Arabia, and South Africa. Governments invested in smart port development to strengthen trade efficiency and support future autonomous vessel operations. Defense agencies explored unmanned surface platforms for surveillance in strategic waters. Although overall adoption remained early-stage due to cost and capability gaps, strong port-centric growth and rising digitalization supported steady progress.
Market Segmentations:
By Type
- Semi-Autonomous
- Fully Autonomous
- Remotely Operated
By Component
- Hardware
- Software
By End User
- Commercial
- Military & Defense
By Geography
- North America
- U.S.
- Canada
- Mexico
- Europe
- Germany
- France
- U.K.
- Italy
- Spain
- Rest of Europe
- Asia Pacific
- China
- Japan
- India
- South Korea
- South-east Asia
- Rest of Asia Pacific
- Latin America
- Brazil
- Argentina
- Rest of Latin America
- Middle East & Africa
- GCC Countries
- South Africa
- Rest of the Middle East and Africa
Competitive Landscape
The Autonomous Ships Market features major players such as Marine Technologies LLC, ABB Ltd., Ulstein Group ASA, Northrop Grumman, Kongsberg Gruppen, Honeywell International, L3 ASV, Mitsui OSK. Lines, and Rolls-Royce. These companies strengthen market competition through advanced navigation platforms, AI-based control systems, and integrated sensor architectures designed for safer and more efficient maritime operations. Vendors focus on upgrading remote-operation capabilities, enhancing collision-avoidance performance, and expanding autonomous solutions for commercial and defense vessels. Investment in digital twins, predictive maintenance systems, and real-time monitoring tools supports long-term value creation. Strong partnerships with shipyards, port authorities, and technology firms accelerate system deployment across global fleets. Continuous innovation in propulsion control, communication networks, and smart routing drives the market toward higher autonomy levels.
Key Player Analysis
- Marine Technologies LLC
- ABB Ltd.
- Ulstein Group ASA
- Northrop Grumman
- Kongsberg Gruppen
- Honeywell International
- L3 ASV
- Mitsui OSK. Lines
- Rolls-Royce
Recent Developments
- In 2025, Honeywell and Near Earth Autonomy completed the first autonomous test flight of a Leonardo AW139 helicopter as part of the U.S. Marine Corps Aerial Logistics Connector program
- In 2024, L3Harris (formerly L3 ASV) and Seasats successfully tested an advanced autonomous surface vessel (ASV) by completing a 2,500-mile journey from San Diego to Pearl Harbor, Hawaii.
- In 2024, Northrop Grumman showcased autonomous naval warfare capabilities through its Helix and Scion systems, which integrate autonomous surface vehicles (USVs) with electronic warfare payloads
Report Coverage
The research report offers an in-depth analysis based on Type, Component, End-User and Geography. It details leading market players, providing an overview of their business, product offerings, investments, revenue streams, and key applications. Additionally, the report includes insights into the competitive environment, SWOT analysis, current market trends, as well as the primary drivers and constraints. Furthermore, it discusses various factors that have driven market expansion in recent years. The report also explores market dynamics, regulatory scenarios, and technological advancements that are shaping the industry. It assesses the impact of external factors and global economic changes on market growth. Lastly, it provides strategic recommendations for new entrants and established companies to navigate the complexities of the market.
Future Outlook
- The market will shift toward higher autonomy levels across commercial and defense fleets.
- Remote fleet management centers will expand as operators rely more on land-based control.
- AI-driven navigation and decision systems will become standard in new vessel designs.
- Smart port integration will improve data flow and support smoother autonomous operations.
- Demand for reduced-crew ships will rise due to labor shortages and safety needs.
- Defense agencies will increase deployment of unmanned surface vessels for key missions.
- Sustainable and fuel-efficient autonomous vessels will gain stronger adoption.
- Regulatory frameworks will mature, enabling safer global deployment.
- Retrofitting older fleets with autonomous systems will become more common.
- Collaboration between shipbuilders and tech firms will accelerate innovation in autonomy.
Request a Free Sample
Fill in your details and we'll send you a free sample report.
- Sample data tables & charts
- Research methodology
Need a Custom Version of This Report?
Tailor the scope, geography, or segments to your exact requirements.
- Custom geography or segment scope
- Direct access to our analyst team
Frequently Asked Questions
What is the current market size for Autonomous Ships Market, and what is its projected size in 2032?
At what Compound Annual Growth Rate is the Autonomous Ships Market projected to grow between 2025 and 2032?
What is the Autonomous Ships Market CAGR?
Who are the major players in this market?
Who are the leading companies in the Autonomous Ships Market?
Which region commanded the largest share of the Autonomous Ships Market in 2024?
Table of Content
Chapter 1. Report Introduction
- 1.1 Report Description & Purpose
- 1.1.1 Report Title & Market Definition
- 1.1.2 Unique Selling Propositions (USP) & Key Differentiators
- 1.1.3 Value Proposition for Stakeholders
- 1.2 Research Objectives
- 1.2.1 Market Sizing Objectives (Volume & Revenue) (Volume Where Applicable)
- 1.2.2 Segmentation Objectives
- 1.2.3 Competitive Intelligence Objectives
- 1.2.4 Forecast & Scenario Objectives
- 1.3 Report Scope
- 1.3.1 Autonomous Ships Scope – Segments & Subsegments Covered
- 1.3.2 Geographic Scope – Regions & Countries Covered
- 1.3.3 Historical Period, Base Year & Forecast Period (2024; forecast to 2032)
- 1.3.4 Inclusions & Exclusions
- 1.4 Industry Classification & Applicable Codes
- 1.5 Currency, Measurement Units & Valuation Basis
- 1.6 Target Stakeholders
- 1.7 Limitations & Assumptions
Chapter 2. Executive Summary
- 2.1 Global Autonomous Ships Market Snapshot
- 2.1.1 Market Size – Historical (2024) & Forecast (2024-2032) (2024: USD 20.26 billion → 2032: USD 39.49 billion)
- 2.1.2 Volume & Revenue – Global Totals (Volume Where Applicable)
- 2.1.3 Key Market Highlights – Top Five Facts
- 2.2 Autonomous Ships Market Segmentation Snapshot
- 2.2.1 Market Split by Region – 2024 vs. 2032
- 2.3 Competitive Snapshot
- 2.3.1 Top 10 Players by Revenue Share – 2024
- 2.3.2 Top 10 Players by Volume Share – 2024 (Volume Where Applicable)
- 2.3.3 Recent Strategic Developments (18-Month Summary)
- 2.4 Key Investment Highlights & Strategic Conclusions
Chapter 3. Autonomous Ships Market Dynamics & Industry Analysis
- 3.1 Market Overview & Context
- 3.1.1 Autonomous Ships Market Position in the Broader Industry Value Chain
- 3.1.2 Demand Structure & Purchasing Dynamics
- 3.1.3 Market Maturity & Development Stage by Region
- 3.2 Autonomous Ships Market Drivers
- 3.3 Autonomous Ships Market Restraints & Challenges
- 3.4 Autonomous Ships Market Opportunities
- 3.5 Porter's Five Forces Analysis
- 3.5.1 Threat of New Entrants
- 3.5.2 Bargaining Power of Suppliers
- 3.5.3 Bargaining Power of Buyers
- 3.5.4 Threat of Substitutes
- 3.5.5 Competitive Rivalry – Intensity Assessment
- 3.6 Autonomous Ships Value Chain Analysis
- 3.6.1 Upstream – Key Inputs, Resources & Suppliers
- 3.6.1.1 Key Input/Resource 1
- 3.6.1.2 Key Input/Resource 2
- 3.6.1.3 Key Input/Resource 3
- 3.6.2 Midstream – Core Operations & Value Creation
- 3.6.2.1 Operating Model & Process Overview
- 3.6.2.2 Key Operating Locations & Capabilities by Company
- 3.6.3 Downstream – Market Channels & End Users
- 3.6.3.1 Direct Sales & Customer Engagement Channels
- 3.6.3.2 Indirect Sales, Intermediaries & Partner Channels
- 3.6.4 Value Chain Profitability Analysis
- 3.6.1 Upstream – Key Inputs, Resources & Suppliers
- 3.7 PESTEL Analysis
- 3.7.1 Political Factors
- 3.7.2 Economic Factors
- 3.7.3 Social Factors
- 3.7.4 Technological Factors
- 3.7.5 Environmental Factors
- 3.7.6 Legal Factors
- 3.8 Autonomous Ships Supply Chain Analysis
- 3.8.1 Critical Input & Resource Availability Risk Assessment
- 3.8.2 Supplier & Operational Concentration Risk (Geographic Exposure)
- 3.8.3 Supply & Service Disruption Impact Analysis
- 3.9 Regulatory & Policy Landscape
Note: The regulatory and policy landscape section covers regulations based on their applicability to the market, Autonomous Ships category, geography, and scope of the study. Only regulatory frameworks with a material impact on operations, compliance, trade, sustainability, or market access are analyzed in detail.
Chapter 4. Key Investment Pockets & Opportunity Analysis
- 4.1 Autonomous Ships Market Attractiveness Analysis
- 4.1.1 By Region – Investment Attractiveness Matrix (Market Size × CAGR)
- 4.2 Absolute Revenue Growth Opportunity
- 4.2.1 By Region – Absolute Revenue Growth Through 2032
- 4.3 Incremental Demand Opportunity
- 4.3.1 By Region – Incremental Demand Through 2032
- 4.3.2 Segment – Incremental Demand
- 4.4 Emerging Submarket Opportunity Deep Dive (Subject to Applicability)
- 4.5 Priority Market Opportunity Scorecards
- 4.5.1 United States
- 4.5.2 Europe
- 4.5.3 Asia
- 4.5.4 Middle East & Africa
Note: Priority market opportunity scorecards reflect the geographic scope and strategic relevance of the study. Listed markets are indicative and may be adapted to the industry.
Chapter 5. Autonomous Ships Cross-Border Trade & Market Access Analysis
- 5.1 International Trade & Cross-Border Activity Overview
- 5.1.1 Global Export Value by Country (2024)
- 5.1.2 Global Export Volume by Country (2024) (Volume Where Applicable)
- 5.1.3 Global Import Value by Country (2024)
- 5.1.4 Global Import Volume by Country (2024) (Volume Where Applicable)
- 5.1.5 Net Trade Balance by Country (2024)
- 5.2 Export Analysis – Segment
- 5.2.1 Category 1 (Applicable Classification Code)
- 5.2.2 Category 2 (Applicable Classification Code)
- 5.2.3 Category 3 (Applicable Classification Code)
- 5.2.4 Category 4 (Applicable Classification Code)
- 5.2.5 Category 5 (Applicable Classification Code)
- 5.3 Import Analysis – Segment
- 5.3.1 Category 1 (Applicable Classification Code)
- 5.3.2 Category 2 (Applicable Classification Code)
- 5.3.3 Category 3 (Applicable Classification Code)
- 5.3.4 Category 4 (Applicable Classification Code)
- 5.3.5 Category 5 (Applicable Classification Code)
- 5.4 Cross-Border Pricing & Transaction Benchmarks
- 5.4.1 Export Pricing – Segment & Country
- 5.4.2 Import Pricing – Segment & Source Country
- 5.4.3 Price Trends (2024)
- 5.5 Key Cross-Border Trade & Delivery Routes
- 5.5.1 Cross-Border Trade/Delivery Route 1
- 5.5.2 Cross-Border Trade/Delivery Route 2
- 5.5.3 Cross-Border Trade/Delivery Route 3
- 5.5.4 Cross-Border Trade/Delivery Route 4
- 5.5.5 Cross-Border Trade/Delivery Route 5
- 5.6 Trade Policy & Market Access Impact Assessment
- 5.6.1 Tariff & Non-Tariff Barriers
- 5.6.2 Regional Trade & Economic Integration Frameworks
- 5.6.3 Bilateral & Multilateral Trade Agreements
- 5.6.4 Cross-Border Operating, Licensing & Localization Requirements
Note: This chapter applies where cross-border trade or delivery is relevant to Autonomous Ships. Goods, services, and digital offerings are assessed using applicable classifications and transaction measures. Import-export volumes, trade balances, and route analyses are included only where meaningful to the market.
Chapter 6. Competitive Landscape & Company Benchmarking
- 6.1 Autonomous Ships Market Concentration & Structure
- 6.1.1 Herfindahl-Hirschman Index (HHI) – vs. 2024
- 6.1.2 Leading, Mid-Sized & Emerging Player Structure
- 6.1.3 Global, Regional & Local Player Dynamics
- 6.2 Autonomous Ships Market Share Analysis – 2024
- 6.2.1 Global Revenue Share by Company
- 6.2.2 Global Volume Share by Company (Volume Where Applicable)
- 6.2.3 Regional Revenue Share
- 6.2.4 Market Share Evolution ( vs. 2024)
- 6.2.5 Company Market Share by Key Segment
- 6.2.6 Company Market Share by Customer Group
- 6.3 Operating Scale, Capacity & Infrastructure Analysis
- 6.3.1 Global Operating Scale & Supply Capacity
- 6.3.2 Resource Utilization & Operating Efficiency
- 6.3.3 Output, Service Delivery & Activity Metrics
- 6.3.4 Operating Footprint & Infrastructure Map
- 6.3.5 Planned Operational & Capacity Expansion
- 6.4 Autonomous Ships Competitive Benchmarking Matrix
- 6.4.1 Revenue, Growth, Profitability & Operating Metric Comparison
- 6.4.2 Channel Revenue Mix
- 6.4.3 Geographic Revenue Exposure
- 6.4.4 R&D Intensity
- 6.4.5 Sustainability Maturity
- 6.5 Strategic Developments in Autonomous Ships (Last 24 Months)
- 6.5.1 Mergers, Acquisitions & Divestments
- 6.5.2 New Products, Services & Solutions in Autonomous Ships
- 6.5.3 Operational & Infrastructure Expansions
- 6.5.4 Strategic Alliances, Joint Ventures & Partnerships
- 6.5.5 Distribution Expansion & Market Entry
- 6.5.6 Sustainability & ESG Initiatives
- 6.6 Competitive Strategy Mapping
- 6.6.1 Leader, Challenger, Follower & Niche Classification
- 6.6.2 Pricing Strategy Comparison
- 6.6.3 Channel Strategy Matrix
Note: Strategic developments are included based on their materiality and the availability of reliable information.
Chapter 7. Global Autonomous Ships Market – By Sales & Delivery Channel
- 7.1 Segment Overview
- 7.1.1 Volume & Revenue Split by Channel (2024 & 2032) (Volume Where Applicable)
- 7.1.2 Channel Mix Evolution (2024-2032)
Chapter 8. Regional Market Analysis – Global Overview
- 8.1 Global Regional Overview
- 8.1.1 Regional Volume Share (Volume Where Applicable)
- 8.1.2 Regional Revenue Share
- 8.1.3 Regional Volume by Region (Volume Where Applicable)
- 8.1.4 Regional Revenue by Region
- 8.1.5 Regional Forecast Through 2032
- 8.2 Cross-Regional Segment Analysis
- 8.2.1 By Sales & Delivery Channel
- 8.2.2 By Competitive Positioning & Price Tier
Chapter 9. North America Autonomous Ships Market
- 9.1 United States
- 9.2 Canada
- 9.3 Mexico
Chapter 10. Europe Autonomous Ships Market
- 10.1 Germany
- 10.2 France
- 10.3 Italy
- 10.4 United Kingdom
- 10.5 Spain
- 10.6 Poland
- 10.7 Russia
- 10.8 Netherlands
- 10.9 Belgium
- 10.10 Sweden
- 10.11 Denmark
- 10.12 Norway
- 10.13 Rest of Europe
Chapter 11. Asia Pacific Autonomous Ships Market
- 11.1 China
- 11.2 India
- 11.3 Japan
- 11.4 South Korea
- 11.5 Thailand
- 11.6 Indonesia
- 11.7 Vietnam
- 11.8 Malaysia
- 11.9 Australia
- 11.10 Rest of Asia Pacific
Chapter 12. Latin America Autonomous Ships Market
- 12.1 Brazil
- 12.2 Argentina
- 12.3 Colombia
- 12.4 Chile
- 12.5 Rest of Latin America
Chapter 13. Middle East Autonomous Ships Market
- 13.1 Saudi Arabia
- 13.2 United Arab Emirates
- 13.3 Turkey
- 13.4 Israel
- 13.5 Iran
- 13.6 Rest of the Middle East
Chapter 14. Africa Autonomous Ships Market
- 14.1 South Africa
- 14.2 Egypt
- 14.3 Nigeria
- 14.4 Morocco
- 14.5 Rest of Africa
Chapter 15. Autonomous Ships Company Profiles
- 15.1 [Company 01]
- 15.1.1 Company Overview
- 15.1.2 Key Management Personnel
- 15.1.3 Products & Services Portfolio
- 15.1.4 Financial Performance
- 15.1.5 Key Market Focus & Geographic Presence
- 15.1.6 Recent Developments & Strategic Initiatives
Note: The company profile list is preliminary and may change based on research findings, market developments, data availability, and client requirements.
Chapter 16. Appendices
- Appendix A – List of Abbreviations & Acronyms
- Appendix B – Industry Classification Code Reference – Full Series
- Appendix C – Supply, Output & Operating Capacity Data Tables
- Appendix D – End-Use & Demand Base Tables
- Appendix E – Demand, Adoption & Usage Assumptions
- Appendix F – Pricing & Revenue Metric Reference Tables
- Appendix G – Company Operations & Infrastructure Database
- Appendix H – Cross-Border Trade & Activity Data Tables (Where Applicable)
- Appendix I – Regulatory Summary Tables
- Appendix J – Primary Research Participant List (Anonymized)
- Appendix K – Primary Research Questionnaire Framework
- Appendix L – Data Sources & Bibliography
- Appendix M – Market Size Divergence & Source Comparison
Chapter 17. Research Methodology
- 17.1 Research Framework & Philosophy
- 17.2 Secondary Research – Sources, Hierarchy & Data Extraction
- 17.3 Data Modeling – Bottom-Up & Top-Down Market Sizing
- 17.4 Primary Research – Stakeholder Framework, LOI & Sample Sizes
- 17.5 Forecast Methodology – Regression, Scenario & Sensitivity Analysis
- 17.6 Quality Control – Four-Layer Validation Framework
- 17.7 Limitations & Standard Assumptions
- 17.8 Disclaimer
