
Market Overview
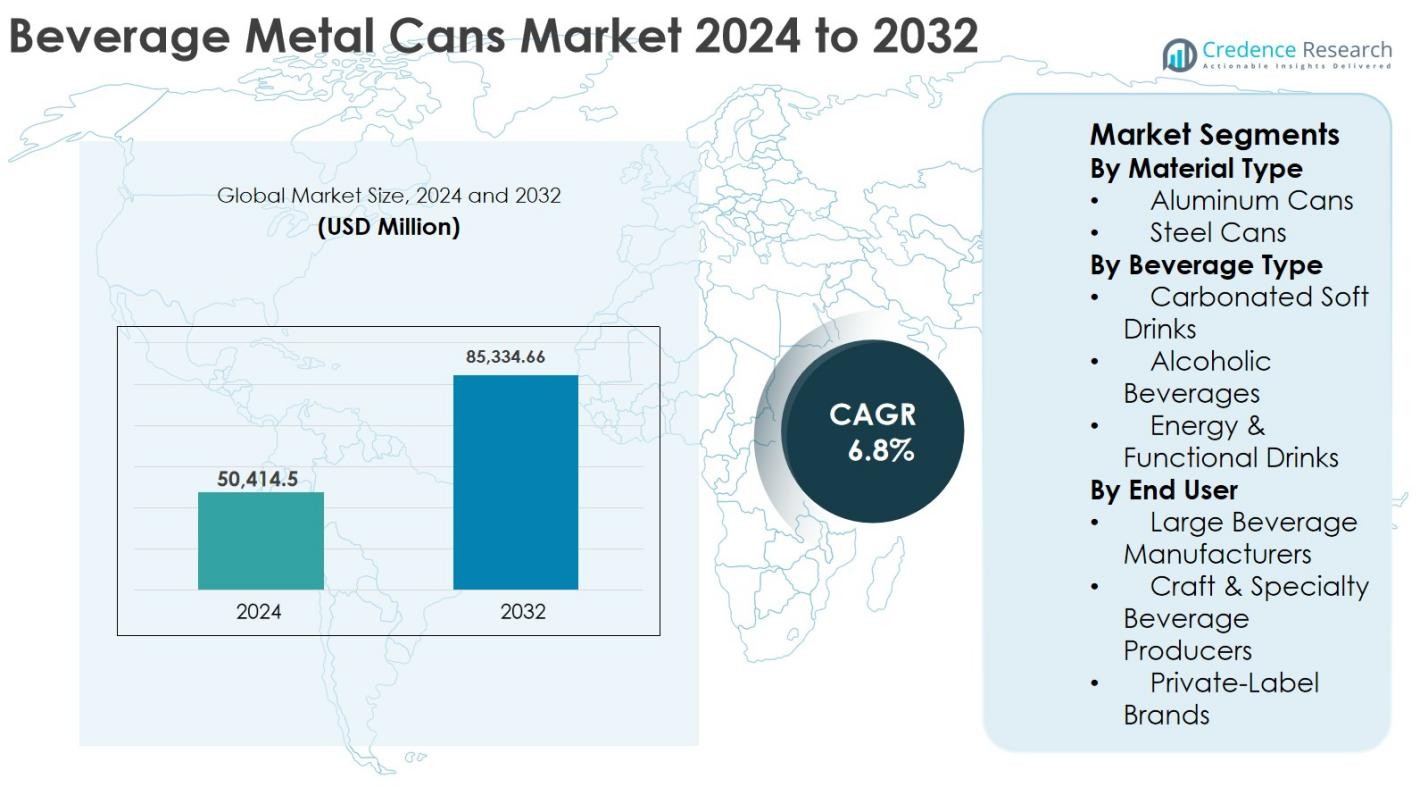
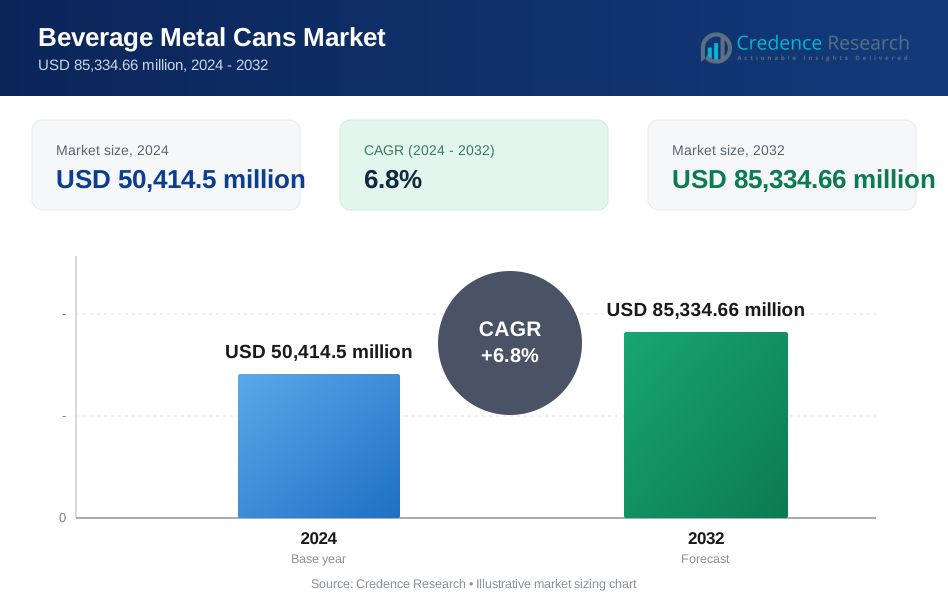
The Beverage Metal Cans Market size was valued at USD 50,414.5 million in 2024 and is anticipated to reach USD 85,334.66 million by 2032, growing at a CAGR of 6.8% during the forecast period.
| REPORT ATTRIBUTE | DETAILS |
|---|---|
| Historical Period | 2020-2023 |
| Base Year | 2024 |
| Forecast Period | 2025-2032 |
| Beverage Metal Cans Market Size 2024 | USD 50,414.5 Million |
| Beverage Metal Cans Market, CAGR | 6.8% |
| Beverage Metal Cans Market Size 2032 | USD 85,334.66 Million |
The Beverage Metal Cans Market is driven by leading players including Ball Corporation, Crown Holdings, Ardagh Group, CANPACK, Amcor plc, Silgan Containers, Orora Packaging Australia, SHOWA DENKO K.K., Envases Group, and ZI Industries, which focus on expanding production capacity, lightweight aluminum can innovation, and sustainable packaging solutions. These companies leverage long-term supply contracts with global beverage brands and invest in advanced manufacturing technologies to enhance efficiency and reduce environmental impact. Regionally, North America leads the Beverage Metal Cans Market with a 36% share in 2024, supported by high consumption of canned beverages and strong recycling infrastructure. Europe follows with a 27% share, driven by stringent environmental regulations and high aluminum recycling rates, while Asia-Pacific holds 25% share, supported by rapid urbanization, rising disposable incomes, and expanding beverage production capacity.
Market Insights
- Beverage Metal Cans Market size was valued at USD 50,414.5 million in 2024 and is projected to reach USD 85,334.66 million by 2032, growing at a CAGR of 6.8% during the forecast period.
- Market growth is driven by rising demand for sustainable and recyclable packaging, increasing consumption of ready-to-drink beverages, and strong preference for aluminum cans due to lightweight properties and high recycling efficiency across global beverage brands.
- Key trends include lightweight can innovation, premium and customized can designs, and growing adoption of metal cans in energy drinks and RTD alcoholic beverages, with aluminum cans dominating the material segment at around 72% market share in 2024.
- The competitive landscape is shaped by major players focusing on capacity expansion, long-term supply agreements, and sustainability initiatives, while regional and smaller players compete through customization and flexible production volumes.
- Regionally, North America leads with 36% market share, followed by Europe at 27% and Asia-Pacific at 25%, while carbonated soft drinks remain the largest beverage segment with approximately 41% share in 2024.
 Market Segmentation Analysis:
By Material Type
The Beverage Metal Cans Market, by material type, is dominated by aluminum cans, which accounted for 72% market share in 2024. Aluminum cans lead due to their lightweight structure, superior recyclability, high corrosion resistance, and cost efficiency in large-scale beverage distribution. Rising sustainability commitments by global beverage brands and increasing recycling rates across North America and Europe continue to strengthen aluminum adoption. Steel cans hold the remaining share, supported by durability and niche usage, but face declining preference compared to aluminum due to higher weight and transportation costs.
- For instance, Coca‑Cola reports that in the U.S. its aluminum cans are on average made with about 70% recycled content and are among its most frequently recycled packages.
By Beverage Type
By beverage type, carbonated soft drinks held the dominant position in the Beverage Metal Cans Market with 41% market share in 2024. This leadership is driven by high global consumption volumes, strong brand presence, and long-standing compatibility of carbonated beverages with metal can packaging. Alcoholic beverages, particularly beer and RTD drinks, represent a significant share, supported by premiumization and portability trends. Energy and functional drinks are the fastest-growing segment, driven by lifestyle changes, youth consumption, and frequent product innovations using sleek can designs.
- For instance, Heineken has increasingly shifted to aluminum cans for brands like Heineken and Amstel in several markets to improve convenience and recycling performance.
By End User
Based on end users, large beverage manufacturers dominated the Beverage Metal Cans Market, accounting for 68% market share in 2024. Their dominance is supported by high-volume production requirements, strong supply chain integration, and long-term contracts with can manufacturers. Major brands increasingly prefer metal cans for branding consistency and sustainability goals. Craft and specialty beverage producers are expanding steadily due to demand for customization and premium positioning. Private-label brands are also gaining share as retailers expand cost-effective, recyclable beverage packaging offerings.
Key Growth Drivers
Rising Demand for Sustainable and Recyclable Packaging
Sustainability is a major growth driver in the Beverage Metal Cans Market as beverage producers increasingly prioritize recyclable and environmentally responsible packaging solutions. Metal cans, especially aluminum, offer high recyclability and support circular economy objectives, making them attractive alternatives to plastic packaging. Government regulations promoting recycling, extended producer responsibility, and waste reduction are strengthening demand for metal cans across developed and emerging markets. Consumers are also showing stronger preference for sustainable packaging, influencing brand decisions. Beverage companies are setting higher recycled-content targets and reducing carbon footprints, further accelerating adoption. These factors collectively reinforce long-term demand for beverage metal cans across carbonated drinks, alcoholic beverages, and functional drink segments.
- For instance, Ball Corporation reports that aluminum cans are one of the most recycled beverage packages globally and that around 75% of all aluminum ever produced is still in use today.
Growth of Ready-to-Drink and On-the-Go Beverage Consumption
The increasing consumption of ready-to-drink and on-the-go beverages strongly drives the Beverage Metal Cans Market. Urban lifestyles, busy work patterns, and demand for convenient packaging favor single-serve and portable beverage formats. Metal cans provide excellent protection against light and oxygen, preserving product quality and extending shelf life. This makes them ideal for energy drinks, RTD alcoholic beverages, and functional drinks. Growth in convenience retail channels, vending machines, and e-commerce grocery platforms further supports demand. Beverage brands also prefer cans for their stackability and transportation efficiency. Together, these factors contribute to steady growth in metal can adoption worldwide.
- For instance, Red Bull sells virtually all of its products in slim aluminum cans, emphasizing portability and durability for on‑the‑go consumption, while Monster Beverage reports that canned formats remain the core packaging for its flagship energy SKUs.
Expansion of Beverage Production Capacity in Emerging Markets
Expanding beverage production capacity in emerging economies is a key driver for the Beverage Metal Cans Market. Rapid urbanization, rising disposable incomes, and changing consumer preferences are increasing demand for packaged beverages in Asia-Pacific, Latin America, and the Middle East. Global beverage companies are investing in new manufacturing and canning facilities to meet regional demand. Local beverage brands are also adopting metal cans to enhance shelf appeal and improve product differentiation. Improvements in recycling infrastructure and aluminum processing capacity further support market growth. These developments are strengthening long-term demand for beverage metal cans across both mass-market and premium beverage categories.
Key Trends & Opportunities
Lightweighting and Material Efficiency Innovations
Lightweighting has emerged as a key trend and opportunity in the Beverage Metal Cans Market. Manufacturers are developing thinner yet durable can designs using advanced alloys and forming technologies. These innovations reduce raw material consumption, lower transportation costs, and decrease carbon emissions. Beverage brands increasingly favor lightweight cans to support sustainability targets and cost optimization strategies. Material efficiency improvements also help manufacturers mitigate the impact of raw material price volatility. As technology advances, further reductions in can weight are expected without compromising performance. This trend offers long-term benefits for both can producers and beverage companies across global markets.
- For instance, Crown Holdings highlights in its sustainability communications that its lightweight can designs help customers lower their carbon footprint and reduce aluminum consumption per unit.
Premiumization and Customization of Can Designs
Premiumization is creating strong opportunities in the Beverage Metal Cans Market, particularly for alcoholic beverages, energy drinks, and specialty beverages. Brands are increasingly using custom graphics, matte finishes, embossing, and innovative can shapes to stand out on retail shelves. Metal cans provide excellent print quality and design flexibility, supporting brand storytelling and consumer engagement. Craft beverage producers and limited-edition launches are driving demand for customized, shorter production runs. As competition intensifies, visually appealing metal cans are becoming an important marketing tool. This trend supports higher-margin products and strengthens brand differentiation.
- For instance, many craft breweries in the U.S. and Europe have shifted from bottles to printed cans with high-impact artwork to attract consumers in retail coolers and taproom takeaway sales.
Key Challenges
Volatility in Aluminum and Steel Raw Material Prices
Raw material price volatility remains a significant challenge in the Beverage Metal Cans Market. Aluminum and steel prices fluctuate due to energy costs, geopolitical tensions, supply disruptions, and global demand changes. These fluctuations directly affect production costs and profit margins for can manufacturers. Long-term supply contracts with beverage companies often limit the ability to pass on cost increases. Smaller manufacturers face greater exposure due to limited hedging capabilities. Managing price volatility requires effective procurement strategies, operational efficiency, and long-term supplier partnerships. Persistent cost uncertainty can impact investment planning and pricing stability across the market.
Competition from Alternative Packaging Formats
The Beverage Metal Cans Market faces strong competition from alternative packaging formats such as PET bottles, glass bottles, and paper-based cartons. Plastic packaging remains cost-effective and widely available, particularly in price-sensitive regions. Glass bottles continue to hold preference in certain premium and traditional beverage segments. Additionally, innovation in biodegradable and lightweight packaging materials is intensifying competition. While metal cans offer sustainability, durability, and shelf-life advantages, overcoming cost pressures and established consumer habits remains challenging. Continuous innovation, branding advantages, and sustainability positioning are essential for metal cans to maintain and expand market share.
Regional Analysis
North America
North America held the largest share of the Beverage Metal Cans Market, accounting for 36% of global revenue in 2024. The region’s dominance is driven by high consumption of carbonated soft drinks, beer, and energy drinks, along with strong sustainability regulations supporting metal packaging. Well-established recycling infrastructure, high aluminum recycling rates, and strong commitments from major beverage brands to reduce plastic usage continue to favor metal cans. The presence of leading can manufacturers and advanced production technologies further supports market leadership. Growth remains stable, supported by premium beverages, RTD alcoholic drinks, and functional beverage demand.
Europe
Europe accounted for 27% market share in 2024 in the Beverage Metal Cans Market, supported by strict environmental regulations and high recycling efficiency across key countries. Deposit return schemes and circular economy policies strongly encourage aluminum can usage over plastic packaging. Beer, carbonated soft drinks, and growing RTD beverage consumption drive steady demand. European consumers show high preference for sustainable packaging, reinforcing long-term market stability. Additionally, premiumization trends and craft beverage growth contribute to increasing use of customized metal cans. Continuous investments in lightweight can technology further strengthen Europe’s position.
Asia-Pacific
Asia-Pacific represented 25% of the Beverage Metal Cans Market share in 2024 and remains the fastest-growing regional market. Rapid urbanization, population growth, and rising disposable incomes are driving higher consumption of packaged beverages. Expanding middle-class populations in China, India, and Southeast Asia are boosting demand for carbonated drinks, energy drinks, and canned alcoholic beverages. Global beverage brands are increasing production capacity and investing in local can manufacturing facilities. Improvements in recycling infrastructure and increasing awareness of sustainable packaging further support growth across the region.
Latin America
Latin America held 7% market share in 2024 in the Beverage Metal Cans Market. The region benefits from strong demand for canned beer and carbonated soft drinks, particularly in Brazil and Mexico. Aluminum cans are widely preferred due to their durability, affordability, and ease of transportation in warm climates. Growing urban populations and expanding retail networks support steady demand growth. While recycling infrastructure varies across countries, improving collection rates and sustainability initiatives are encouraging broader adoption of metal cans.
Middle East & Africa
The Middle East & Africa accounted for 5% of the global Beverage Metal Cans Market share in 2024. Demand is driven by rising consumption of carbonated soft drinks, energy drinks, and non-alcoholic beverages, particularly in the Gulf countries. Urbanization, tourism growth, and hot climatic conditions favor canned beverage consumption. Investments in beverage manufacturing facilities and gradual improvements in recycling systems support market expansion. Although penetration remains lower than in developed regions, increasing population and retail expansion are expected to drive long-term growth.
Market Segmentations:
By Material Type
- Aluminum Cans
- Steel Cans
By Beverage Type
- Carbonated Soft Drinks
- Alcoholic Beverages
- Energy & Functional Drinks
By End User
- Large Beverage Manufacturers
- Craft & Specialty Beverage Producers
- Private-Label Brands
By Geography
- North America
- U.S.
- Canada
- Mexico
- Europe
- Germany
- France
- U.K.
- Italy
- Spain
- Rest of Europe
- Asia Pacific
- China
- Japan
- India
- South Korea
- South-east Asia
- Rest of Asia Pacific
- Latin America
- Brazil
- Argentina
- Rest of Latin America
- Middle East & Africa
- GCC Countries
- South Africa
- Rest of the Middle East and Africa
Competitive Landscape
The competitive landscape of the Beverage Metal Cans Market is moderately consolidated, with a strong presence of global and regional manufacturers competing on capacity scale, sustainability, and innovation. Key players such as Ball Corporation, Crown Holdings, Ardagh Group, CANPACK, Amcor plc, Silgan Containers, Orora Packaging Australia, SHOWA DENKO K.K., Envases Group, and ZI Industries dominate the market through extensive manufacturing networks and long-term supply agreements with major beverage brands. These companies focus on lightweight can designs, higher recycled aluminum content, and advanced printing technologies to enhance cost efficiency and brand differentiation. Strategic investments in new production lines, capacity expansion in high-growth regions, and acquisitions are commonly adopted to strengthen market position. Sustainability initiatives, including carbon footprint reduction and circular economy alignment, play a critical role in competitive differentiation. Smaller and regional players compete by offering customization, flexible production volumes, and localized supply advantages, intensifying overall market competition.
Key Player Analysis
- SHOWA DENKO K.K.
- Amcor plc
- ZI Industries Limited
- Envases Group
- Ball Corporation
- CANPACK
- Orora Packaging Australia Pty Ltd
- Silgan Containers LLC
- Crown Holdings, Inc.
- Ardagh Group S.A.
Recent Developments
- In December 2025, Ball Corporation agreed to acquire a majority stake in European beverage can manufacturer Benepack, strengthening its production footprint in Belgium and Hungary as part of its strategic expansion in aluminum beverage can manufacturing.
- In September 2025, a Dayton-based can component manufacturer partnered with an Atlanta recycler (Novelis) to promote the use of recycled-content alloys in aluminum beverage can ends, reflecting increased collaboration on recycled materials in the industry.
- In May 2025, Ball Corporation and Açaí Motion® formed a partnership to launch a natural energy drink packaged in certified sustainable aluminum cans, highlighting cross-industry branding and sustainability certification in can packaging.
Report Coverage
The research report offers an in-depth analysis based on Material Type, Beverage Type, End-User and Geography. It details leading market players, providing an overview of their business, product offerings, investments, revenue streams, and key applications. Additionally, the report includes insights into the competitive environment, SWOT analysis, current market trends, as well as the primary drivers and constraints. Furthermore, it discusses various factors that have driven market expansion in recent years. The report also explores market dynamics, regulatory scenarios, and technological advancements that are shaping the industry. It assesses the impact of external factors and global economic changes on market growth. Lastly, it provides strategic recommendations for new entrants and established companies to navigate the complexities of the market.
Future Outlook
- The Beverage Metal Cans Market will continue to benefit from increasing global emphasis on sustainable and recyclable packaging solutions.
- Aluminum cans will remain the dominant material due to high recyclability, lightweight properties, and lower carbon footprint.
- Demand for ready-to-drink and on-the-go beverages will support steady growth in metal can consumption.
- Energy drinks and functional beverages will emerge as key demand drivers for metal can packaging.
- Beverage manufacturers will increasingly adopt lightweight can designs to improve material efficiency and reduce costs.
- Premiumization and customized can designs will gain importance for brand differentiation and consumer engagement.
- Capacity expansions in Asia-Pacific will strengthen the region’s contribution to global market growth.
- Recycling infrastructure improvements will support higher recovery rates and circular economy adoption.
- Strategic partnerships between beverage brands and can manufacturers will increase to ensure supply stability.
- Technological advancements in printing and forming processes will enhance production efficiency and design flexibility.
Request a Free Sample
Fill in your details and we'll send you a free sample report.
- Sample data tables & charts
- Research methodology
Need a Custom Version of This Report?
Tailor the scope, geography, or segments to your exact requirements.
- Custom geography or segment scope
- Direct access to our analyst team
Frequently Asked Questions
What is the current market size for Beverage Metal Cans market, and what is its projected size in 2032?
At what Compound Annual Growth Rate is the Beverage Metal Cans market projected to grow between 2024 and 2032?
Which Beverage Metal Cans market segment held the largest share in 2024?
What are the primary factors fueling the growth of the Beverage Metal Cans market?
Who are the leading companies in the Beverage Metal Cans market?
Which region commanded the largest share of the Beverage Metal Cans market in 2024?
Table of Content
Chapter 1. Report Introduction
- 1.1 Report Description & Purpose
- 1.1.1 Report Title & Market Definition
- 1.1.2 Unique Selling Propositions (USP) & Key Differentiators
- 1.1.3 Value Proposition for Stakeholders
- 1.2 Research Objectives
- 1.2.1 Market Sizing Objectives (Volume & Revenue)
- 1.2.2 Segmentation Objectives
- 1.2.3 Competitive Intelligence Objectives
- 1.2.4 Forecast & Scenario Objectives
- 1.3 Report Scope
- 1.3.1 Beverage Metal Cans Scope – Types & Subtypes Covered
- 1.3.2 Geographic Scope – Regions & Countries Covered
- 1.3.3 Historical Period, Base Year & Forecast Period (2024; forecast to 2032)
- 1.3.4 Inclusions & Exclusions
- 1.4 HS Code & Classification Framework
- 1.5 Currency, Units & Pricing Basis
- 1.6 Target Stakeholders
- 1.7 Limitations & Assumptions
Chapter 2. Executive Summary
- 2.1 Global Beverage Metal Cans Market Snapshot
- 2.1.1 Market Size – Historical (2024) & Forecast (2024-2032) (2024: USD 50,414.5 million → 2032: USD 85,334.66 million)
- 2.1.2 Volume & Revenue – Global Totals
- 2.1.3 Key Market Highlights – Top Five Facts
- 2.2 Beverage Metal Cans Market Segmentation Snapshot
- 2.2.1 Market Split by Region – 2024 vs. 2032
- 2.3 Competitive Snapshot
- 2.3.1 Top 10 Players by Revenue Share – 2024
- 2.3.2 Top 10 Players by Volume Share – 2024
- 2.3.3 Recent Strategic Developments (18-Month Summary)
- 2.4 Key Investment Highlights & Strategic Conclusions
Chapter 3. Beverage Metal Cans Market Dynamics & Industry Analysis
- 3.1 Market Overview & Context
- 3.1.1 Beverage Metal Cans Market Position in the Broader Automotive Value Chain
- 3.1.2 OEM vs. Replacement Market Dynamics
- 3.1.3 Market Maturity & Development Stage by Region
- 3.2 Beverage Metal Cans Market Drivers
- 3.3 Beverage Metal Cans Market Restraints & Challenges
- 3.4 Beverage Metal Cans Market Opportunities
- 3.5 Porter's Five Forces Analysis
- 3.5.1 Threat of New Entrants
- 3.5.2 Bargaining Power of Suppliers
- 3.5.3 Bargaining Power of Buyers
- 3.5.4 Threat of Substitutes
- 3.5.5 Competitive Rivalry – Intensity Assessment
- 3.6 Beverage Metal Cans Value Chain Analysis
- 3.6.1 Upstream – Raw Material/Input Suppliers
- 3.6.1.1 Raw Material/Input 1
- 3.6.1.2 Raw Material/Input 2
- 3.6.1.3 Raw Material/Input 3
- 3.6.2 Midstream – Production/Manufacturing/Service Delivery
- 3.6.2.1 Production/Process Overview
- 3.6.2.2 Key Facility Locations & Capacity by Manufacturer
- 3.6.3 Downstream – Distribution & End Consumer
- 3.6.3.1 Primary Channel – B2B/OEM
- 3.6.3.2 Secondary Channels – Dealer, Retail, Online, Direct
- 3.6.4 Value Chain Profitability Analysis
- 3.6.1 Upstream – Raw Material/Input Suppliers
- 3.7 PESTEL Analysis
- 3.7.1 Political Factors
- 3.7.2 Economic Factors
- 3.7.3 Social Factors
- 3.7.4 Technological Factors
- 3.7.5 Environmental Factors
- 3.7.6 Legal Factors
- 3.8 Beverage Metal Cans Supply Chain Analysis
- 3.8.1 Raw Material/Input Supply Risk Assessment
- 3.8.2 Manufacturing Concentration Risk (Geographic Exposure)
- 3.8.3 Trade Disruption Impact Analysis
- 3.9 Regulatory & Policy Landscape
Note: The regulatory and policy landscape section covers regulations based on their applicability to the market, Beverage Metal Cans category, geography, and scope of the study. Only regulatory frameworks with a material impact on operations, compliance, trade, sustainability, or market access are analyzed in detail.
Chapter 4. Key Investment Pockets & Opportunity Analysis
- 4.1 Beverage Metal Cans Market Attractiveness Analysis
- 4.1.1 By Region – Investment Attractiveness Matrix (Volume × CAGR)
- 4.2 Absolute Revenue Growth Opportunity
- 4.2.1 By Region – Absolute USD Growth Through 2032
- 4.3 Incremental Volume Opportunity
- 4.3.1 By Region – Incremental Volume Through 2032
- 4.3.2 Segment – Incremental Volume
- 4.4 Emerging Submarket Opportunity Deep Dive (Subject to Applicability)
- 4.5 Emerging Market Opportunity Scorecards
- 4.5.1 United States
- 4.5.2 Europe
- 4.5.3 Asia
- 4.5.4 Middle East & Africa
Note: Emerging Market Opportunity Scorecards will be included based on relevance and strategic importance. Regions listed are indicative and may vary depending on data availability and market dynamics.
Chapter 5. Beverage Metal Cans Import-Export Analysis & Trade Flows
- 5.1 Global Trade Overview
- 5.1.1 Global Export Value by Country (2024)
- 5.1.2 Global Export Volume by Country (2024)
- 5.1.3 Global Import Value by Country (2024)
- 5.1.4 Global Import Volume by Country (2024)
- 5.1.5 Net Trade Balance by Country (2024)
- 5.2 Export Analysis – Segment
- 5.2.1 Type 1 (HS Code)
- 5.2.2 Type 2 (HS Code)
- 5.2.3 Type 3 (HS Code)
- 5.2.4 Type 4 (HS Code)
- 5.2.5 Type 5 (HS Code)
- 5.3 Import Analysis – Segment
- 5.3.1 Type 1 (HS Code)
- 5.3.2 Type 2 (HS Code)
- 5.3.3 Type 3 (HS Code)
- 5.3.4 Type 4 (HS Code)
- 5.3.5 Type 5 (HS Code)
- 5.4 Average Unit Trade Prices
- 5.4.1 Average Export Price – Segment & Country
- 5.4.2 Average Import Price – Segment & Source Country
- 5.4.3 Price Trends (2024)
- 5.5 Key Trade Route Analysis
- 5.5.1 Trade Route 1
- 5.5.2 Trade Route 2
- 5.5.3 Trade Route 3
- 5.5.4 Trade Route 4
- 5.5.5 Trade Route 5
- 5.6 Trade Policy Impact Assessment
- 5.6.1 US Anti-Dumping & Section 301 Tariffs
- 5.6.2 EU Customs Union Impact
- 5.6.3 Major Free Trade Agreements
- 5.6.4 USMCA Rules of Origin
Note: Trade policy analysis will be included only where relevant to the Beverage Metal Cans market.
Chapter 6. Competitive Landscape & Company Benchmarking
- 6.1 Beverage Metal Cans Market Concentration & Structure
- 6.1.1 Herfindahl-Hirschman Index (HHI) – vs. 2024
- 6.1.2 Tier 1, Tier 2 & Tier 3 Market Structure
- 6.1.3 Global, Regional & Local Player Dynamics
- 6.2 Beverage Metal Cans Market Share Analysis – 2024
- 6.2.1 Global Revenue Share by Company
- 6.2.2 Global Volume Share by Company
- 6.2.3 Regional Revenue Share
- 6.2.4 Market Share Evolution ( vs. 2024)
- 6.2.5 OEM Segment Share by Company
- 6.2.6 Replacement Segment Share by Company
- 6.3 Production/Delivery Capacity & Facility Analysis
- 6.3.1 Global Installed Capacity
- 6.3.2 Capacity Utilization Rates
- 6.3.3 Production/Output Volume
- 6.3.4 Facility Locations & Capacity Map
- 6.3.5 Planned Capacity Additions
- 6.4 Beverage Metal Cans Competitive Benchmarking Matrix
- 6.4.1 Revenue, Volume, CAGR & Profitability Comparison
- 6.4.2 Channel Revenue Mix
- 6.4.3 Geographic Revenue Exposure
- 6.4.4 R&D Intensity
- 6.4.5 Sustainability Maturity
- 6.5 Strategic Developments in Beverage Metal Cans (Last 24 Months)
- 6.5.1 Mergers, Acquisitions & Divestments
- 6.5.2 New Beverage Metal Cans Launches
- 6.5.3 Facility Expansions
- 6.5.4 Strategic Alliances, Joint Ventures & Partnerships
- 6.5.5 Distribution Expansion & Market Entry
- 6.5.6 Sustainability & ESG Initiatives
- 6.6 Competitive Strategy Mapping
- 6.6.1 Leader, Challenger, Follower & Niche Classification
- 6.6.2 Pricing Strategy Comparison
- 6.6.3 Channel Strategy Matrix
Note: Strategic developments are included based on their materiality and the availability of reliable information.
Chapter 7. Global Beverage Metal Cans Market – By Distribution Channel
- 7.1 Segment Overview
- 7.1.1 Volume & Revenue Split by Channel (2024 & 2032)
- 7.1.2 Channel Mix Evolution (2024-2032)
Chapter 8. Regional Market Analysis – Global Overview
- 8.1 Global Regional Overview
- 8.1.1 Regional Volume Share
- 8.1.2 Regional Revenue Share
- 8.1.3 Regional Volume by Region
- 8.1.4 Regional Revenue by Region
- 8.1.5 Regional Forecast Through 2032
- 8.2 Cross-Regional Segment Analysis
- 8.2.1 By Distribution Channel
- 8.2.2 By Brand/Price Tier
Chapter 9. North America Beverage Metal Cans Market
- 9.1 United States
- 9.2 Canada
- 9.3 Mexico
Chapter 10. Europe Beverage Metal Cans Market
- 10.1 Germany
- 10.2 France
- 10.3 Italy
- 10.4 United Kingdom
- 10.5 Spain
- 10.6 Poland
- 10.7 Russia
- 10.8 Netherlands
- 10.9 Belgium
- 10.10 Sweden
- 10.11 Denmark
- 10.12 Norway
- 10.13 Rest of Europe
Chapter 11. Asia Pacific Beverage Metal Cans Market
- 11.1 China
- 11.2 India
- 11.3 Japan
- 11.4 South Korea
- 11.5 Thailand
- 11.6 Indonesia
- 11.7 Vietnam
- 11.8 Malaysia
- 11.9 Australia
- 11.10 Rest of Asia Pacific
Chapter 12. Latin America Beverage Metal Cans Market
- 12.1 Brazil
- 12.2 Argentina
- 12.3 Colombia
- 12.4 Chile
- 12.5 Rest of Latin America
Chapter 13. Middle East Beverage Metal Cans Market
- 13.1 Saudi Arabia
- 13.2 United Arab Emirates
- 13.3 Turkey
- 13.4 Israel
- 13.5 Iran
- 13.6 Rest of the Middle East
Chapter 14. Africa Beverage Metal Cans Market
- 14.1 South Africa
- 14.2 Egypt
- 14.3 Nigeria
- 14.4 Morocco
- 14.5 Rest of Africa
Chapter 15. Beverage Metal Cans Company Profiles
- 15.1 [Company 01]
- 15.1.1 Company Overview
- 15.1.2 Key Management Personnel
- 15.1.3 Products & Services Portfolio
- 15.1.4 Financial Performance
- 15.1.5 Key Market Focus & Geographic Presence
- 15.1.6 Recent Developments & Strategic Initiatives
Note: The company profile list is preliminary and may change based on research findings, market developments, data availability, and client requirements.
Chapter 16. Appendices
- Appendix A – List of Abbreviations & Acronyms
- Appendix B – Industry Classification Code Reference – Full Series
- Appendix C – Production & Capacity Data Tables
- Appendix D – End-Use & Demand Base Tables
- Appendix E – Consumption & Replacement Rate Assumptions
- Appendix F – ASP Reference Tables
- Appendix G – Manufacturing & Facility Database
- Appendix H – Import-Export Data Tables
- Appendix I – Regulatory Summary Tables
- Appendix J – Primary Research Participant List (Anonymized)
- Appendix K – Primary Research Questionnaire Framework
- Appendix L – Data Sources & Bibliography
- Appendix M – Market Size Divergence & Source Comparison
Chapter 17. Research Methodology
- 17.1 Research Framework & Philosophy
- 17.2 Secondary Research – Sources, Hierarchy & Data Extraction
- 17.3 Data Modeling – Bottom-Up & Top-Down Market Sizing
- 17.4 Primary Research – Stakeholder Framework, LOI & Sample Sizes
- 17.5 Forecast Methodology – Regression, Scenario & Sensitivity Analysis
- 17.6 Quality Control – Four-Layer Validation Framework
- 17.7 Limitations & Standard Assumptions
- 17.8 Disclaimer
