
Operators move field data from dashboards to AI agents
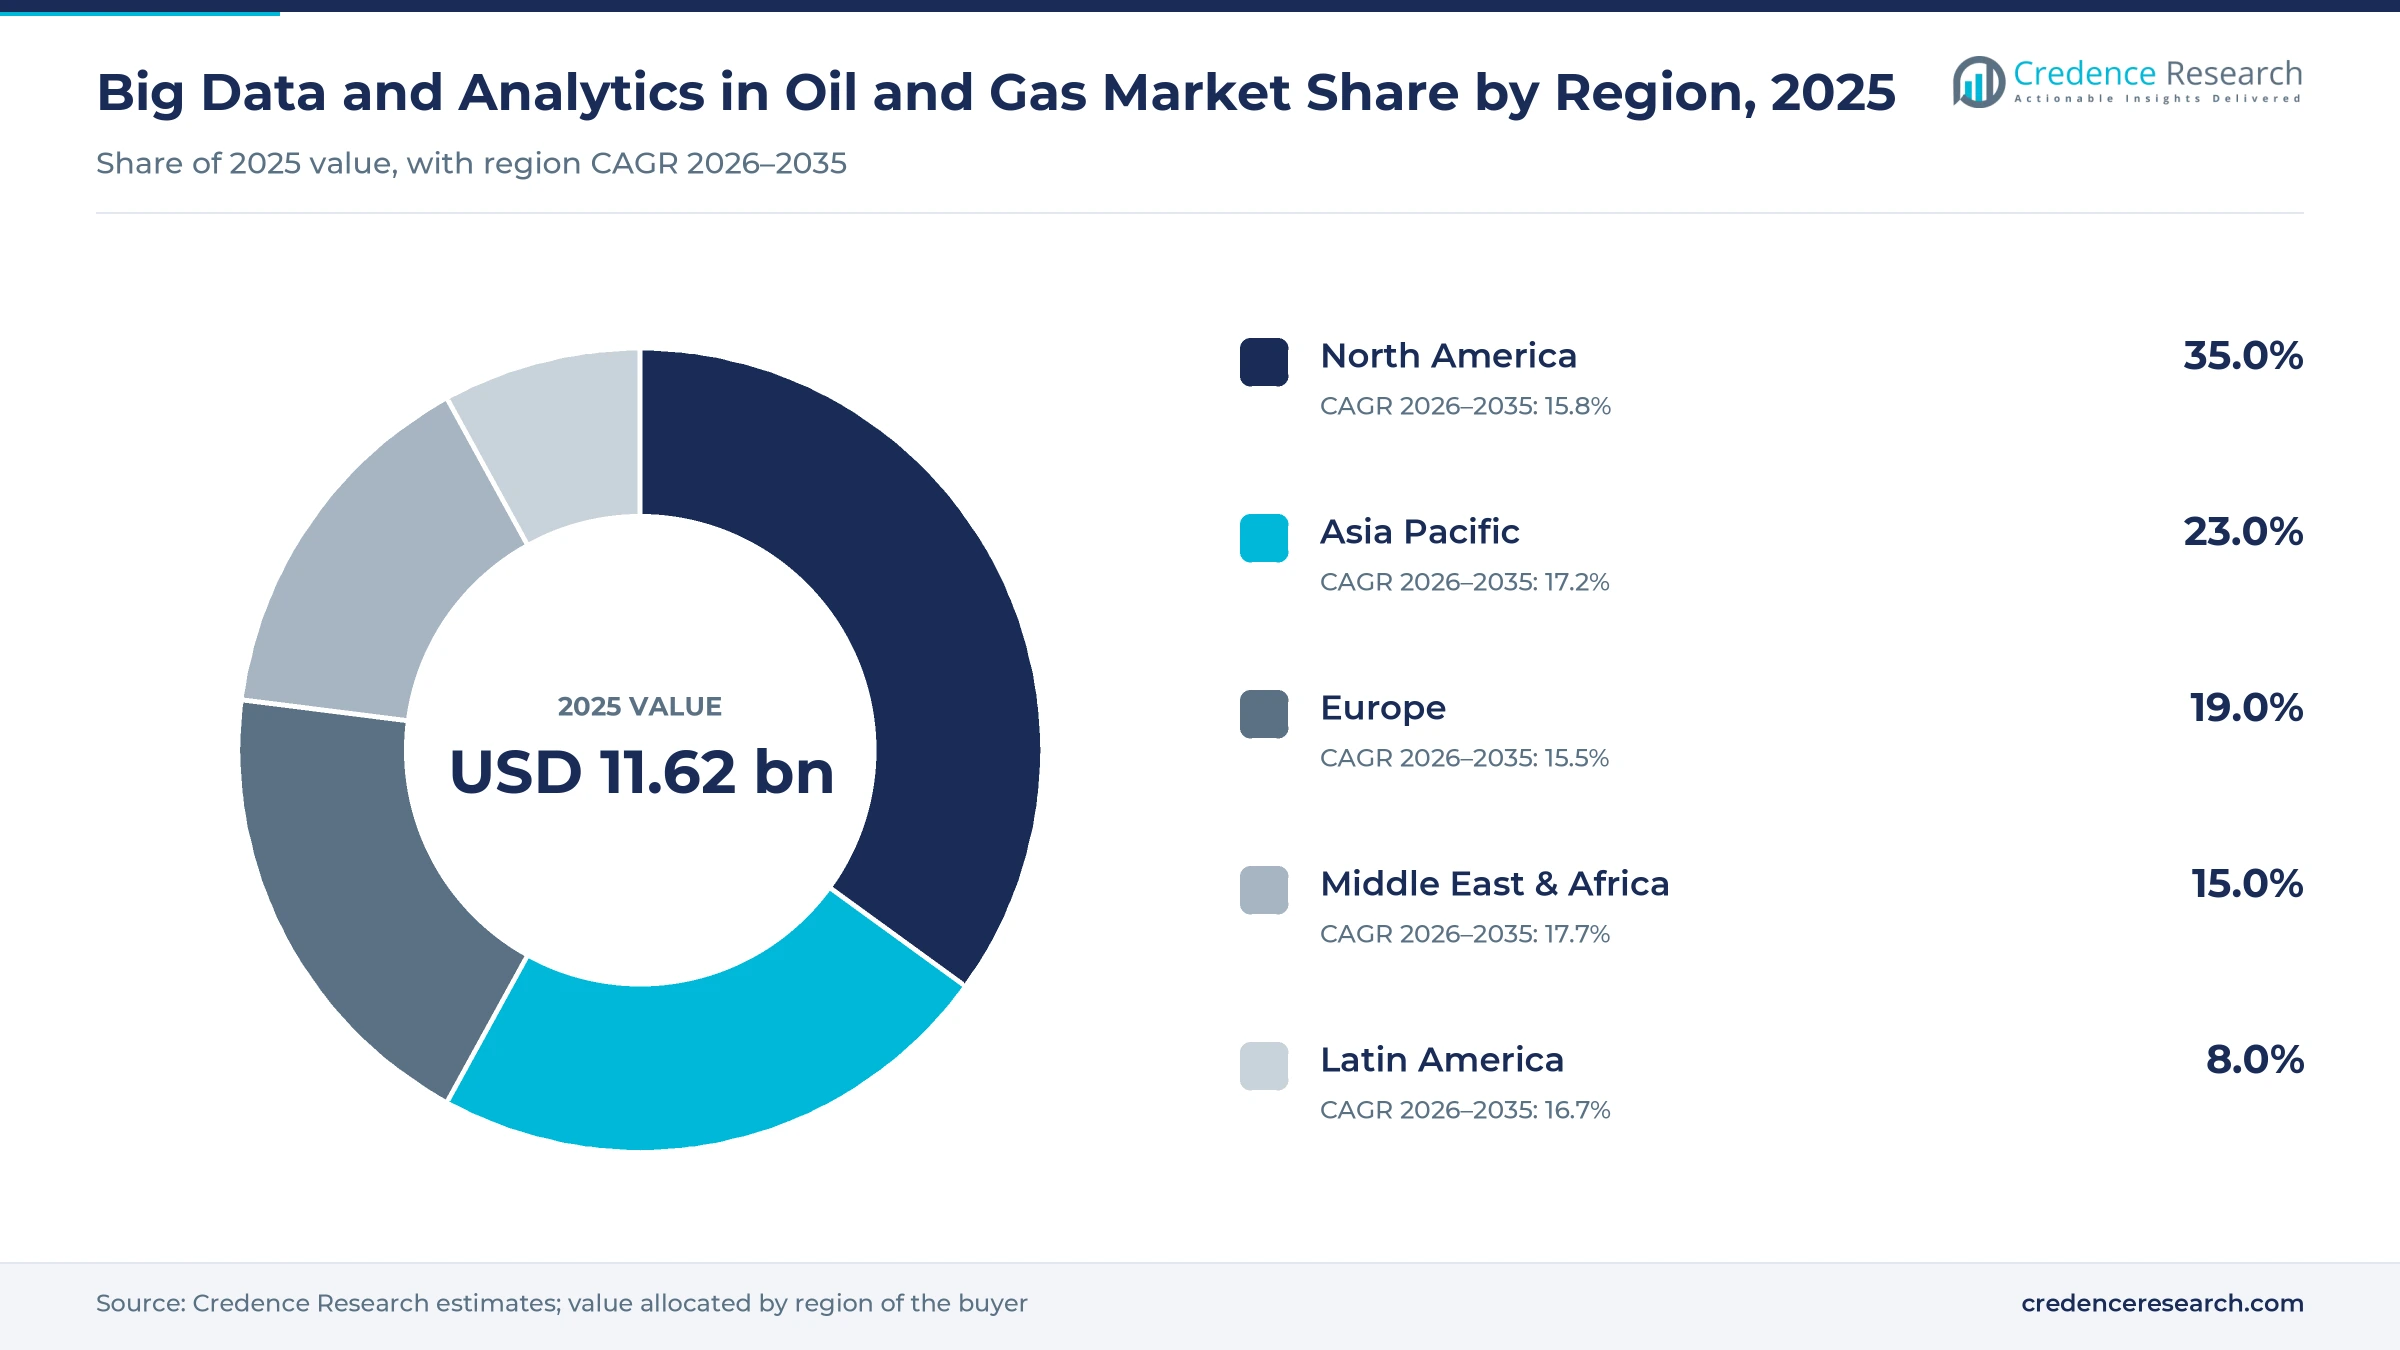
The global big data and analytics in oil and gas market was valued at USD 11.62 billion in 2025 and is projected to increase from USD 13.53 billion in 2026 to USD 53.06 billion by 2035, registering a CAGR of 16.40% during 2026–2035. Demand comes from operators that need to raise output and uptime from existing fields while holding capital budgets flat, which moves seismic, well, reservoir and equipment data into shared platforms and AI models. North America held the largest regional share, 35.0% in 2025, supported by shale operators, the major service companies and new LNG export capacity on the Gulf Coast. Middle East & Africa is the fastest-growing region at 17.6% a year, as national oil companies sign multi-year contracts for AI agents across their upstream assets. The main commercial change is the shift from project-based analytics toward enterprise data platforms bought by service companies, cloud providers and industrial software groups.
Which oil and gas analytics workloads does the estimate count?
The market counts software, data platforms and analytics services that oil and gas companies use to process and interpret field and plant data. This covers seismic processing and interpretation, well and drilling analytics, reservoir and production optimization, predictive maintenance and asset performance management, supply chain planning and security monitoring of operational technology networks. Operators buy it as subscriptions, enterprise licenses, consumption-based cloud services or multi-year service contracts.
The estimate excludes general IT infrastructure, networking equipment, generic ERP licenses and sensors, although these systems produce and carry the data that analytics tools use. Spending on high-performance computers is counted only where operators buy them for seismic and reservoir workloads as part of an analytics program.

Big Data and Analytics in Oil and Gas Market Insights
- The market is valued at USD 11.62 billion in 2025 and is projected to reach USD 53.06 billion by 2035, growing at a 16.40% CAGR as operators scale AI agents across producing fields.
- North America led with 35.0% of 2025 value, because shale operators, the large service companies and Gulf Coast LNG terminals concentrate analytics buying there.
- Upstream accounted for 61.0% of 2025 value, while Predictive Maintenance & Asset Performance Management grows fastest at 17.7% a year.
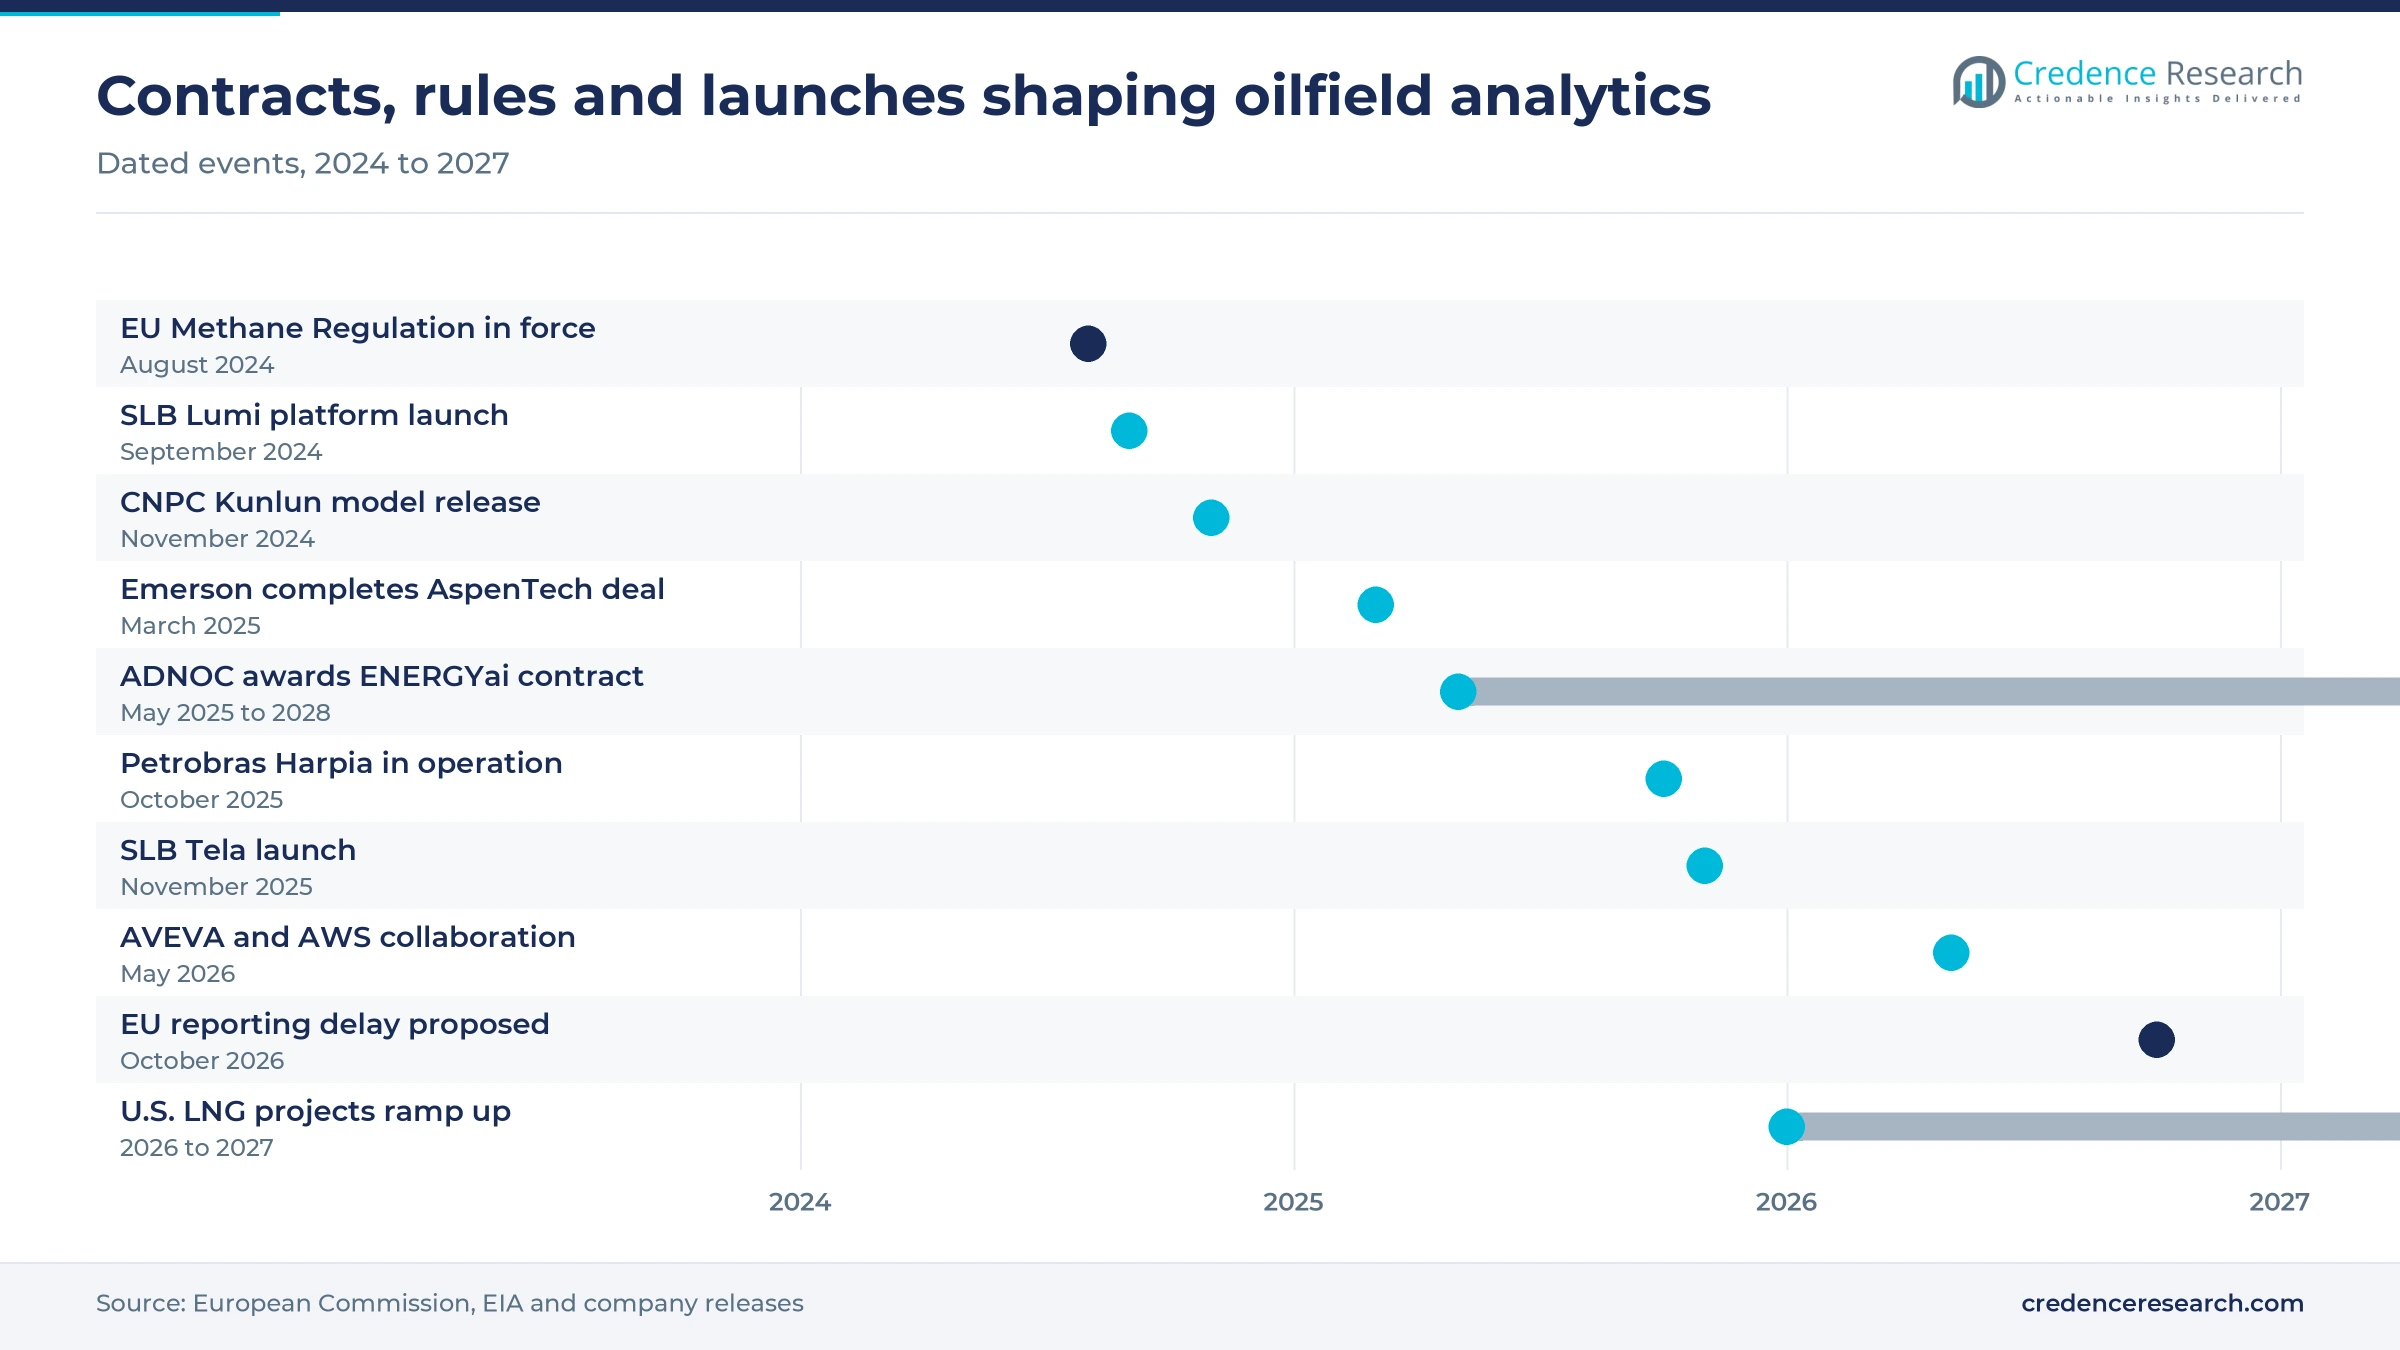
- ADNOC awarded AIQ a USD 340 million, three-year contract in May 2025 to deploy ENERGYai agents across more than 28 producing fields.
- The EIA expects five U.S. LNG export projects to start and ramp up by the end of 2027, widening demand for midstream analytics.
Reservoir work leads as maintenance analytics grows fastest
Why does reservoir work lead while maintenance analytics grows fastest?
Based on application, the market is categorized into production optimization & reservoir management, predictive maintenance & asset performance management, seismic data analysis, well data analytics, supply chain & operations optimization and cybersecurity monitoring. Production Optimization & Reservoir Management led with 27.0% of 2025 value because each reservoir model decision changes recovery across a whole field. Halliburton and PETRONAS Carigali announced a planned DecisionSpace 365 deployment for live earth models on June 19, 2025. Predictive Maintenance & Asset Performance Management grows fastest at 17.7% a year as operators extend reliability analytics from plants to fleets, and Shell, Eni, QatarEnergy LNG and ExxonMobil use C3 AI and Baker Hughes joint venture applications, renewed through June 2028.
Why does data processing lead while cognitive analytics grows faster?
Based on analytics type, the market is categorized into big data processing & descriptive analytics and cognitive analytics (AI & ML). Big Data Processing & Descriptive Analytics led with 58.0% of 2025 value because seismic imaging, historian data and production reporting still absorb most compute and staff time. Petrobras said in October 2025 that its new Harpia system will turn raw seismic data into 3D subsurface images for pre-salt and Equatorial Margin work. Cognitive Analytics (AI & ML) grows fastest at 17.8% a year as agents move into engineering tasks, and Aker BP reported in September 2025 that Cognite root cause analysis agents cut engineer time on that work by more than 70%.
Why does upstream lead while midstream grows fastest?
Based on sector, the market is categorized into upstream, midstream and downstream. Upstream led with 61.0% of 2025 value because exploration and production create the largest data volumes, from seismic surveys to well logs. CNPC released its Kunlun model in November 2024 with 70 billion parameters and three specialized models for seismic processing, seismic interpretation and well logging. Midstream grows fastest at 17.7% a year as new LNG trains need terminal, pipeline and leak analytics, with the EIA listing Golden Pass and Corpus Christi Stage 3 trains starting up in 2026.
| Segment Group | Leading Sub-segment | Share, 2025 | Fastest-growing Sub-segment | CAGR, 2026–2035 |
|---|---|---|---|---|
| By Application | Production Optimization & Reservoir Management | 27.0% | Predictive Maintenance & Asset Performance Management | 17.7% |
| By Analytics Type | Big Data Processing & Descriptive Analytics | 58.0% | Cognitive Analytics (AI & ML) | 17.8% |
| By Sector | Upstream | 61.0% | Midstream | 17.7% |
Consumption fees and seismic compute set analytics prices
Pricing in this market follows three models that buyers compare on total cost per field or asset. AI platform vendors increasingly charge by consumption, so bills rise with the number of models, wells and data streams in production. Service companies bundle software subscriptions with workflow consulting, and most publish no list prices, which leaves operators to benchmark through tenders. National oil companies and majors also buy their own seismic computers, a cost that only large operators can carry. Evidence on seat prices for subsurface software is thin, so the estimate below is a range rather than a quoted figure.
| Offer or cost item | Typical price or fee | Basis |
|---|---|---|
| C3 AI Platform after the pilot period | USD 0.55 per vCPU hour | C3 AI pricing announced August 2022, reported by Cloud Wars |
| Eni HPC6 supercomputer for exploration and reservoir work | More than EUR 100 million | insideHPC, January 2025 |
| Petrobras Harpia seismic supercomputer | R$435 million | Petrobras, October 2025 |
| Enterprise analytics platform subscription, mid-size operator | USD 1-5 million a year | Credence Research estimate from disclosed contract scopes and consumption pricing |
Request a Free Sample
Fill in your details and we'll send you a free sample report.
- Sample data tables & charts
- Research methodology
Capital discipline and NOC AI budgets drive demand
Flat capital budgets push operators to optimize existing fields
Operators are spending on analytics because flat capital budgets force them to raise output from fields they already own. The IEA expects upstream oil and gas investment of just under USD 570 billion in 2025, a decline of around 4%, with upstream oil alone down about 6%. Oil, gas and coal supply together attract USD 1.1 trillion in 2025, according to the same IEA report, so analytics competes for a share of a large but static pool. Production optimization and reservoir management, which hold 27.0% of 2025 value, benefit most because they add barrels without new wells. Operators with mature fields in the North Sea, the Gulf of Mexico and the Gulf states gain the clearest returns, while explorers with few producing assets see less benefit.
National oil companies fund AI programs at field scale
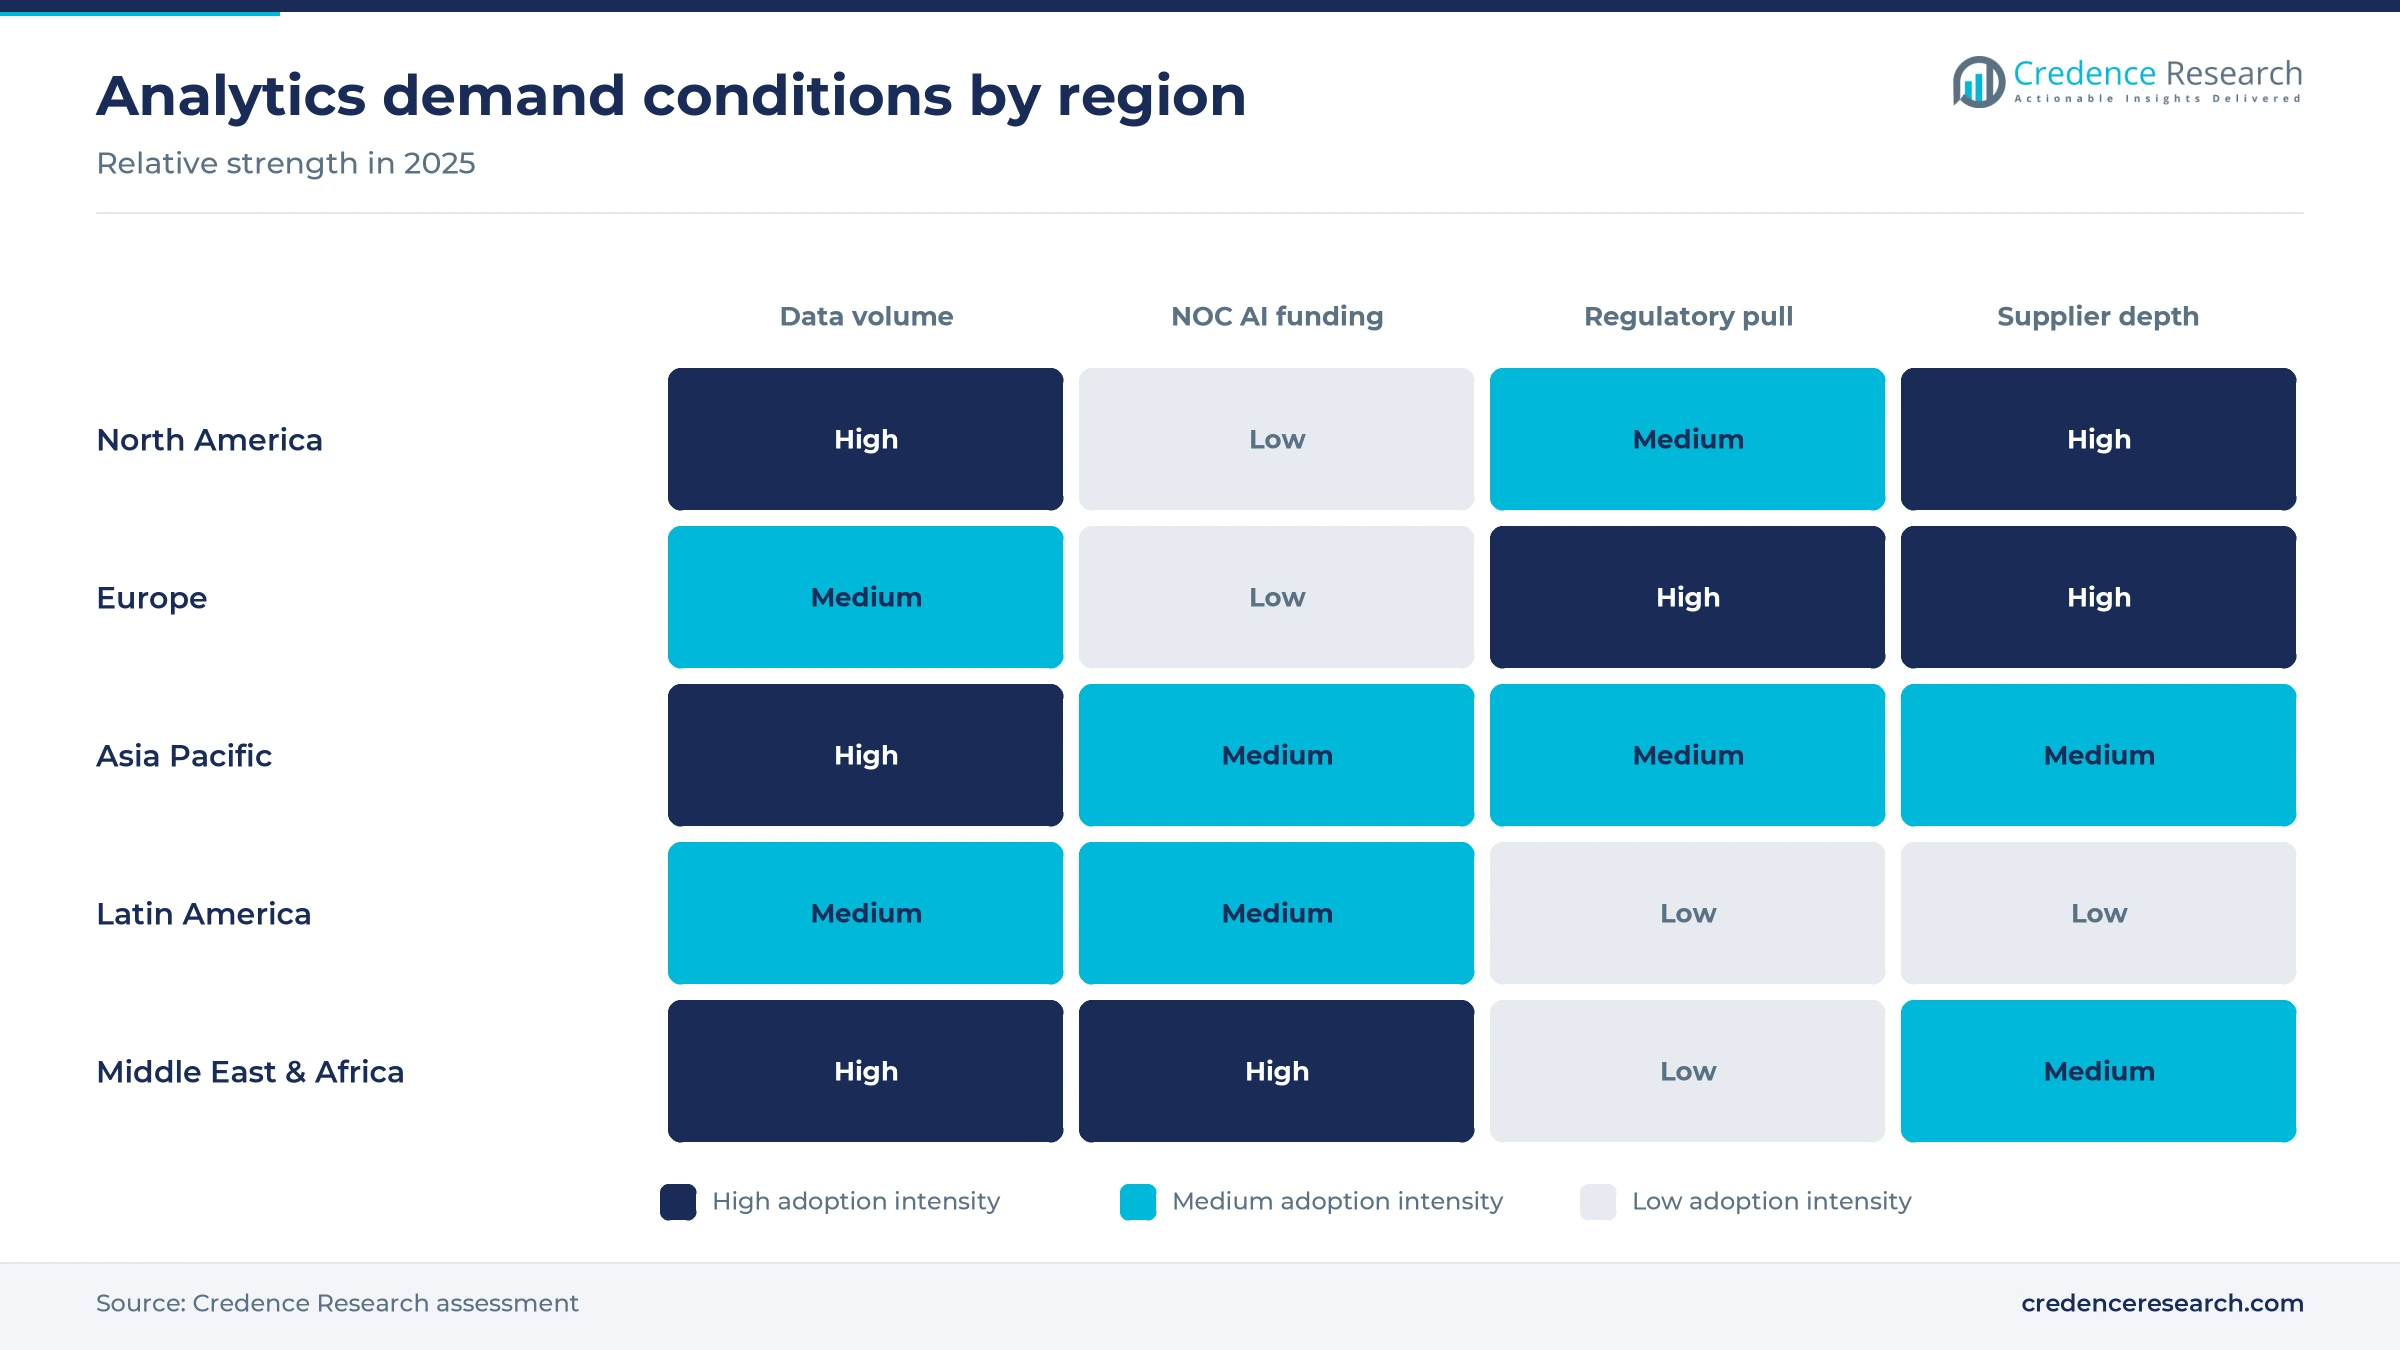
National oil companies now buy AI as multi-year programs rather than pilots, which lifts contract sizes for suppliers. AIQ announced a USD 340 million contract from ADNOC in May 2025 to deploy ENERGYai across all upstream assets, more than 28 producing fields, over three years. ENERGYai runs on Microsoft Azure with the OSDU data framework and OpenAI models, and the first version was planned with five subsurface agents. Aramco launched its Metabrain model in March 2024 with 250 billion parameters, trained on 7 trillion data points from about 90 years of operations. These programs favor cloud providers and specialist AI firms that can work with national data rules, and they explain why Middle East & Africa grows fastest.
Seismic compute expansions multiply the data to analyze
Larger seismic computers raise the volume and resolution of subsurface data, which then feeds interpretation and reservoir analytics. Eni brought its HPC6 system into service with nearly 14,000 graphics processors, ranking it fifth on the TOP500 list, according to insideHPC in January 2025. Petrobras bought five Lenovo systems that raise its computing capacity by more than 60%, the company said in October 2025. Europe, which holds 19.0% of 2025 value, hosts the Eni system, while Latin America hosts the Petrobras fleet. Each new seismic survey and imaging run produces volumes that interpreters must screen, which is why seismic data analysis still holds a large application share. Operators with deepwater and pre-salt portfolios gain most, while onshore producers lean on cloud processing instead of owned machines and avoid large fixed costs.
Methane rules turn emissions data into a compliance record
Methane regulation makes measured emissions data a legal record, which forces operators to collect, analyze and report it at asset level. The EU Methane Regulation entered into force on Aug. 4, 2024, bans routine venting and flaring, and requires most detected leaks to be repaired within 5 or 15 working days. Its measurement and reporting rules build on the OGMP 2.0 framework. The IEA estimated 2025 methane emissions at 45 million metric tons from oil and 36 million metric tons from natural gas operations, so the data load is global. Operators selling gas into Europe need monitoring platforms that link sensor, satellite and repair records, which benefits emissions analytics vendors.
Open data layers and AI agents reshape oilfield software
Operators shift toward open data layers shared across vendors
Operators are shifting from tool-specific databases toward shared data layers that several analytics vendors can read, which lowers switching costs. Cognite and Snowflake announced on Jan. 27, 2026, a collaboration to combine operational, IT and industrial data for upstream operators, aimed at predictive maintenance and production optimization. AVEVA and AWS signed a multi-year strategic collaboration on May 19, 2026, to build AVEVA CONNECT on AWS services including Amazon Bedrock. AWS also offers its own implementation of the OSDU Data Platform for subsurface data, and Big Data Processing & Descriptive Analytics still holds 58.0% of 2025 value on these shared records. This shift favors cloud providers and data platform vendors, while suppliers that rely on proprietary file formats risk losing their hold on interpretation and reservoir workflows.
Service companies are embedding agentic AI in their software
Large oilfield service companies are building agents into their software so operators buy AI through tools they already use. SLB launched its Lumi data and AI platform in September 2024 and unveiled the Tela agentic assistant on Nov. 3, 2025, for log interpretation and drilling work. TotalEnergies extended its Cognite partnership in September 2025 for three years across its operated upstream assets. Aker BP's root cause agents, cited in the segment section, show the same move inside an operator's own engineering workflows. Independent evidence on productivity gains remains limited, so agent pricing is likely to change. National oil companies in Middle East & Africa, which holds 15.0% of 2025 value, are early buyers of such agents. Cognitive Analytics (AI & ML), growing at 17.8% a year, gains most from this shift.
New LNG capacity opens a midstream analytics opening
LNG expansion creates a clear opening for analytics vendors serving terminals, pipelines and shipping schedules. The EIA reported in April 2026 that U.S. peak LNG export capacity had reached 18.3 Bcf/d and forecast exports of 17.0 Bcf/d for the year. Port Arthur LNG Phase 1 and Rio Grande LNG trains 1 and 2 are expected to begin exports in 2027, according to the same EIA analysis. Europe took 10.3 Bcf/d of U.S. LNG in 2025, about 68% of volumes. Terminal operators need liquefaction efficiency, feed gas and cargo scheduling analytics, so vendors with process optimization tools stand to win new midstream contracts.
Satellite methane alerts create a fast-response analytics opening
Unused satellite methane alerts point to an opening for vendors that turn detections into repair orders. The IEA said in its Global Methane Tracker 2026 that nearly 30 million metric tons of upstream oil and gas methane could be abated at no net cost at 2025 prices. It added that responding on schedule to alerts from the UN methane alert system in 2025 could have cut about 6 million metric tons. The European Commission published an importer guidance tool in March 2026 and last updated it on Sept. 22, 2026. Exporters selling gas into Europe and operators in basins with many super-emitter events are the buyers most likely to pay for automated detection-to-repair software.
Cyber exposure and rule changes slow analytics rollouts
Cyberattacks on energy firms raise the cost of connected fields
Connecting field systems to cloud analytics widens the attack surface that operators must defend. IBM X-Force reported in February 2026 that energy accounted for 8% of incidents it observed in 2025, the fourth most targeted industry, with exploitation of public-facing applications behind 50% of initial access. TSA rules for U.S. pipelines require 100% of cybersecurity measures to be tested every three years. Pipeline and terminal operators with older control networks are most exposed, and security reviews can delay cloud analytics projects by months. Processing data through edge computing at the site shortens these reviews.
Shifting methane rules make compliance software harder to plan
Changing methane rules make it difficult for operators to plan compliance analytics budgets. President Trump signed a resolution on March 14, 2025, voiding the EPA rule that set the Waste Emissions Charge for large oil and gas emitters. In Europe, the Commission proposed on Oct. 14, 2026, to postpone the methane regulation reporting provisions by one year. Emissions software vendors selling mainly on compliance are most exposed, since buyers may delay contracts until rules settle. Vendors that also show measured gas savings keep stronger demand from buyers.
Vendor consolidation raises roadmap and pricing risk
Buyers sign multi-year platform contracts, so changes in vendor ownership can strand integrations and training. Emerson completed its acquisition of all remaining AspenTech shares on March 12, 2025, bringing process optimization software under an automation group. The C3 AI joint venture with Baker Hughes has been renewed and amended four times since 2019, which shows how much of the AI offer depends on alliances. Operators that rely on one vendor face product rationalization and price changes, so contracts with data export rights reduce this risk.
Seismic computing costs favor the largest operators
Owning seismic computers is affordable mainly for majors and national oil companies, which widens the analytics gap with smaller producers. Eni spent more than EUR 100 million on HPC6, and the five Lenovo systems Petrobras bought cost R$500 million together, according to company and trade reports. Independent producers with small portfolios are most exposed, since they cannot spread these fixed costs over many basins. Cloud processing and shared imaging services reduce the gap, although data transfer costs for large seismic volumes remain high.
North America leads while the Gulf grows fastest
Regional demand follows where operators hold producing assets, where national oil companies fund AI programs and where LNG and refining capacity is growing. Shares and growth rates below are Credence Research estimates built from public production, investment and contract data.
| Region | Value, 2025 (USD billion) | Share, 2025 | CAGR, 2026–2035 |
|---|---|---|---|
| North America | 4.07 | 35.0% | 15.8% |
| Asia Pacific | 2.67 | 23.0% | 17.1% |
| Europe | 2.21 | 19.0% | 15.4% |
| Middle East & Africa | 1.74 | 15.0% | 17.6% |
| Latin America | 0.93 | 8.0% | 16.6% |
North America leads on shale data and LNG expansion
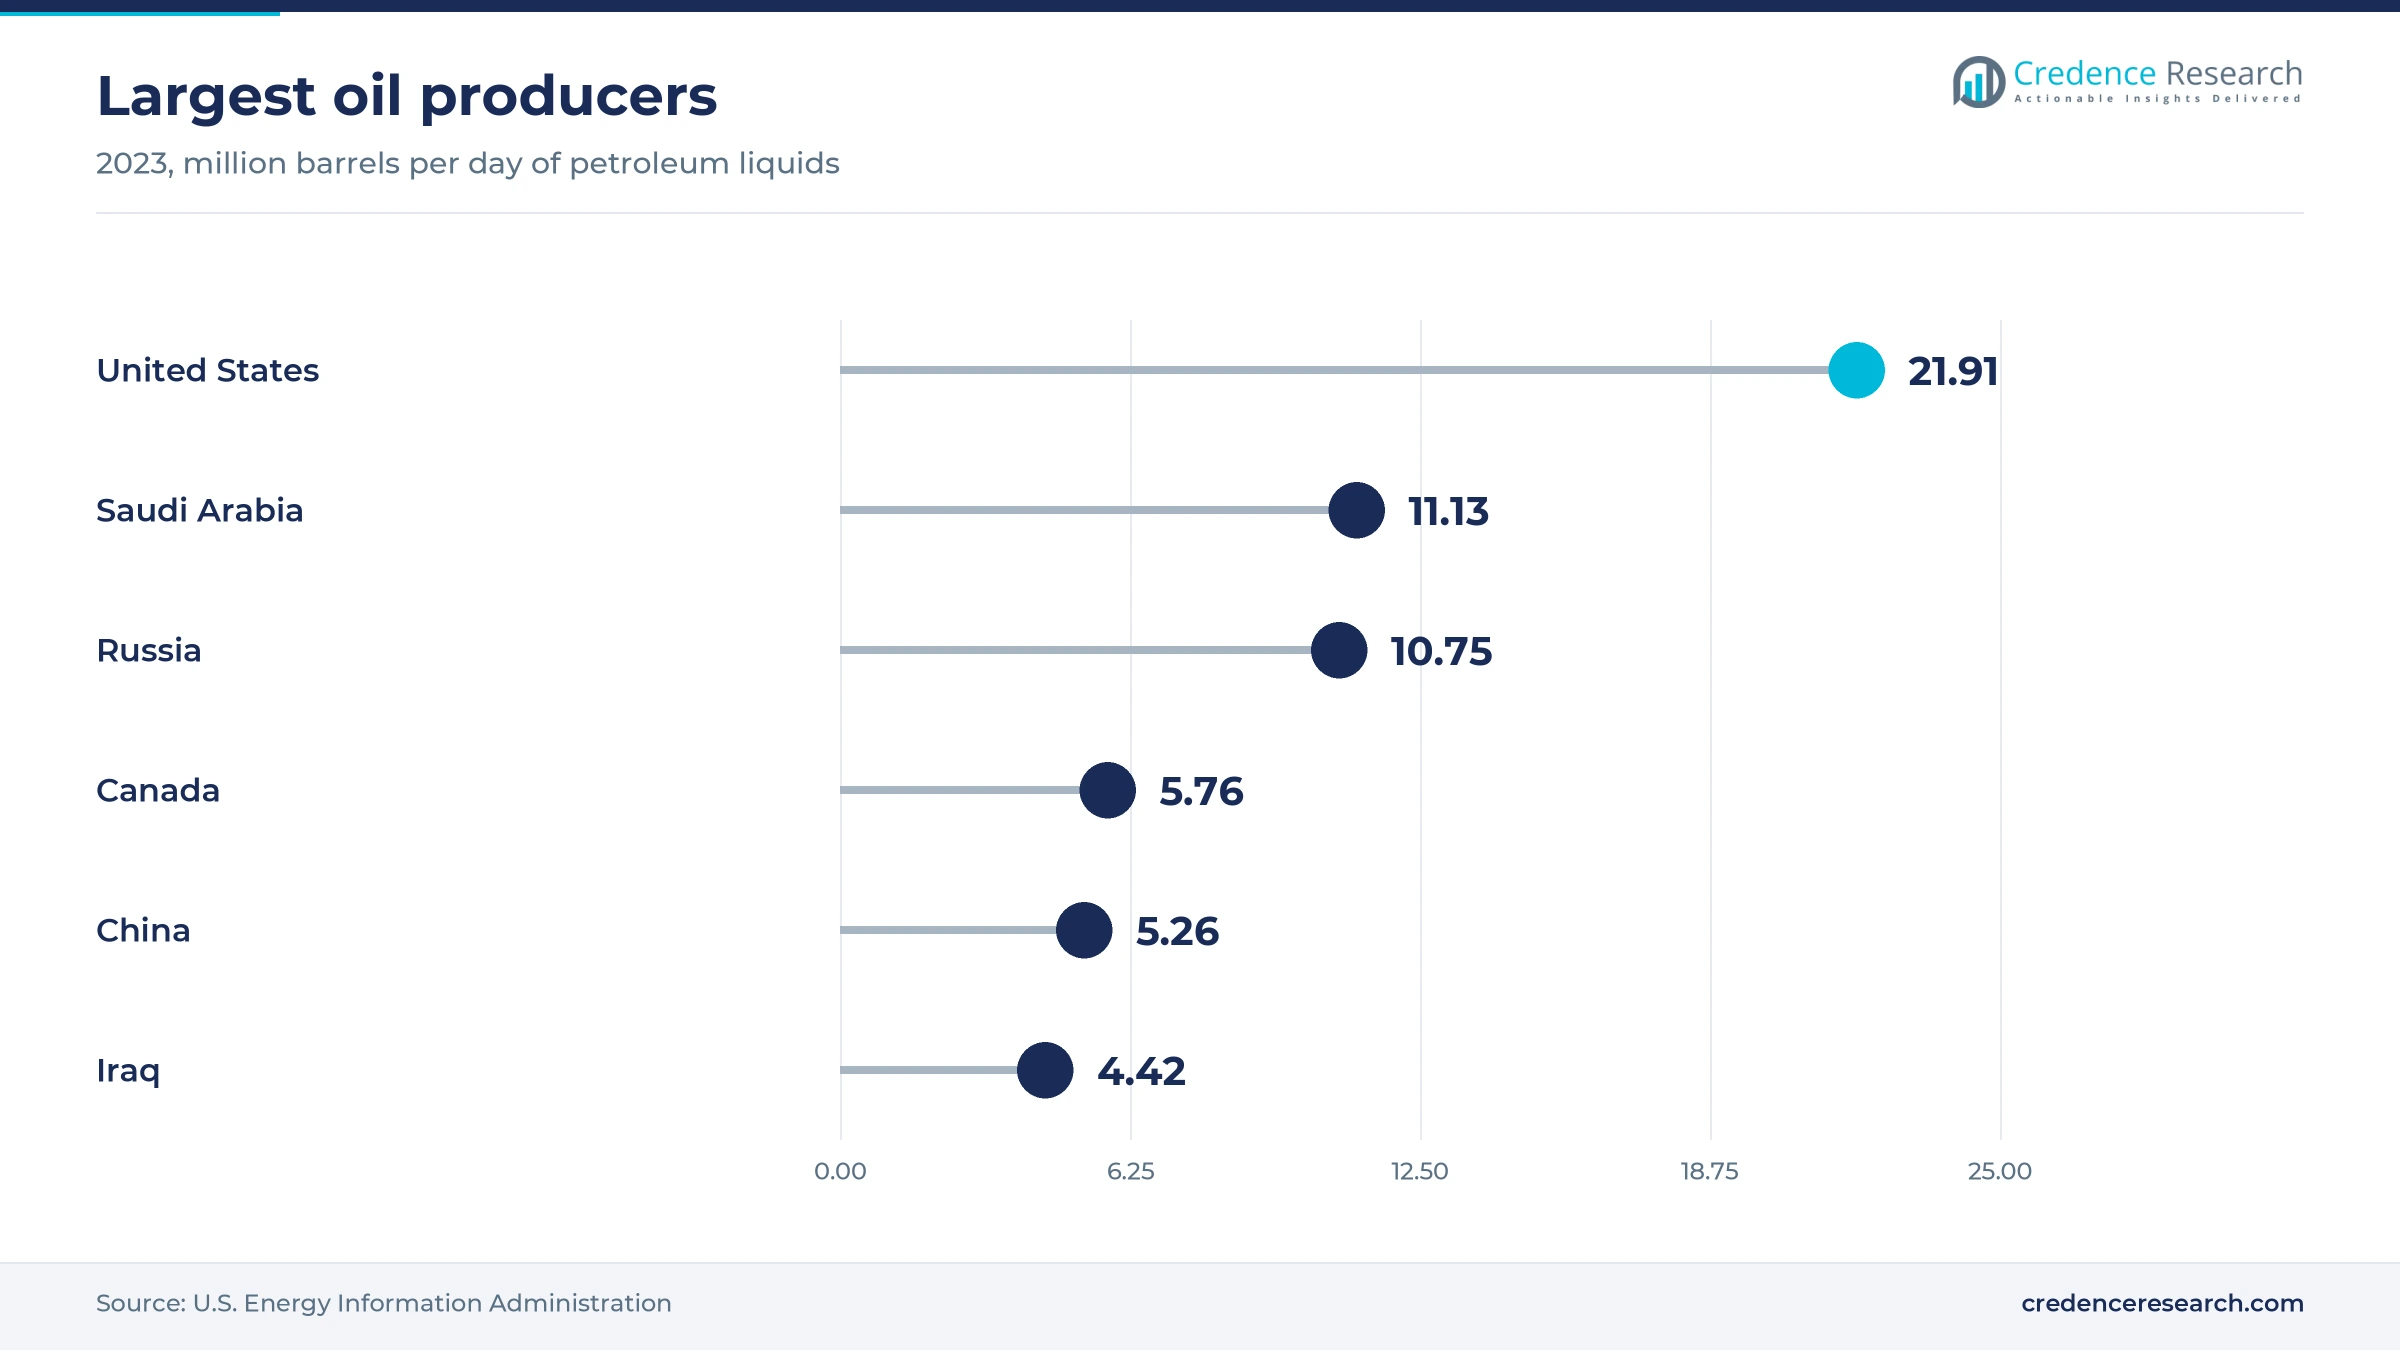
North America held 35.0% of 2025 value and grows at 15.8% a year. U.S. crude oil output averaged a record 13.6 million barrels per day in 2025, with the Permian Basin supplying about 48%, according to the EIA, and shale wells generate dense drilling and production data. SLB, Halliburton, Baker Hughes, Microsoft, AWS and C3 AI are based in the region, giving operators a deep supplier pool. The Gulf Coast LNG build-out noted above adds midstream demand, while pipeline security rules raise spending on network monitoring.
Europe grows on methane rules and offshore digital programs
Europe held 19.0% of 2025 value and grows at 15.4% a year. The EU methane rules described above make emissions data a legal record for operators and importers, which sustains monitoring and reporting software demand. Eni, TotalEnergies and Aker BP are among the most active buyers of compute and AI agents in the region, as the HPC6 system and the Cognite programs noted above show. Mature North Sea fields push operators toward production and predictive maintenance analytics, although falling output limits long-term spending growth.
Asia Pacific grows on national models and reservoir programs
Asia Pacific held 23.0% of 2025 value and grows at 17.1% a year. CNPC built its Kunlun model with China Mobile, Huawei and iFLYTEK, which points to a domestic supply chain for oilfield AI in China. In Malaysia, PETRONAS Carigali plans to deploy Halliburton geoscience software for probabilistic reservoir modeling, as noted in the segment section. Domestic Chinese vendors are likely to win most local work, while foreign suppliers compete mainly with Malaysian, Indonesian, Indian and Australian operators.
Latin America grows on pre-salt and frontier exploration
Latin America held 8.0% of 2025 value and grows at 16.6% a year. Petrobras put Harpia into operation in October 2025 with about 146 petaflops of peak performance, replacing its Fênix, Atlas and Dragão systems. The company has led Latin America in the TOP500 ranking for five years, which shows how much seismic imaging work stays in-house in Brazil. Guyana, Argentina and Mexico add demand for reservoir and drilling analytics, although public data on their software spending are limited.
Middle East & Africa grows fastest on NOC AI contracts
Middle East & Africa held 15.0% of 2025 value and grows fastest at 17.6% a year. The ADNOC and Aramco programs described in the drivers make Gulf national oil companies some of the largest disclosed buyers of upstream AI. ADNOC selected Microsoft and G42 technology for ENERGYai, so global cloud providers win work through local partners. QatarEnergy LNG is a named user of the C3 AI and Baker Hughes applications, which extends demand into LNG operations. Public data for African producers are thin, and estimates there rest on Credence Research assumptions.
Service firms and NOCs turn AI pilots into contracts
| Development | Status and market relevance |
|---|---|
| In March 2025, Emerson completed its acquisition of all remaining outstanding shares of AspenTech. | Completed acquisition; AspenTech process optimization and subsurface software are now fully owned by Emerson. |
| In May 2025, AIQ announced a three-year contract from ADNOC to deploy ENERGYai across its upstream assets. | Contract awarded after a trial phase; rollout is planned to scale from several assets to all producing fields. |
| In October 2025, Petrobras put its Harpia supercomputer into operation for seismic processing. | Operational launch; the largest of five new systems that raise Petrobras computing capacity by more than 60%. |
| In November 2025, SLB unveiled its Tela agentic AI assistant, powered by the Lumi data and AI platform. | Product launch; available across SLB platforms in cloud and on-premises deployments, with no pricing disclosed. |
| In January 2026, Cognite and Snowflake announced a collaboration to scale industrial AI for upstream oil and gas. | Collaboration announced; no rollout schedule or customer count has been disclosed. |
Seismic compute and agentic AI change field analytics
- Seismic high-performance computing converts raw survey data into high-resolution 3D images, which increases the volume that interpreters and AI models must screen.
- Open subsurface data platforms store seismic, well and production data in shared formats, so several vendors can run analytics on one record.
- Agentic AI assistants plan and carry out tasks such as log interpretation and root cause analysis, with engineers reviewing the results.
- Emissions monitoring analytics combine sensor, aerial and satellite detections with repair records, which supports methane reporting and leak response.
Need a Custom Version of This Report?
Tailor the scope, geography, or segments to your exact requirements.
- Custom geography or segment scope
- Direct access to our analyst team
Control of subsurface data sets competitive position
Competition turns on who controls the subsurface and operations data that analytics tools use. SLB, Halliburton and Baker Hughes sell interpretation, drilling and production software alongside field services, and SLB now adds agents through Tela and Lumi. Emerson owns AspenTech and Schneider Electric owns AVEVA, giving both groups a strong position in plant and terminal optimization. Microsoft and AWS compete as data platform providers, often inside national oil company programs. Cognite and C3 AI sell industrial data and AI applications, while IBM, SAP and Accenture serve maintenance, supply chain and integration work. Buyers increasingly favor vendors whose platforms read data from other suppliers, which supports asset performance management tools that are not tied to one equipment maker.
How is the supply side organized and where do margins sit?
The supply side splits into four groups with different economics. Oilfield service companies such as SLB, Halliburton and Baker Hughes sell subsurface and drilling software alongside field services, so their analytics sales ride on existing operator relationships. Industrial software groups such as AspenTech and AVEVA control process historians and optimization tools in plants and terminals. Cloud providers supply the data layer and AI models, while specialists such as Cognite and C3 AI sell platforms and applications on top. Margins are highest in recurring software subscriptions and lowest in integration work, and switching costs rise once a field data model is built.
Companies profiled and their roles in this market
| Company | Type | Role in the market |
|---|---|---|
| SLB | Oilfield service and software supplier | Delfi and Lumi platforms with Tela agents for subsurface, drilling and production |
| Halliburton Company (Landmark) | Oilfield service and software supplier | DecisionSpace 365 geoscience, drilling and reservoir software |
| Baker Hughes Company | Oilfield service and technology supplier | Cordant asset performance software and C3 AI joint venture applications |
| Emerson Electric Co. (AspenTech) | Industrial software supplier | AspenTech subsurface, process optimization and asset analytics software |
| Schneider Electric SE (AVEVA) | Industrial software supplier | AVEVA PI System historian and CONNECT industrial data platform |
| Microsoft Corporation | Cloud and data platform provider | Azure cloud and OSDU data services used in ADNOC ENERGYai |
| Amazon Web Services (Amazon) | Cloud and data platform provider | OSDU Data Platform implementation and cloud services for energy data |
| Cognite AS | Industrial data and AI specialist | Cognite Data Fusion and Atlas AI agents for upstream operators |
| C3.ai, Inc. | Enterprise AI specialist | Reliability, maintenance and optimization AI applications for oil and gas |
| IBM Corporation | Software and services supplier | Maximo asset management and AI services for energy operators |
| SAP SE | Enterprise software vendor | Supply chain, maintenance and operations analytics linked to ERP for oil and gas |
| Accenture plc | Integration and services provider | Data platform integration and analytics services for oil and gas operators |
Measured field results will decide vendor share
Credence Research's view is that measured field results, not platform features, will decide vendor positions in this market to 2035. National oil companies are moving fastest, and their contracts reward suppliers that can work with national data rules and local partners. Upstream still holds 61.0% of 2025 value, yet the fastest new demand comes from maintenance analytics and LNG terminals. Public evidence on agent productivity rests mainly on single company statements, so operators should require audited pilots before signing enterprise agreements, and vendors able to publish verified savings will gain share.
Estimates rebuilt to 2025 from public energy data
The report uses 2025 as the base year and forecasts the market to 2035, with market values from the Credence Research model. The 2025 value replaces the earlier Credence Research estimate, which rested on a 2022 base, with a new estimate built from public energy investment data, disclosed contract scopes and vendor pricing. Regional and segment shares are Credence Research estimates built from public production, investment and contract data. Sources include the IEA, the EIA, the European Commission, company releases and trade publications. No interviews or surveys were used to build these estimates.
AI agents and LNG growth set the path to 2035
Through 2035, the market is set to grow from USD 13.53 billion in 2026 to USD 53.06 billion, as operators move from single-field analytics projects to enterprise data platforms with AI agents. Upstream keeps the largest share, while midstream gains on new LNG trains and maintenance analytics adds the fastest new demand. The Gulf states lead growth through national oil company programs. Methane rules in Europe and the United States will shape compliance spending, and the main uncertainty is whether AI agents deliver field savings large enough to justify contracts across whole asset portfolios.
Field results and oil prices set the range of outcomes
The forecast range depends on whether AI agents deliver measured savings at field scale and on how far upstream budgets fall. Weak results from early agent programs, combined with lower oil prices, would keep many operators at pilot scale. Clear production and downtime gains from national oil company programs, together with new LNG capacity, would move more operators to enterprise contracts.
| Scenario | CAGR, 2026–2035 | Value, 2035 | What has to hold |
|---|---|---|---|
| Downside | 13.9% | USD 43.64 billion | Agent programs stall, upstream budgets fall further and operators keep pilots small |
| Base | 16.40% | USD 53.06 billion | NOC AI programs scale on plan and LNG terminals add midstream analytics demand |
| Upside | 18.4% | USD 61.85 billion | Measured production gains drive enterprise contracts across majors and independents |
Frequently Asked Questions
How big is the big data and analytics in oil and gas market?
What does big data analytics do in oil and gas exploration and production?
Which region leads the market?
How fast is midstream oil and gas analytics growing?
Which data science platforms do oil and gas companies use?
How do oil and gas companies monetize their data?
What are the main challenges for buyers?
Who are the leading companies in big data and analytics in oil and gas?
Table of Content
Chapter 1 Market Segmentation
- 1.1 Segmentation Framework
- 1.1.1 Product and Service Classification
- 1.1.2 Application and End-Use Classification
- 1.1.3 Technology and Solution Classification
- 1.1.4 Customer and Distribution Channel Classification
- 1.1.5 Geographic Segmentation
- 1.1.6 Market Segment Definitions and Boundaries
- 1.2 By Application
- 1.2.1 Production Optimization & Reservoir Management
- 1.2.2 Predictive Maintenance & Asset Performance Management
- 1.2.3 Seismic Data Analysis
- 1.2.4 Well Data Analytics
- 1.2.5 Supply Chain & Operations Optimization
- 1.2.6 Cybersecurity Monitoring
- 1.3 By Analytics Type
- 1.3.1 Big Data Processing & Descriptive Analytics
- 1.3.2 Cognitive Analytics (AI & ML)
- 1.4 By Sector
- 1.4.1 Upstream
- 1.4.2 Midstream
- 1.4.3 Downstream
Chapter 2 Introduction
- 2.1 Report Objectives and Scope
- 2.2 Product Definition and Industry Terminology
- 2.3 Market Inclusions and Exclusions
- 2.4 Research Process
- 2.4.1 Primary Research and Expert Interviews
- 2.4.2 Secondary Research and Source Review
- 2.4.3 Top-Down and Bottom-Up Estimation
- 2.4.4 Data Triangulation and Verification
- 2.5 Market Size Measurement Basis
- 2.5.1 2025: USD 11.62 billion → 2035: USD 53.06 billion
- 2.6 Historical and Forecast Reference Periods
- 2.6.1 Historical Period: 2018-2025
- 2.6.2 Base Year: 2025
- 2.6.3 Forecast Period: 2025-2035
- 2.7 Research Assumptions and Limitations
Chapter 3 Executive Summary
- 3.1 Market Snapshot and Key Findings
- 3.2 Base-Year Market Size, 2025
- 3.3 Forecast Market Size, 2035
- 3.4 Revenue and Volume Growth Outlook
- 3.5 Key Demand and Supply Indicators
- 3.6 Leading Market Segments
- 3.7 Fastest-Growing Market Opportunities
- 3.8 Regional Performance Highlights
- 3.9 Technology and Industry Transformation
- 3.10 Competitive Landscape Summary
- 3.11 Analyst View and Strategic Implications
Chapter 4 Global Big Data and Analytics in Oil and Gas Market Trends and Developments
- 4.1 Historical Industry Development, 2018-2025
- 4.2 Recent Market Trends and Developments
- 4.3 Demand and Customer Behavior Trends
- 4.4 Technology and Product Innovation
- 4.5 Artificial Intelligence, Automation and Digitalization
- 4.6 Local Manufacturing and Supply Chain Realignment
- 4.7 Industry Partnerships, Mergers and Acquisitions
- 4.8 Sustainability and Circular Economy Developments
- 4.9 Government and Private Sector Investment Trends
- 4.10 Emerging Business Models and Commercialization
- 4.11 Industry Developments and Announcements
Chapter 5 Global Big Data and Analytics in Oil and Gas Market Supply and Demand Analysis
- 5.1 Demand Trend and Consumption Analysis, 2018-2025
- 5.2 Demand Forecast, 2025-2035
- 5.3 Supply Chain Structure and Procurement Trends
- 5.4 Supply-Demand Gap and Bottlenecks
- 5.5 Import Dependence and Sourcing Structure
- 5.6 Regional Supply and Demand Concentration
Chapter 6 Global Big Data and Analytics in Oil and Gas Market Pricing Analysis
- 6.1 Pricing Structure and Measurement
- 6.2 Historical Pricing Trends, 2018-2025
- 6.3 Pricing Outlook, 2025-2035
- 6.4 Pricing by Product and Market Segment
- 6.5 Geographic Pricing Differences
- 6.6 Key Input, Energy, Labor and Logistics Costs
- 6.7 Contract Pricing and Purchasing Models
- 6.8 Pricing Sensitivity and Competitive Positioning
- 6.9 Price, Margin and Profitability Implications
Chapter 7 Global Big Data and Analytics in Oil and Gas Market Dynamics
- 7.1 Market Growth Drivers
- 7.1.1 Demand-Side Drivers
- 7.1.2 Technology and Innovation Drivers
- 7.1.3 Infrastructure and Investment Drivers
- 7.1.4 Regulatory and Policy Drivers
- 7.2 Market Restraints
- 7.2.1 Cost and Affordability Constraints
- 7.2.2 Technology and Adoption Barriers
- 7.2.3 Supply Chain and Operational Constraints
- 7.3 Market Challenges
- 7.3.1 Competitive Pressure and Margin Erosion
- 7.3.2 Skills, Infrastructure and Implementation Gaps
- 7.4 Emerging Market Opportunities
- 7.5 Market Dynamics Impact and Time-Horizon Assessment
Chapter 8 Global Big Data and Analytics in Oil and Gas Value Chain Analysis
- 8.1 Industry Value Chain Overview
- 8.2 Upstream Suppliers and Critical Inputs
- 8.3 Technology and Component Providers
- 8.4 Manufacturing or Service Delivery
- 8.5 Distribution, Channel Partners and Integrators
- 8.6 Downstream Applications and End Users
- 8.7 Value Addition and Profit Pools
- 8.8 Vertical Integration and Outsourcing
- 8.9 Supplier Concentration and Risk
- 8.10 Supply Chain Localization and Resilience
Chapter 9 Global Big Data and Analytics in Oil and Gas Market Regulations and Policies
- 9.1 Relevant Laws, Standards and Compliance Frameworks
- 9.2 Product, Service, Safety and Quality Requirements
- 9.3 Government Policies, Incentives and Subsidies
- 9.4 Imports, Exports and Trade Barriers
- 9.5 Public Procurement and Local Content Requirements
- 9.6 Data Protection, AI and Cybersecurity Compliance
- 9.7 Upcoming Policy Changes and Market Implications
Chapter 10 Global Big Data and Analytics in Oil and Gas Market Hotspots and Opportunities
- 10.1 Market Opportunity Mapping and Growth Hotspots
- 10.2 High-Growth Applications and Customer Groups
- 10.3 Underserved Markets and White-Space Opportunities
- 10.4 Emerging Technology and Product Opportunities
- 10.5 New Capacity and Investment Hotspots
- 10.6 Market Entry and Expansion Opportunities
- 10.7 Distribution and Partnership Opportunities
- 10.8 Near-Term and Long-Term Commercial Potential
- 10.9 Opportunity Attractiveness and Execution Risks
Chapter 11 Global Big Data and Analytics in Oil and Gas Market Outlook, 2025-2035
- 11.1 Market Size and Analysis
- 11.1.1 Revenue (Market Measurement: 2025: USD 11.62 billion → 2035: USD 53.06 billion)
- 11.1.2 Historical Market Size, 2018-2025
- 11.1.3 Base-Year Market Size, 2025
- 11.2 Market Forecast, 2025-2035
- 11.2.1 Revenue Forecast to 2035
- 11.2.2 CAGR and Year-on-Year Growth
- 11.2.3 Incremental Revenue Opportunity
- 11.3 Forecast Assumptions and Scenario Analysis
- 11.3.1 Base-Case Forecast
- 11.3.2 Optimistic and Conservative Scenarios
- 11.3.3 Technology, Pricing and Policy Sensitivities
- 11.4 Market Attractiveness and Growth Outlook
Chapter 12 Global Big Data and Analytics in Oil and Gas Market Segmentation and Outlook
- 12.1 Segmentation Summary and Market Shares, 2025
- 12.2 Largest and Fastest-Growing Segments
- 12.3 By Application - Market Size and Forecast, 2025-2035
- 12.3.1 Segment Definition and Scope
- 12.3.2 Historical Market Size, 2018-2025
- 12.3.3 Revenue Forecast, 2025-2035
- 12.3.4 Base-Year Market Share, 2025
- 12.3.5 Segment CAGR and Growth Drivers
- 12.3.6 Subsegment Market Size and Forecast
- 12.3.6.1 Production Optimization & Reservoir Management
- 12.3.6.2 Predictive Maintenance & Asset Performance Management
- 12.3.6.3 Seismic Data Analysis
- 12.3.6.4 Well Data Analytics
- 12.3.6.5 Supply Chain & Operations Optimization
- 12.3.6.6 Cybersecurity Monitoring
- 12.3.7 Subsegment Pricing and Adoption Trends
- 12.3.8 Leading Suppliers and Competition
- 12.3.9 Regional Demand and Opportunities
- 12.4 By Analytics Type - Market Size and Forecast, 2025-2035
- 12.4.1 Segment Definition and Scope
- 12.4.2 Historical Market Size, 2018-2025
- 12.4.3 Revenue Forecast, 2025-2035
- 12.4.4 Base-Year Market Share, 2025
- 12.4.5 Segment CAGR and Growth Drivers
- 12.4.6 Subsegment Market Size and Forecast
- 12.4.6.1 Big Data Processing & Descriptive Analytics
- 12.4.6.2 Cognitive Analytics (AI & ML)
- 12.4.7 Subsegment Pricing and Adoption Trends
- 12.4.8 Leading Suppliers and Competition
- 12.4.9 Regional Demand and Opportunities
- 12.5 By Sector - Market Size and Forecast, 2025-2035
- 12.5.1 Segment Definition and Scope
- 12.5.2 Historical Market Size, 2018-2025
- 12.5.3 Revenue Forecast, 2025-2035
- 12.5.4 Base-Year Market Share, 2025
- 12.5.5 Segment CAGR and Growth Drivers
- 12.5.6 Subsegment Market Size and Forecast
- 12.5.6.1 Upstream
- 12.5.6.2 Midstream
- 12.5.6.3 Downstream
- 12.5.7 Subsegment Pricing and Adoption Trends
- 12.5.8 Leading Suppliers and Competition
- 12.5.9 Regional Demand and Opportunities
- 12.6 Segment Growth Comparison
- 12.7 Segment Attractiveness and Priority Matrix
Chapter 13 Global Big Data and Analytics in Oil and Gas End-Use and Application Market Outlook
- 13.1 End-Use Industry and Customer Demand Structure
- 13.2 Leading Applications and Customer Groups
- 13.3 End-Use Market Size, Share and Forecast
- 13.4 Major End-Use Industry Deep Dives
- 13.4.1 Customer Requirements and Use Cases
- 13.4.2 Demand and Replacement Cycles
- 13.4.3 Technical and Regulatory Considerations
- 13.4.4 Purchasing and Procurement Models
- 13.4.5 Leading Vendors and Distribution Channels
- 13.4.6 Forecast and Commercial Opportunities
- 13.5 Emerging Applications and Cross-Segment Demand
- 13.6 End-Use Industry Investment Priorities
Chapter 14 Global Big Data and Analytics in Oil and Gas Geographic Market Outlook, 2025-2035
- 14.1 Regional Market Size and Share, 2025
- 14.2 Regional Market Forecast, 2025-2035
- 14.3 Regional Pricing, Production and Demand Differences
- 14.4 North America
- 14.4.1 United States
- 14.4.2 Canada
- 14.4.3 Mexico
- 14.5 Europe
- 14.5.1 Germany
- 14.5.2 France
- 14.5.3 Italy
- 14.5.4 United Kingdom
- 14.5.5 Spain
- 14.5.6 Poland
- 14.5.7 Russia
- 14.5.8 Netherlands
- 14.5.9 Belgium
- 14.5.10 Sweden
- 14.5.11 Denmark
- 14.5.12 Norway
- 14.5.13 Rest of Europe
- 14.6 Asia Pacific
- 14.6.1 China
- 14.6.2 India
- 14.6.3 Japan
- 14.6.4 South Korea
- 14.6.5 Thailand
- 14.6.6 Indonesia
- 14.6.7 Vietnam
- 14.6.8 Malaysia
- 14.6.9 Australia
- 14.6.10 Rest of Asia Pacific
- 14.7 Latin America
- 14.7.1 Brazil
- 14.7.2 Argentina
- 14.7.3 Colombia
- 14.7.4 Chile
- 14.7.5 Rest of Latin America
- 14.8 Middle East
- 14.8.1 Saudi Arabia
- 14.8.2 United Arab Emirates
- 14.8.3 Turkey
- 14.8.4 Israel
- 14.8.5 Iran
- 14.8.6 Rest of the Middle East
- 14.9 Africa
- 14.9.1 South Africa
- 14.9.2 Egypt
- 14.9.3 Nigeria
- 14.9.4 Morocco
- 14.9.5 Rest of Africa
- 14.10 Regional Investment, Policy and Supply Chain Differences
- 14.11 Regional Competitive Landscape
- 14.12 Geographic Growth Hotspots
Chapter 15 Global Big Data and Analytics in Oil and Gas Technology, Innovation and Sustainability Outlook
- 15.1 Technology Landscape and Maturity
- 15.2 Product, Process and Service Innovation
- 15.3 AI, Automation and Digital Tools in the Industry
- 15.4 Technology Adoption and Performance Benchmarking
- 15.5 Innovation Pipeline and R&D Investment
- 15.6 Patent and Intellectual Property Trends
- 15.7 Energy Efficiency and Resource Management
- 15.8 Sustainability, Recycling and Circularity
- 15.9 Technology Roadmap, 2025-2035
- 15.10 Risks of Obsolescence and Technology Substitution
Chapter 16 Global Big Data and Analytics in Oil and Gas Market Key Strategic Imperatives
- 16.1 Growth and Market Entry Priorities
- 16.2 High-Return Products and Segments
- 16.3 Pricing, Profitability and Cost Optimization
- 16.4 Technology Investment and Product Differentiation
- 16.5 Supply Chain Localization and Resilience
- 16.6 Distribution and Customer Acquisition
- 16.7 Partnership, Acquisition and Capacity Strategy
- 16.8 Regional Expansion Priorities
- 16.9 Short-, Medium- and Long-Term Actions
Chapter 17 Competition Outlook
- 17.1 Industry Competition Characteristics
- 17.2 Market Structure and Concentration
- 17.3 Market Share and Competitive Positioning, 2025
- 17.4 Company-Wise Revenue and Product Benchmarking
- 17.5 Production and Service Capacity Benchmarking
- 17.6 Technology, Pricing and Differentiation
- 17.7 Regional Footprint and Distribution Strength
- 17.8 Mergers, Acquisitions and Strategic Alliances
- 17.9 New Entrants and Competitive Threats
- 17.10 Porter's Five Forces and Industry Attractiveness
- 17.11 Competitive Outlook, 2025-2035
Chapter 18 Company Profiles
- 18.1 Company Coverage and Selection Criteria
- 18.2 SLB
- 18.2.1 Business Description
- 18.2.2 Company Ownership and Geographic Presence
- 18.2.3 Product and Service Portfolio
- 18.2.4 Manufacturing and Operating Footprint
- 18.2.5 Financial Performance and Investment
- 18.2.6 Market Share and Competitive Position
- 18.2.7 Technology and Innovation Capabilities
- 18.2.8 Strategic Alliances or Partnerships
- 18.2.9 Recent Developments
- 18.2.10 Growth Strategy and Outlook
- 18.3 Halliburton Company (Landmark)
- 18.4 Baker Hughes Company
- 18.5 Emerson Electric Co. (AspenTech)
- 18.6 Schneider Electric SE (AVEVA)
- 18.7 Microsoft Corporation
- 18.8 Amazon Web Services (Amazon)
- 18.9 Cognite AS
- 18.10 C3.ai, Inc.
- 18.11 IBM Corporation
- 18.12 SAP SE
- 18.13 Accenture plc
- 18.14 Other Relevant Market Participants
Note: Every listed company is profiled on the structure shown under the first company. The company list is preliminary and may change based on research findings, market developments, data availability and client requirements.
Chapter 19 Disclaimer
- 19.1 Research and Forecast Disclaimer
- 19.2 Data Source and Estimation Limitations
Note: The depth of individual sections depends on data availability for this market. Volume, capacity, trade and other unit-based metrics are included where applicable.

