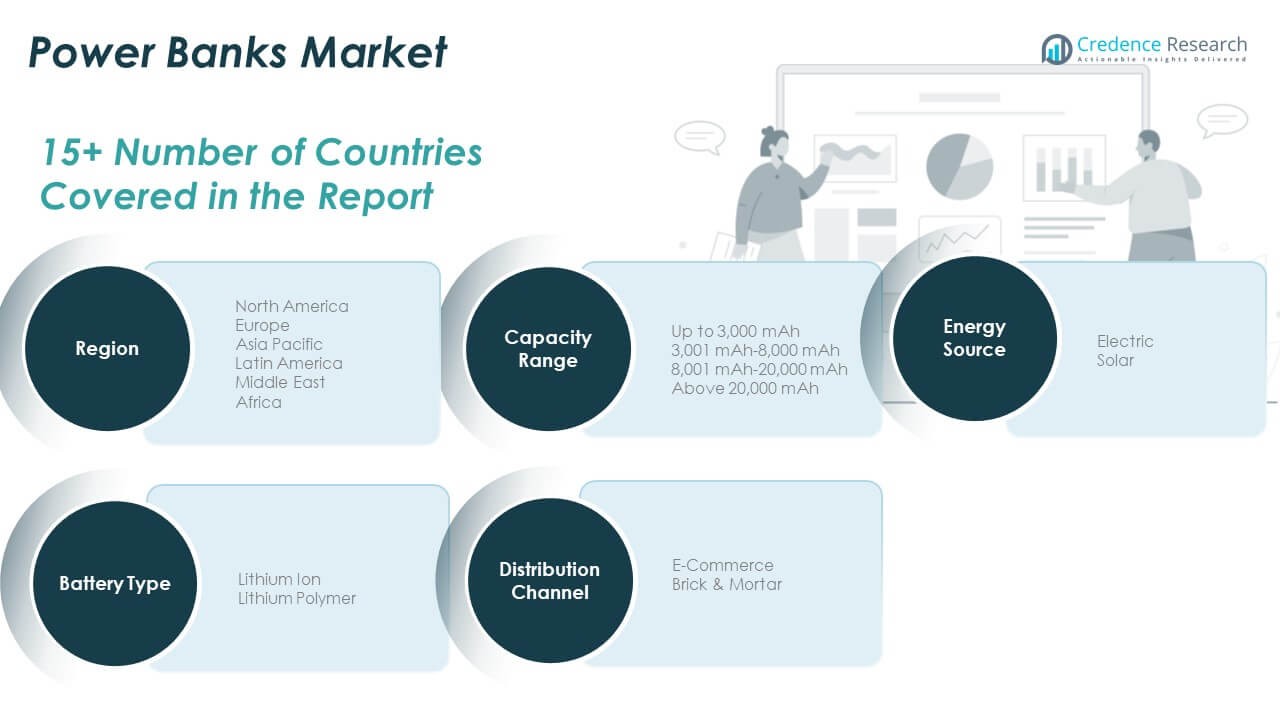
Power Banks Market By Battery Type (Lithium-Ion (Li-Ion) Battery, Lithium Polymer (Li-Polymer) Battery) By Unit of USB Port (1 USB Port, 2 USB Ports, More than 2 USB Ports) By Indicator (LED Lighting, Digital Display) By Capacity (1,000–5,000 mAh, 5,001–10,000 mAh, 10,001–15,000 mAh, 15,001–20,000 mAh, Above 20,001 mAh) By Price Range (Low, Medium, Premium) By Application – Growth, Share, Opportunities, Competitive Analysis And Forecast To 2016 – 2028

Price: $3699

Published: | Report ID: 11104 | Report Format : PDF

How will the Integration of Solar Energy with Power Bank Benefit the Market?

A solar power bank is an energy storage device that collects solar energy and uses it to charge/power various electronic devices such as phones, tablets, laptops, torches, lights, televisions, and so on. With the advent of 3G and 4G services on smartphones and tablets, the growing usage of the internet has increased battery consumption at a quicker rate, boosting the solar power bank industry. Furthermore, vacationers or trekkers who want to travel to remote locations can rely on solar power banks over traditional power banks because solar power banks can be charged via sunshine in times of emergency. Limited electricity availability in rural areas in rising markets such as Africa, Asia, and Latin America presents good potential for solar power banks.

What is the Market Size of Power Banks Market in terms of value?

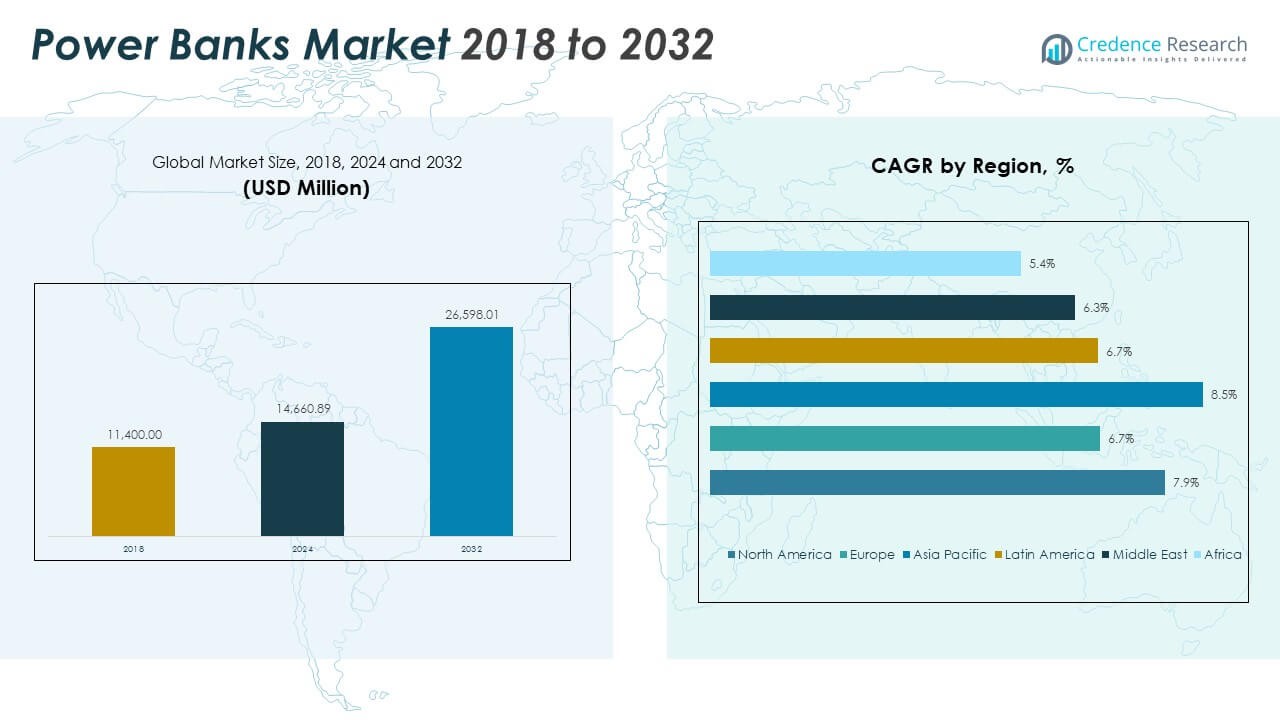
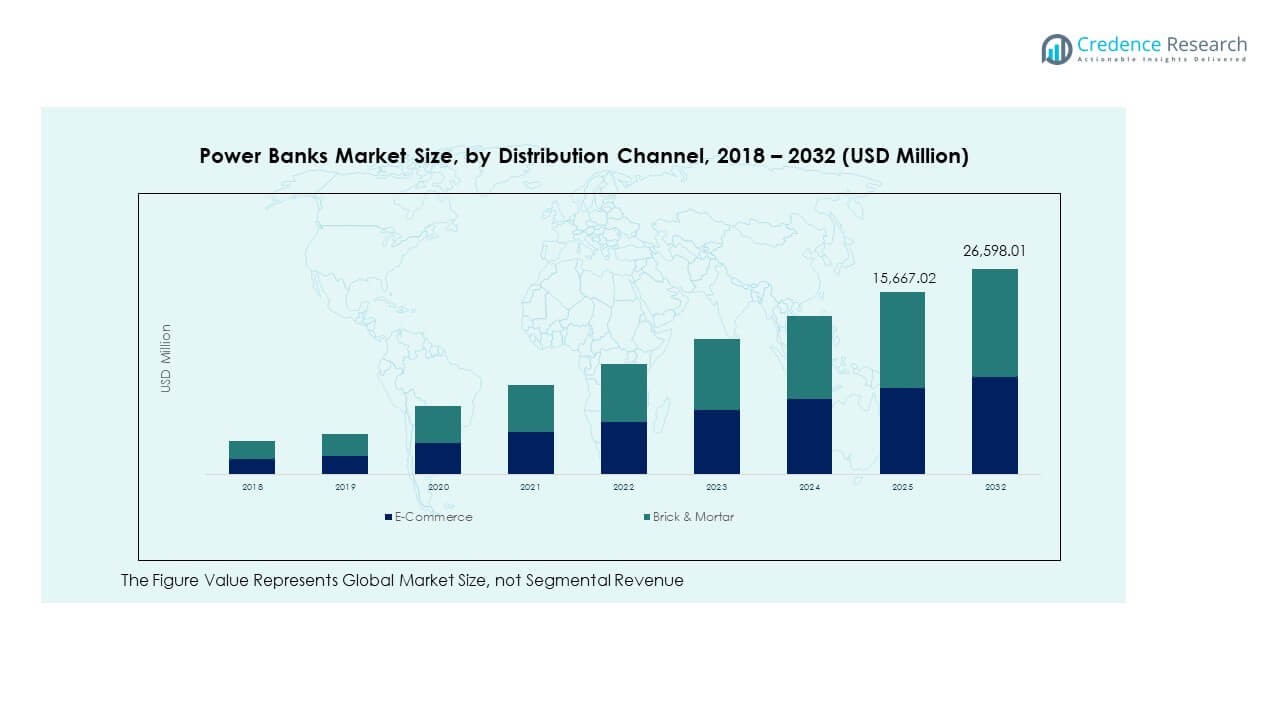
Global Power Banks Market is projected to increase at a significant CAGR of 7.6 % in the coming years. In 2021, the global Power Banks Market was valued at USD 9.2 billion and is projected to reach at a value of USD 14.2 billion by 2028. The demand for Power Banks is projected to increase substantially in the coming years and is presumed to generate revenue opportunities for the key industry players that worth USD 5.07 billion during the forecast period between 2022 and 2028.

power-banks-market

Why Lithium-Ion Batteries are Preferred in Power Banks?

In the forecast period, the lithium-ion sector will acquire a major market share. Li-ion batteries have various benefits, including low self-discharge, high energy density, and low maintenance. Furthermore, the decline in demand for lead-acid batteries as a result of EPA regulations on lead contamination and the resulting environmental hazards, as well as regulations on lead-acid battery storage, disposal, and recycling, has resulted in an increase in demand for lithium-ion batteries. Manufacturing on a big scale, falling component prices, and the use of sophisticated technologies to increase battery capacity are some of the drivers driving down prices. A price decrease would hasten the adoption of these batteries in a variety of new applications.

Design Element 2

Access crucial information at unmatched prices!

Request your free sample report today & start making informed decisions powered by Credence Research!

Download Free Sample

CTA Design Element 3

Interesting Facts about Power Banks Market Industry

  • The top 5 countries for Power Banks exports are China, India, Mexico, UK, and Netherland.
  • The top 5 countries for Power Banks imports are Russia, Brazil, USA, Vietnam, and Kenya.
  • Increasing internet-related services via smartphones and tablets, a drop in power bank prices, frequent power outages in certain countries, an increase in power consumption of smartphones, and a sudden shift to work-from-home and remote learning due to COVID-19, resulting in a spike in demand for laptops are among the factors driving the power bank market.
  • Power bank market growth is hampered by issues such as rising wireless charging trends, higher battery capacity of electronic gadgets, and increasing customer preference for rental power banks.
  • Asia Pacific leads the global market due to the increasing trend of digitalization, prevalence of e-commerce portals, and the availability of low-cost power banks.
  • During the forecast period, the 10,001–15,000 mAh sector of the power bank market is predicted to develop at the fastest rate. These power banks feature a high output efficiency and a longer battery life, as well as LEDs or LCDs that show the battery level.

Who are the Top 10 players/companies in the Power Banks Market in terms of value and volume?

The key players in the global Power Banks Market in terms of value and volume include Anker Innovations (China), AUKEY (China), Xiaomi (China), ADATA (Taiwan), RAVPower (US), GRIFFIN (US), Lenovo (China), mophie (US), AMBRANE (India), and INTEX (India), among other. These key players are concentrating on new product developments as well as technological innovation to enhance their production of Power Banks to gain competitive market share at a global level. Moreover, some regional and country-level players are also investing heavily to expand their product portfolio and to enhance their sales. For instance, in June 2020, Xiaomi Corporation unveiled the Mi Power Bank 3 with a gigantic 30,000mAh battery capacity, capable of charging the current iPhone SE more than ten times and its flagship Mi 10 roughly five times. Xiaomi’s latest power bank is a considerable increase over the Power Bank 2 and features a robust build. For instance, in May 2020, Gionee introduced a new GBuddy 10,000mAh wireless power bank in India. The newly built power bank is priced at INR 3,999 in India and is available for purchase through the e-commerce site Amazon India. The company began selling the power bank for INR 1,299 as part of its initial deal.

Who are the Top 10 Countries in the Power Banks Market?

In the global Power Banks Market, the major countries are US, Canada, China, India, Japan, South Korea, Germany, UK, France, and Mexico. The India Power Bank Market is predicted to expand rapidly. Rising electronic gadget ownership and lowering power bank prices are the primary drivers of the Indian power bank market. Rising disposable income, urbanization, and increased adoption of smartphones, tablets, and tiny electronic gadgets are some important factors that will have a positive impact on India’s power bank market over the forecast period. With the availability of internet-based applications and games, the energy consumption of electronic gadgets has increased substantially in recent years, as has their use. Therefore, power banks are extremely useful in the event of a frequent outage or an unpredictable power source in the country.

Which is the Key Application Area in the Power Banks Market?

The key applications of the Power Banks Market include Smart Phone, Tablet, Laptop, Portable Media Devices, Wearable Device, Digital Camera, and Others. Smartphones represent a significant application market for power banks. The excessive usage of data and internet services on smartphones is one of the key reasons that contribute to battery life draining quickly. This increases the demand for power banks, which allow cellphones to run for longer periods of time. Smartphones have short-life batteries, which raises the demand for power banks. As a result, power banks have a huge potential in smartphone applications. COVID-19 pandemic is causing havoc in the smartphone sector, which is one of the main consumers of power banks. The stoppage of manufacturing facilities has caused a halt in smartphone production, and lower consumer spending has impacted demand for power banks. However, once the situation stabilizes, the power bank market will gain traction.

What are the Major Driving Factors for Power Banks Market?

The growing use of smartphones and other electronic gadgets such as tablets, notepads, digital watches, and headphones increases the demand for power banks. The increased usage of hydrogen and solar cells in power banks has lessened the devices’ need on electrical energy to some extent, transforming power banks from backup chargers to an independent source of energy. The consumer electronics industry’s effective distribution channel aids in the supply of electronic items to fulfill the demand of the worldwide population, which is projected to drive the power bank market. Reduced power bank costs and increased charging speed entice consumers to buy and push the global market.

What are the Major Restraints for Power Banks Market?

A huge number of players have recently entered the power bank industry, offering power banks of varying capacities, pricing, and designs. However, not all power banks are of excellent quality, since some power banks do not even last six months. Poor-quality power banks can cause overheating, shorten battery life, and, in the worst-case situation, explode. As a result, low-quality power banks might stifle market expansion. Government plans to install charging infrastructure in public places like airports, train stations, and offices may reduce the demand for power banks.

Shape Your Report to Specific Countries or Regions & Enjoy 30% Off!

Which Region Dominated the World Power Banks Market?

In the forecast period, the Asia Pacific region will lead the global market. Power bank use in the region is increasing due to the region’s growing population, large-scale digitization, inexpensive power banks, and e-commerce penetration in the electronics sector. With the growing number of electronic device users and the resulting increase in demand for power banks, the Asia Pacific market is likely to gain a large revenue share over the forecast period. The Asia Pacific regional market is predicted to grow at the fastest CAGR over the forecast period because of substantial urbanization and a quickly increasing industrial sector. Furthermore, the APAC region’s growing economies, such as China, India, South Korea, and other Southeast Asian countries, are becoming important global manufacturing hubs.

North America is likely to show significant growth in the worldwide power bank market because of the region’s high smartphone penetration. The increased connectedness of numerous devices, such as smart kitchen appliances, security systems, and smart accessories, is a major driver driving power bank sales in North American countries. Millennial consumers’ high discretionary income is complementing the growth of connected gadgets and the resulting demand to recharge smartphones and smart devices via power banks.

Segmentation of Global Power Banks Market-

Power Banks Market- By Battery Type

  • Lithium-Ion (Li-Ion) Battery
  • Lithium Polymer (Li-Polymer) Battery

Power Banks Market- By Unit of USB Port

  • 1 USB Port
  • 2 USB Ports
  • More than 2 USB Ports

Power Banks Market- By Indicator

  • LED Lighting
  • Digital Display

Power Banks Market- By Capacity

  • 1,000–5,000 mAh
  • 5,001–10,000 mAh
  • 10,001–15,000 mAh
  • 15,001–20,000 mAh
  • Above 20,001 mAh

Power Banks Market- By Price Range

  • Low
  • Medium
  • Premium

Power Banks Market- By Application

  • Smart Phone
  • Tablet
  • Laptop
  • Portable Media Device
  • Wearable Device
  • Digital Camera
  • Others

1. Preface
1.1. Report Description
1.1.1. Purpose of the Report
1.1.2. Target Audience
1.1.3. USP and Key Offerings
1.2. Research Scope
1.3. Research Methodology
1.3.1. Phase I – Secondary Research
1.3.2. Phase II – Primary Research
1.3.3. Phase III – Expert Panel Review
1.3.4. Approach Adopted
1.3.4.1. Top-Down Approach
1.3.4.2. Bottom-Up Approach
1.3.5. Assumptions
1.4. Market Segmentation

2. Executive Summary
2.1. Market Snapshot: Global Power Banks Market

3. Market Dynamics & Factors Analysis
3.1. Introduction
3.1.1. Global Power Banks Market Value, 2016-2028, (US$ Bn)
3.2. Market Dynamics
3.2.1. Key Growth Trends
3.2.2. Major Industry Challenges
3.2.3. Key Growth Pockets
3.3. Attractive Investment Proposition,2021
3.3.1. Type
3.3.2. Application
3.3.3. Unit of USB Port
3.3.4. Indicator
3.3.5. Capacity
3.3.6. Power Range
3.3.7. Geography
3.4. Porter’s Five Forces Analysis
3.4.1. Threat of New Entrants
3.4.2. Bargaining Power of Buyers/Consumers
3.4.3. Bargaining Power of Suppliers
3.4.4. Threat of Substitute Types
3.4.5. Intensity of Competitive Rivalry
3.5. Value Chain Analysis

4. Market Positioning of Key Players, 2021
4.1. Company market share of key players, 2021
4.2. Top 6 Players
4.3. Top 3 Players
4.4. Major Strategies Adopted by Key Players

5. COVID 19 Impact Analysis
5.1. Global Power Banks Market Pre Vs Post COVID 19, 2019 – 2028
5.2. Impact on Import & Export
5.3. Impact on Demand & Supply

6. North America
6.1. North America Power Banks Market, by Country, 2016-2028(US$ Bn)
6.1.1. U.S.
6.1.2. Canada
6.1.3. Mexico
6.2. North America Power Banks Market, by Type, 2016-2028(US$ Bn)
6.2.1. Overview
6.2.2. Lithium-Ion (Li-Ion) Battery
6.2.3. Lithium Polymer (Li-Polymer) Battery
6.3. North America Power Banks Market, by Application, 2016-2028(US$ Bn)
6.3.1. Overview
6.3.2. Smart Phone
6.3.3. Tablet
6.3.4. Laptop
6.3.5. Portable Media Device
6.3.6. Wearable Device
6.3.7. Digital Camera
6.3.8. Others
6.4. North America Power Banks Market, by Unit of USB Port, 2016-2028(US$ Bn)
6.4.1. Overview
6.4.2. 1 USB Port
6.4.3. 2 USB Ports
6.4.4. More than 2 USB Ports
6.5. North America Power Banks Market, by Indicator, 2016-2028(US$ Bn)
6.5.1. Overview
6.5.2. LED Lighting
6.5.3. Digital Display
6.6. North America Power Banks Market, by Capacity, 2016-2028(US$ Bn)
6.6.1. Overview
6.6.2. 1,000–5,000 mAh
6.6.3. 5,001–10,000 mAh
6.6.4. 10,001–15,000 mAh
6.6.5. 15,001–20,000 mAh
6.6.6. Above 20,001 mAh
6.7. North America Power Banks Market, by Power Range, 2016-2028(US$ Bn)
6.7.1. Overview
6.7.2. Low
6.7.3. Medium
6.7.4. Premium

7. Europe
7.1. Europe Power Banks Market, by Country, 2016-2028(US$ Bn)
7.1.1. UK
7.1.2. France
7.1.3. Germany
7.1.4. Italy
7.1.5. Russia
7.1.6. Ukraine
7.1.7. Spain
7.1.8. Belgium
7.1.9. Netherland
7.1.10. Austria
7.1.11. Sweden
7.1.12. Poland
7.1.13. Denmark
7.1.14. Switzerland
7.1.15. Rest of Europe
7.2. Europe Power Banks Market, by Type, 2016-2028(US$ Bn)
7.2.1. Overview
7.2.2. Lithium-Ion (Li-Ion) Battery
7.2.3. Lithium Polymer (Li-Polymer) Battery
7.3. Europe Power Banks Market, by Application, 2016-2028(US$ Bn)
7.3.1. Overview
7.3.2. Smart Phone
7.3.3. Tablet
7.3.4. Laptop
7.3.5. Portable Media Device
7.3.6. Wearable Device
7.3.7. Digital Camera
7.3.8. Others
7.4. Europe Power Banks Market, by Unit of USB Port, 2016-2028(US$ Bn)
7.4.1. Overview
7.4.2. 1 USB Port
7.4.3. 2 USB Ports
7.4.4. More than 2 USB Ports
7.5. Europe Power Banks Market, by Indicator, 2016-2028(US$ Bn)
7.5.1. Overview
7.5.2. LED Lighting
7.5.3. Digital Display
7.6. Europe Power Banks Market, by Capacity, 2016-2028(US$ Bn)
7.6.1. Overview
7.6.2. 1,000–5,000 mAh
7.6.3. 5,001–10,000 mAh
7.6.4. 10,001–15,000 mAh
7.6.5. 15,001–20,000 mAh
7.6.6. Above 20,001 mAh
7.7. Europe Power Banks Market, by Power Range, 2016-2028(US$ Bn)
7.7.1. Overview
7.7.2. Low
7.7.3. Medium
7.7.4. Premium

8. Asia Pacific
8.1. Asia Pacific Power Banks Market, by Country, 2016-2028(US$ Bn)
8.1.1. China
8.1.2. Japan
8.1.3. South Korea
8.1.4. India
8.1.5. Australia
8.1.6. New Zealand
8.1.7. Taiwan
8.1.8. Indonesia
8.1.9. Malaysia
8.1.10. Philippine
8.1.11. Rest of Asia Pacific
8.2. Asia Pacific Power Banks Market, by Type, 2016-2028(US$ Bn)
8.2.1. Overview
8.2.2. Lithium-Ion (Li-Ion) Battery
8.2.3. Lithium Polymer (Li-Polymer) Battery
8.3. Asia Pacific Power Banks Market, by Application, 2016-2028(US$ Bn)
8.3.1. Overview
8.3.2. Smart Phone
8.3.3. Tablet
8.3.4. Laptop
8.3.5. Portable Media Device
8.3.6. Wearable Device
8.3.7. Digital Camera
8.3.8. Others
8.4. Asia Pacific Power Banks Market, by Unit of USB Port, 2016-2028(US$ Bn)
8.4.1. Overview
8.4.2. 1 USB Port
8.4.3. 2 USB Ports
8.4.4. More than 2 USB Ports
8.5. Asia Pacific Power Banks Market, by Indicator, 2016-2028(US$ Bn)
8.5.1. Overview
8.5.2. LED Lighting
8.5.3. Digital Display
8.6. Asia Pacific Power Banks Market, by Capacity, 2016-2028(US$ Bn)
8.6.1. Overview
8.6.2. 1,000–5,000 mAh
8.6.3. 5,001–10,000 mAh
8.6.4. 10,001–15,000 mAh
8.6.5. 15,001–20,000 mAh
8.6.6. Above 20,001 mAh
8.7. Asia Pacific Power Banks Market, by Power Range, 2016-2028(US$ Bn)
8.7.1. Overview
8.7.2. Low
8.7.3. Medium
8.7.4. Premium

9. Latin America
9.1. Latin America Power Banks Market, by Country, 2016-2028(US$ Bn)
9.1.1. Brazil
9.1.2. Argentina
9.1.3. Peru
9.1.4. Chile
9.1.5. Colombia
9.1.6. Rest of Latin America
9.2. Latin America Power Banks Market, by Type, 2016-2028(US$ Bn)
9.2.1. Overview
9.2.2. Lithium-Ion (Li-Ion) Battery
9.2.3. Lithium Polymer (Li-Polymer) Battery
9.3. Latin America Power Banks Market, by Application, 2016-2028(US$ Bn)
9.3.1. Overview
9.3.2. Smart Phone
9.3.3. Tablet
9.3.4. Laptop
9.3.5. Portable Media Device
9.3.6. Wearable Device
9.3.7. Digital Camera
9.3.8. Others
9.4. Latin America Power Banks Market, by Unit of USB Port, 2016-2028(US$ Bn)
9.4.1. Overview
9.4.2. 1 USB Port
9.4.3. 2 USB Ports
9.4.4. More than 2 USB Ports
9.5. Latin America Power Banks Market, by Indicator, 2016-2028(US$ Bn)
9.5.1. Overview
9.5.2. LED Lighting
9.5.3. Digital Display
9.6. Latin America Power Banks Market, by Capacity, 2016-2028(US$ Bn)
9.6.1. Overview
9.6.2. 1,000–5,000 mAh
9.6.3. 5,001–10,000 mAh
9.6.4. 10,001–15,000 mAh
9.6.5. 15,001–20,000 mAh
9.6.6. Above 20,001 mAh
9.7. Latin America Power Banks Market, by Power Range, 2016-2028(US$ Bn)
9.7.1. Overview
9.7.2. Low
9.7.3. Medium
9.7.4. Premium

10. Middle East
10.1. Middle East Power Banks Market, by Country, 2016-2028(US$ Bn)
10.1.1. UAE
10.1.2. KSA
10.1.3. Israel
10.1.4. Turkey
10.1.5. Iran
10.1.6. Rest of Middle East
10.2. Middle East Power Banks Market, by Type, 2016-2028(US$ Bn)
10.2.1. Overview
10.2.2. Lithium-Ion (Li-Ion) Battery
10.2.3. Lithium Polymer (Li-Polymer) Battery
10.3. Middle East Power Banks Market, by Application, 2016-2028(US$ Bn)
10.3.1. Overview
10.3.2. Smart Phone
10.3.3. Tablet
10.3.4. Laptop
10.3.5. Portable Media Device
10.3.6. Wearable Device
10.3.7. Digital Camera
10.3.8. Others
10.4. Middle East Power Banks Market, by Unit of USB Port, 2016-2028(US$ Bn)
10.4.1. Overview
10.4.2. 1 USB Port
10.4.3. 2 USB Ports
10.4.4. More than 2 USB Ports
10.5. Middle East Power Banks Market, by Indicator, 2016-2028(US$ Bn)
10.5.1. Overview
10.5.2. LED Lighting
10.5.3. Digital Display
10.6. Middle East Power Banks Market, by Capacity, 2016-2028(US$ Bn)
10.6.1. Overview
10.6.2. 1,000–5,000 mAh
10.6.3. 5,001–10,000 mAh
10.6.4. 10,001–15,000 mAh
10.6.5. 15,001–20,000 mAh
10.6.6. Above 20,001 mAh
10.7. Middle East Power Banks Market, by Power Range, 2016-2028(US$ Bn)
10.7.1. Overview
10.7.2. Low
10.7.3. Medium
10.7.4. Premium

11. Africa
11.1. Africa Power Banks Market, by Country, 2016-2028(US$ Bn)
11.1.1. South Africa
11.1.2. Egypt
11.1.3. Nigeria
11.1.4. Rest of Africa
11.2. Africa Power Banks Market, by Type, 2016-2028(US$ Bn)
11.2.1. Overview
11.2.2. Lithium-Ion (Li-Ion) Battery
11.2.3. Lithium Polymer (Li-Polymer) Battery
11.3. Africa Power Banks Market, by Application, 2016-2028(US$ Bn)
11.3.1. Overview
11.3.2. Smart Phone
11.3.3. Tablet
11.3.4. Laptop
11.3.5. Portable Media Device
11.3.6. Wearable Device
11.3.7. Digital Camera
11.3.8. Others
11.4. Africa Power Banks Market, by Unit of USB Port, 2016-2028(US$ Bn)
11.4.1. Overview
11.4.2. 1 USB Port
11.4.3. 2 USB Ports
11.4.4. More than 2 USB Ports
11.5. Africa Power Banks Market, by Indicator, 2016-2028(US$ Bn)
11.5.1. Overview
11.5.2. LED Lighting
11.5.3. Digital Display
11.6. Africa Power Banks Market, by Capacity, 2016-2028(US$ Bn)
11.6.1. Overview
11.6.2. 1,000–5,000 mAh
11.6.3. 5,001–10,000 mAh
11.6.4. 10,001–15,000 mAh
11.6.5. 15,001–20,000 mAh
11.6.6. Above 20,001 mAh
11.7. Africa Power Banks Market, by Power Range, 2016-2028(US$ Bn)
11.7.1. Overview
11.7.2. Low
11.7.3. Medium
11.7.4. Premium

12. Global
12.1. Global Power Banks Market, by Type, 2016-2028(US$ Bn)
12.1.1. Overview
12.1.2. Lithium-Ion (Li-Ion) Battery
12.1.3. Lithium Polymer (Li-Polymer) Battery
12.2. Global Power Banks Market, by Application, 2016-2028(US$ Bn)
12.2.1. Overview
12.2.2. Smart Phone
12.2.3. Tablet
12.2.4. Laptop
12.2.5. Portable Media Device
12.2.6. Wearable Device
12.2.7. Digital Camera
12.2.8. Others
12.3. Global Power Banks Market, by Unit of USB Port, 2016-2028(US$ Bn)
12.3.1. Overview
12.3.2. 1 USB Port
12.3.3. 2 USB Ports
12.3.4. More than 2 USB Ports
12.4. Global Power Banks Market, by Indicator, 2016-2028(US$ Bn)
12.4.1. Overview
12.4.2. LED Lighting
12.4.3. Digital Display
12.5. Global Power Banks Market, by Capacity, 2016-2028(US$ Bn)
12.5.1. Overview
12.5.2. 1,000–5,000 mAh
12.5.3. 5,001–10,000 mAh
12.5.4. 10,001–15,000 mAh
12.5.5. 15,001–20,000 mAh
12.5.6. Above 20,001 mAh
12.6. Global Power Banks Market, by Power Range, 2016-2028(US$ Bn)
12.6.1. Overview
12.6.2. Low
12.6.3. Medium
12.6.4. Premium

13. Company Profiles
13.1. Anker Innovations
13.2. AUKEY
13.3. Xiaomi
13.4. ADATA
13.5. RAVPower
13.6. GRIFFIN
13.7. Lenovo
13.8. mophie
13.9. AMBRANE
13.10. INTEX
13.11. Others

List of Figures

FIG. 1 Global Power Banks Market: Research Methodology
FIG. 2 Market Size Estimation – Top Down & Bottom up Approach
FIG. 3 Global Power Banks Market Segmentation
FIG. 4 Global Power Banks Market, by Type, 2019 (US$ Bn)
FIG. 5 Global Power Banks Market, by Application, 2021 (US$ Bn)
FIG. 6 Global Power Banks Market, by USB Ports, 2019 (US$ Bn)
FIG. 7 Global Power Banks Market, by Indicator, 2021 (US$ Bn)
FIG. 8 Global Power Banks Market, by Capacity, 2019 (US$ Bn)
FIG. 9 Global Power Banks Market, by Power Range, 2021 (US$ Bn)
FIG. 10 Global Power Banks Market, by Geography, 2021 (US$ Bn)
FIG. 11 Attractive Investment Proposition, by Geography, 2021
FIG. 12 Global Market Positioning of Key Power Banks Market Manufacturers, 2019
FIG. 13 Global Power Banks Market Value Contribution, By Type, 2021 & 2028 (Value %)
FIG. 14 Global Power Banks Market, by Lithium-Ion (Li-Ion) Battery, Value, 2016-2028 (US$ Bn)
FIG. 15 Global Power Banks Market, by Lithium Polymer (Li-Polymer) Battery, Value, 2016-2028 (US$ Bn)
FIG. 16 Global Power Banks Market Value Contribution, By Application, 2021 & 2028 (Value %)
FIG. 17 Global Power Banks Market, by Smart Phone, Value, 2016-2028 (US$ Bn)
FIG. 18 Global Power Banks Market, by Tablet, Value, 2016-2028 (US$ Bn)
FIG. 19 Global Power Banks Market, by Laptop, Value, 2016-2028 (US$ Bn)
FIG. 20 Global Power Banks Market, by Portable Media Device, Value, 2016-2028 (US$ Bn)
FIG. 21 Global Power Banks Market, by Wearable Device, Value, 2016-2028 (US$ Bn)
FIG. 22 Global Power Banks Market, by Digital Camera, Value, 2016-2028 (US$ Bn)
FIG. 23 Global Power Banks Market Value Contribution, By Unit of USB Port, 2021 & 2028 (Value %)
FIG. 24 Global Power Banks Market, by 1 USB Port, 2016-2028 (US$ Bn)
FIG. 25 Global Power Banks Market, by 2 USB Port, Value, 2016-2028 (US$ Bn)
FIG. 26 Global Power Banks Market, by 1 USB Port, Value, 2016-2028 (US$ Bn)
FIG. 27 Global Power Banks Market Value Contribution, By Indicator, 2021 & 2028 (Value %)
FIG. 28 Global Power Banks Market, by LED Lighting, 2016-2028 (US$ Bn)
FIG. 29 Global Power Banks Market, by Digital Display, 2016-2028 (US$ Bn)
FIG. 30 Global Power Banks Market Value Contribution, By Capacity, 2021 & 2028 (Value %)
FIG. 31 Global Power Banks Market, by 1,000–5,000 mAh, 2016-2028 (US$ Bn)
FIG. 32 Global Power Banks Market, by 5,001–10,000 mAh, 2016-2028 (US$ Bn)
FIG. 33 Global Power Banks Market, by 10,001–15,000 mAh, 2016-2028 (US$ Bn)
FIG. 34 Global Power Banks Market, by 15,001–20,000 mAh, 2016-2028 (US$ Bn)
FIG. 35 Global Power Banks Market, by Above 20,001 mAh, 2016-2028 (US$ Bn)
FIG. 36 Global Power Banks Market Value Contribution, By Price Range, 2021 & 2028 (Value %)
FIG. 37 Global Power Banks Market, by Low, 2016-2028 (US$ Bn)
FIG. 38 Global Power Banks Market, by Medium, 2016-2028 (US$ Bn)
FIG. 39 Global Power Banks Market, by Premium, 2016-2028 (US$ Bn)
FIG. 40 U.S. Power Banks Market, 2016-2028 (US$ Bn)
FIG. 41 Rest of North America Power Banks Market, 2016-2028 (US$ Bn)
FIG. 42 U.K. Power Banks Market, 2016-2028 (US$ Bn)
FIG. 43 Germany Power Banks Market, 2016-2028 (US$ Bn)
FIG. 44 France Power Banks Market, 2016-2028 (US$ Bn)
FIG. 45 Italy Power Banks Market, 2016-2028 (US$ Bn)
FIG. 46 Spain Power Banks Market, 2016-2028 (US$ Bn)
FIG. 47 Russia Power Banks Market, 2016-2028 (US$ Bn)
FIG. 48 BENELUX Power Banks Market, 2016-2028 (US$ Bn)
FIG. 49 Poland Power Banks Market, 2016-2028 (US$ Bn)
FIG. 50 Austria Power Banks Market, 2016-2028 (US$ Bn)
FIG. 51 Rest of Europe Power Banks Market, 2016-2028 (US$ Bn)
FIG. 52 Japan Power Banks Market, 2016-2028 (US$ Bn)
FIG. 53 China Power Banks Market, 2016-2028 (US$ Bn)
FIG. 54 India Power Banks Market, 2016-2028 (US$ Bn)
FIG. 55 South Korea Power Banks Market, 2016-2028 (US$ Bn)
FIG. 56 Australia Power Banks Market, 2016-2028 (US$ Bn)
FIG. 57 Southeast Asia Power Banks Market, 2016-2028 (US$ Bn)
FIG. 58 Rest of Asia Pacific Power Banks Market, 2016-2028 (US$ Bn)
FIG. 59 Middle East & Africa Power Banks Market, 2016-2028 (US$ Bn)
FIG. 60 South Africa Power Banks Market, 2016-2028 (US$ Bn)
FIG. 61 Nigeria Power Banks Market, 2016-2028 (US$ Bn)
FIG. 62 Egypt Power Banks Market, 2016-2028 (US$ Bn)
FIG. 63 GCC Power Banks Market, 2016-2028 (US$ Bn)
FIG. 64 Israel Power Banks Market, 2016-2028 (US$ Bn)
FIG. 65 Latin America Power Banks Market, 2016-2028 (US$ Bn)
FIG. 66 Mechanicalzil Power Banks Market, 2016-2028 (US$ Bn)
FIG. 67 Argentina Power Banks Market, 2016-2028 (US$ Bn)
FIG. 68 Colombia Power Banks Market, 2016-2028 (US$ Bn)
FIG. 69 Peru Power Banks Market, 2016-2028 (US$ Bn)
FIG. 70 Chile Power Banks Market, 2016-2028 (US$ Bn)

List of Tables

TABLE 1 Market Snapshot: Global Power Banks Market
TABLE 2 Global Power Banks Market, by Type, 2016-2028 (US$ Bn)
TABLE 3 Global Power Banks Market, by Application, 2016-2028 (US$ Bn)
TABLE 4 Global Power Banks Market, by Unit of USB Port, 2016-2028 (US$ Bn)
TABLE 5 Global Power Banks Market, by Consumer, 2016-2028 (US$ Bn)
TABLE 6 Global Power Banks Market, by Sales Channel, 2016-2028 (US$ Bn)
TABLE 7 Global Power Banks Market, by Geography, 2016-2028 (US$ Bn)
TABLE 8 North America Power Banks Market, by Type, 2016-2028 (US$ Bn)
TABLE 9 North America Power Banks Market, by Application, 2016-2028 (US$ Bn)
TABLE 10 North America Power Banks Market, by Unit of USB Port, 2016-2028 (US$ Bn)
TABLE 11 North America Power Banks Market, by Consumer, 2016-2028 (US$ Bn)
TABLE 12 North America Power Banks Market, by Sales Channel, 2016-2028 (US$ Bn)
TABLE 13 North America Power Banks Market, by Country, 2016-2028 (US$ Bn)
TABLE 14 Europe Power Banks Market, by Type, 2016-2028 (US$ Bn)
TABLE 15 Europe Power Banks Market, by Application, 2016-2028 (US$ Bn)
TABLE 16 Europe Power Banks Market, by Unit of USB Port, 2016-2028 (US$ Bn)
TABLE 17 Europe Power Banks Market, by Consumer, 2016-2028 (US$ Bn)
TABLE 18 Europe Power Banks Market, by Sales Channel, 2016-2028 (US$ Bn)
TABLE 19 Europe Power Banks Market, by Country/Region, 2016-2028 (US$ Bn)
TABLE 20 Asia Pacific Power Banks Market, by Type, 2016-2028 (US$ Bn)
TABLE 21 Asia Pacific Power Banks Market, by Application, 2016-2028 (US$ Bn)
TABLE 22 Asia Pacific Power Banks Market, by Unit of USB Port, 2016-2028 (US$ Bn)
TABLE 23 Asia Pacific Power Banks Market, by Consumer, 2016-2028 (US$ Bn)
TABLE 24 Asia Pacific Power Banks Market, by Sales Channel, 2016-2028 (US$ Bn)
TABLE 25 Asia Pacific Power Banks Market, by Country/Region, 2016-2028 (US$ Bn)
TABLE 26 Latin America Power Banks Market, by Type, 2016-2028 (US$ Bn)
TABLE 27 Latin America Power Banks Market, by Application, 2016-2028 (US$ Bn)
TABLE 28 Latin America Power Banks Market, by Unit of USB Port, 2016-2028 (US$ Bn)
TABLE 29 Latin America Power Banks Market, by Consumer, 2016-2028 (US$ Bn)
TABLE 30 Latin America Power Banks Market, by Sales Channel, 2016-2028 (US$ Bn)
TABLE 31 Latin America Power Banks Market, by Country/Region, 2016-2028 (US$ Bn)
TABLE 32 Middle East Power Banks Market, by Type, 2016-2028 (US$ Bn)
TABLE 33 Middle East Power Banks Market, by Application, 2016-2028 (US$ Bn)
TABLE 34 Middle East Power Banks Market, by Unit of USB Port, 2016-2028 (US$ Bn)
TABLE 35 Middle East Power Banks Market, by Consumer, 2016-2028 (US$ Bn)
TABLE 36 Middle East Power Banks Market, by Sales Channel, 2016-2028 (US$ Bn)
TABLE 37 Middle East Power Banks Market, by Country/Region, 2016-2028 (US$ Bn)
TABLE 38 Africa Power Banks Market, by Type, 2016-2028 (US$ Bn)
TABLE 39 Africa Power Banks Market, by Application, 2016-2028 (US$ Bn)
TABLE 40 Africa Power Banks Market, by Unit of USB Port, 2016-2028 (US$ Bn)
TABLE 41 Africa Power Banks Market, by Consumer, 2016-2028 (US$ Bn)
TABLE 42 Africa Power Banks Market, by Sales Channel, 2016-2028 (US$ Bn)
TABLE 43 Africa Power Banks Market, by Country/Region, 2016-2028 (US$ Bn)

Frequently Asked Questions

How COVID-19 Impacted the global Power Banks Market?

The recent COVID-19 pandemic has caused a slowing of growth. As a result of COVID-19, the expected growth of power banks across applications is expected to slow, as the pandemic restricts supply chain and adoption owing to major disruptions to enterprises and the global economy. This has had a significant impact on the semiconductor supply chain, resulting in shortages of resources, components, and completed items. As a result, the market suffers as a result.

Which is the leading market for Power Banks?

In the forecast period, the Asia Pacific region will lead the global market. Power bank use in the region is increasing due to the region’s growing population, large-scale digitization, inexpensive power banks, and e-commerce penetration in the electronics sector.

What are the key drivers for the growth of the Power Banks Market?

A considerable transition toward 3G and 4G networks, expanding popularity of digital content, and increasing computing capability of devices are driving the industry’s growth. Along with this, rising smartphone demand and falling power bank prices are some of the major factors affecting market growth.

Which is the major segment in Power Banks Market by Capacity?

During the forecast period, the 10,001–15,000 mAh sector of the power bank market is predicted to develop at the fastest rate.

Which is the major segment in Power Banks Market by Application?

Smartphones represent a significant application market for power banks. The excessive usage of data and internet services on smartphones is one of the key reasons that contribute to battery life draining quickly. This increases the demand for power banks.

Powered Smart Card Market

Published:
Report ID: 54797

US Data Center Power Management Market

Published:
Report ID: 53470

Power Management ICs Market

Published:
Report ID: 53380

India Data Center Power Management Market

Published:
Report ID: 53088

Japan Data Center Power Management Market

Published:
Report ID: 53129

South Korea Data Center Power Management Market

Published:
Report ID: 53208

Mexico data center power management market

Published:
Report ID: 53157

Germany Data Center Power Management Market

Published:
Report ID: 53069

Canada Data Center Power Management Market

Published:
Report ID: 53045

Last Mile Delivery Market

Published:
Report ID: 55144

India Data Center Cooling Market

Published:
Report ID: 55136

Property Tax Services Market

Published:
Report ID: 55053

Record Keeping System Market

Published:
Report ID: 55052

Enterprise A2P SMS Market

Published:
Report ID: 55083

System Integration Market

Published:
Report ID: 55070

Canada Data Center Cooling Market

Published:
Report ID: 55060

Voice Recognition Market

Published:
Report ID: 11775

Virtual Reality Gaming Accessories Market

Published:
Report ID: 11344

Threat Intelligence Market

Published:
Report ID: 11264

Micro Data Centers Market

Published:
Report ID: 8160

Internet of Things (IoT) Security Market

Published:
Report ID: 7010

Purchase Options

The report comes as a view-only PDF document, optimized for individual clients. This version is recommended for personal digital use and does not allow printing.
$3699

To meet the needs of modern corporate teams, our report comes in two formats: a printable PDF and a data-rich Excel sheet. This package is optimized for internal analysis and multi-location access, making it an excellent choice for organizations with distributed workforce.
$4699

The report will be delivered in printable PDF format along with the report’s data Excel sheet. This license offers 100 Free Analyst hours where the client can utilize Credence Research Inc.’s research team. It is highly recommended for organizations seeking to execute short, customized research projects related to the scope of the purchased report.
$6699

Smallform of Sample request

Have a question?

User Profile

Don’t settle for less – trust Mitul to help you find the best solution.

Report delivery within 24 to 48 hours

– Other Info –

What people say?-

User Review

I am very impressed with the information in this report. The author clearly did their research when they came up with this product and it has already given me a lot of ideas.

Jana Schmidt
CEDAR CX Technologies

– Connect with us –

Phone

+91 6232 49 3207


support

24/7 Research Support


sales@credenceresearch.com

– Research Methodology –

Going beyond the basics: advanced techniques in research methodology

– Trusted By –

Pepshi, LG, Nestle
Motorola, Honeywell, Johnson and johnson
LG Chem, SIEMENS, Pfizer
Unilever, Samsonite, QIAGEN