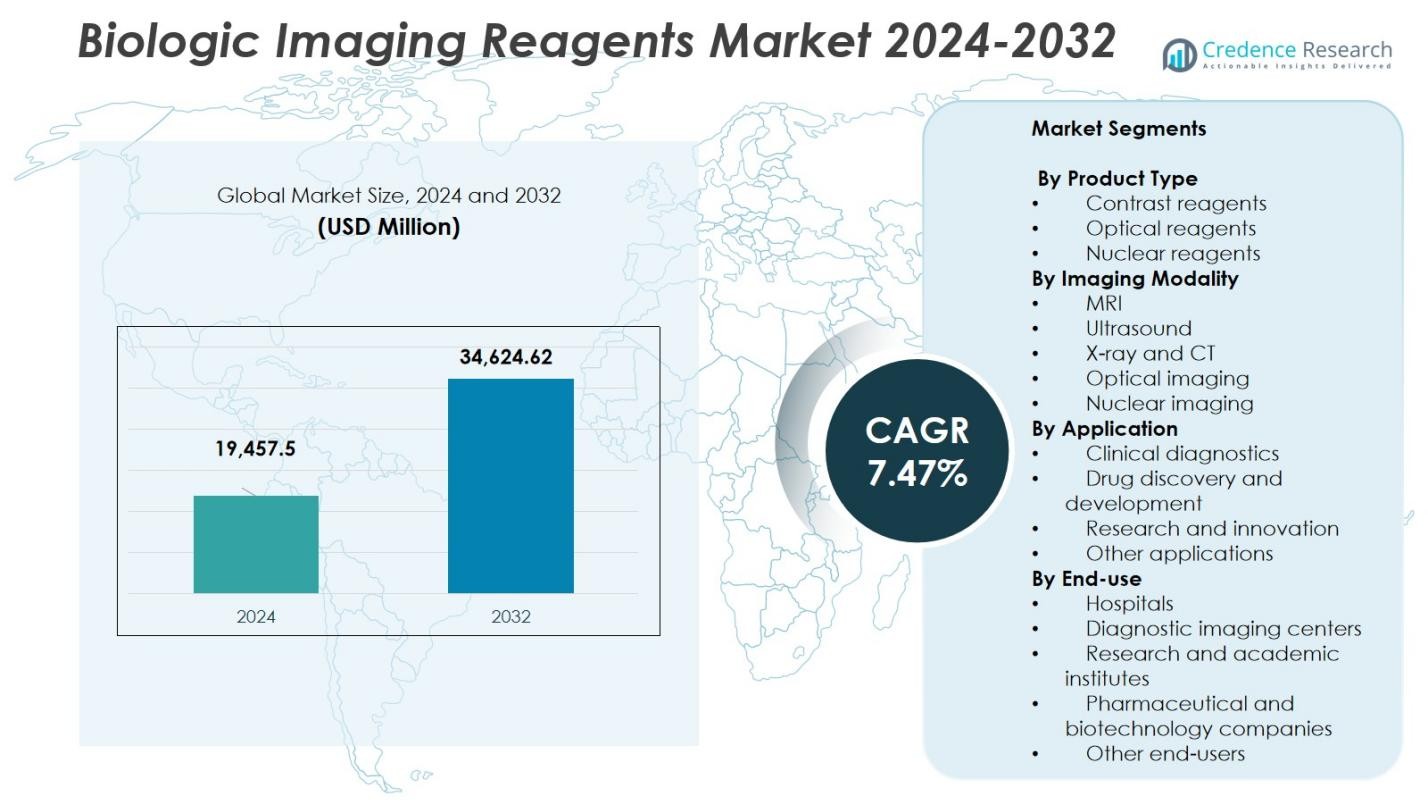
Home » Biotechnology » Biologic Imaging Reagents Market

Biologic Imaging Reagents Market By Class (Contrast Reagents, Optical Reagents, Nuclear Reagents) By Modality (MRI, Ultrasound, X-ray & CT, Nuclear)-Growth, Future Prospects & Competitive Analysis, 2016 – 2030

Price: $4999

Published: | Report ID: 20714 | Report Format : PDF

Actionable Insights Delivered – Biologic Imaging Reagents Market Size

Positioned with a USD 16.5 billion valuation in 2022, the Biologic Imaging Reagents Market asserted its global eminence. Set to scale to USD 29.59 billion by 2030, the market’s remarkable Compound Annual Growth Rate (CAGR) of 8.70% (2022-2030) underscores its strategic growth trajectory.

Key Highlights of the Report

The global biologic imaging reagents market is segmented by class, modality, application, end user, and region. The contrast reagents class holds the largest market share, driven by their versatility and widespread application across various imaging modalities. Optical imaging emerges as the dominant modality segment, characterized by its non-invasive nature and ability to provide high-resolution images for precise visualization. In terms of applications, in-vivo imaging takes the lead due to the growing demand for real-time visualization of biological processes within living organisms. Imaging centers claim the largest share of end users, closely followed by diagnostic laboratories.

The biologic imaging reagents market is driven by advancements in imaging technologies, increasing demand for personalized medicine, growing research activities in life sciences, and the rising prevalence of chronic diseases. However, challenges like the high cost of imaging reagents, stringent regulatory requirements, limited reimbursement policies, and ethical concerns about certain imaging agents hinder market expansion.

Nonetheless, the global biologic imaging reagents market presents promising opportunities, including developing novel imaging reagents tailored to emerging imaging modalities, collaborations between industry and academia to drive innovation, and expanding market penetration in the Asia-Pacific region.

Design Element 2

Access crucial information at unmatched prices!

Request your free sample report today & start making informed decisions powered by Credence Research!

Download Free Sample
CTA Design Element 3

What Are The Main Drivers Of The Global Biologic Imaging Reagents Market?

The development of imaging technologies, the expansion of life sciences research, the demand for personalised medicine, and the increasing prevalence of chronic diseases that call for efficient imaging and diagnostic methods are the primary factors driving the global biologic imaging reagents market.

What Are The Major Challenges The Global Biologic Imaging Reagents Market Faces?

The major challenges faced by the global biologic imaging reagents market include the high cost of imaging reagents, stringent regulatory requirements, limited reimbursement policies, and ethical concerns related to certain imaging agents.

What Are The Growth Opportunities In The Global Biologic Imaging Reagents Market?

The global biologic imaging reagents market presents significant growth opportunities, including the increasing demand for personalized medicine and customized diagnostics, advancements in imaging technologies, expanding drug discovery and development applications, and new imaging modalities. Besides, the growing focus on R&D activities, particularly in emerging markets, and developing innovative and non-toxic imaging reagents further contribute to the market’s growth potential.

Executive Summary

Overview of the Global Biologic Imaging Reagents Market

The global biologic imaging reagents market is a dynamic and rapidly evolving segment within the biotechnology and life sciences industry. Advancements in research, drug development, and medical diagnostics are made possible by the use of biologic imaging reagents, which play a crucial part in visualising and characterising biological processes at the cellular and molecular levels. These tools are crucial for understanding the pathophysiology of diseases, assessing the effectiveness of treatments, and tracking therapeutic outcomes. The market for biologic imaging reagents is fueled by the rising incidence of chronic illnesses, rising spending on R&D, and rising consumer desire for personalised medication.

Market Definition

Biologic imaging reagents refer to a diverse range of specialized substances and agents used in various imaging modalities, including optical, nuclear, magnetic resonance imaging (MRI), ultrasound, and others. These reagents enable researchers and healthcare professionals to visualize and study specific targets within living organisms, providing vital information for understanding disease pathways, identifying biomarkers, and developing targeted therapies. Biologic imaging reagents encompass various contrast agents, fluorescent dyes and probes, nanoparticles, radiopharmaceuticals, and other molecular imaging agents. Each category of reagent serves a distinct purpose and offers unique advantages for specific imaging applications.

Biologic Imaging Reagents Market

Market Insights

  • The global demand for biologic imaging reagents was valued at USD 16.5 Billion in 2022 and is expected to reach USD 29.59 Billion in 2030, growing at a CAGR of 8.70% between 2023 and 2030.
  • Contrast reagents hold the majority market share, accounting for over 39% in 2022, while optical reagents are expected to exhibit the fastest growth rate.
  • Optical imaging is the dominant modality segment, capturing a significant share of over 32% in 2022, and is projected to maintain a higher CAGR.
  • In vivo applications lead the market, accounting for 55% of the global market in 2022.
  • Imaging centers are the largest end-user segment, holding a share of over 34% of the global market in 2022.
  • North America is the leading market, capturing over 44% of the market share in 2022, while the Asia-Pacific region exhibits substantial growth potential.
  • Technological advancements, such as enhanced specificity and sensitivity of imaging reagents, are driving market growth and enabling the development of customized imaging solutions.
  • The market is shifting towards non-toxic and biocompatible imaging reagents to address safety concerns and improve patient outcomes.

Segmentation by Class

  • The contrast reagents segment held the largest market share of over 39% in 2022.
  • The optical reagents segment is witnessing rapid growth and is expected to gain significant market traction in the coming years.

Segmentation by Modality

  • The optical imaging segment dominated the market in 2022, capturing over 32% of the revenue.
  • The MRI segment is projected to experience high growth.

Segmentation by Application

  • The in vitro segment is projected to achieve the highest CAGR in the forecast period.
  • In 2022, the in vivo segment held the largest market share, accounting for over 55% of the global revenue.

Segmentation by End User

  • The imaging centers segment dominated the market in 2022, contributing over 34% of the revenue.
  • The diagnostic laboratories segment is expected to grow substantially.

Segmentation by Region

  • North America held the largest market share in 2022, capturing 44% of the total revenue.
  • Europe is a significant market for biologic imaging reagents, contributing significantly to the overall market share.
  • The Asia-Pacific region is witnessing rapid adoption of biologic imaging reagents.
  • The rest of the world, including the Middle East, Latin America, and Africa, is swiftly adopting biologic imaging reagent solutions.

The global biologic imaging reagents market is driven by advancements in imaging technologies, growing demand for personalized medicine, increasing research activities in life sciences, and the rising prevalence of chronic diseases. However, the market faces challenges such as the high cost of imaging reagents, stringent regulatory requirements, limited reimbursement policies, and ethical concerns related to certain imaging agents.

The United States is a major global biologic imaging reagents market hub. It has a robust pharmaceutical and biotechnology industry, supported by advanced research infrastructure and substantial healthcare and life sciences investments. The U.S. is at the forefront of technological advancements in imaging and is home to renowned academic institutions, research centers, and industry leaders. With a strong emphasis on research & development, the country drives innovation in biological imaging reagents. The high prevalence of chronic diseases and the demand for personalized medicine contribute to the significant adoption of biologic imaging reagents in the U.S.

China has emerged as a key market for biologic imaging reagents. The country’s rapid economic growth and increasing healthcare expenditure have fueled advancements in the life sciences sector. China’s expanding biotechnology industry and growing research capabilities have created a substantial demand for biologic imaging reagents. The government’s initiatives to promote scientific research and collaborations with international partners have further bolstered China’s position in the market.

Advancements in Imaging Technologies

Advancements in imaging technologies play a major role in driving the biologic imaging reagents market. Continuous innovations in imaging modalities, such as optical, nuclear, and molecular imaging, enable high-resolution visualization of biological processes. These advancements offer enhanced sensitivity, specificity, and multiplexing capabilities, facilitating the development of novel biologic imaging reagents. The integration of imaging technologies with artificial intelligence (AI) and machine learning (ML) further enhances their diagnostic and therapeutic potential, driving the demand for compatible imaging reagents.

Growing Demand for Personalized Medicine

The increasing demand for personalized medicine is a significant driver in the biologic imaging reagents market. Personalized medicine focuses on customizing treatments for individual patients based on their unique characteristics, including genetic makeup, disease subtype, and treatment response. Biologic imaging reagents play a crucial role in personalized medicine by enabling precise visualization and characterization of specific molecular targets. They aid in identifying biomarkers, evaluating therapeutic efficacy, and selecting optimal treatment strategies, propelling the adoption of biologic imaging reagents in personalized medicine.

High Cost of Imaging Reagents

One of the major restraints in the biologic imaging reagents market is the high cost associated with imaging reagents. Developing and manufacturing high-quality imaging reagents involves complex processes and specialized materials, leading to higher production costs. These costs are passed on to end-users, making imaging reagents expensive for researchers, healthcare institutions, and diagnostic centers. The high cost can limit the widespread adoption of biologic imaging reagents, particularly in resource-constrained settings and regions with limited healthcare budgets.

Emerging Imaging Modalities and Technologies

The emergence of novel imaging modalities and technologies presents promising opportunities in the biologic imaging reagents market. Technologies such as molecular imaging, multimodal imaging, and hybrid imaging are gaining traction due to their ability to provide comprehensive and complementary information. These new modalities require specialized imaging reagents tailored to their unique imaging principles. Developing reagents specifically designed for these emerging imaging technologies opens market expansion and differentiation avenues. Moreover, integrating imaging technologies with AI and ML algorithms presents opportunities for developing intelligent imaging reagents with enhanced capabilities and diagnostic accuracy.

Competitive Landscape

Key Players

The global biologic imaging reagents market exhibits a competitive landscape with numerous players vying for market share. Some of the leading players in the global market and their market share are as follows:

  • Thermo Fisher Scientific
  • PerkinElmer Inc
  • Guerbet
  • Beckman Coulter Inc
  • Bracco Diagnostic Inc
  • Bayer
  • FUJIFILM VisualSonics Inc
  • General Electric
  • Cardinal Health
  • Koninklijke Philips N.V.
  • Siemens
  • Advanced Proteome
  • Promega Corporation

These companies in the market focus on R&D operations to introduce innovative and advanced imaging reagents. Key strategies employed by market participants include collaborations, partnerships, mergers & acquisitions, and product launches to expand their product portfolios and strengthen their market presence.

Moreover, investments in manufacturing capabilities, distribution networks, and regulatory compliance are undertaken to meet the increasing demand for biologic imaging reagents. Additionally, companies emphasize establishing strategic alliances with academic institutions and research organizations to foster technological advancements and gain a competitive edge.

For instance, PerkinElmer reported its purchase of Cisbio Bioassays, a renowned custom assay service provider, in April 2019. The acquisition of Cisbio strengthens PerkinElmer’s presence in the life sciences and diagnostics markets.

In July 2019, Bayer AG gained FDA approval for Gadavist (gadobutrol) injection in the United States for use in cardiac magnetic resonance (MR) imaging to measure myocardial perfusion (stress, rest).

In August 2019, Bracco S.p.A. received US FDA approval for Varibar ® Thin Liquid (barium sulfate) for oral suspension to detect and assess the type and severity of swallowing disorders.

Shape Your Report to Specific Countries or Regions & Enjoy 30% Off!

Summary of Key Findings

  • The global biologic imaging reagents market is witnessing a surge in demand due to the growing adoption of advanced imaging technologies such as optical, nuclear, and molecular imaging.
  • Market segmented by class, modality, application, end user, and region.
  • The increasing adoption of hybrid imaging systems, such as PET-CT and PET-MRI, is driving the need for multimodal imaging reagents that can provide complementary information from different imaging modalities.
  • North America and Europe dominate the global market due to their well-established research infrastructure and favorable government initiatives.
  • The high cost of imaging reagents, stringent regulatory requirements, and limited reimbursement policies limit market growth.

Future Outlook

  • Increasing investments in research & development activities by pharmaceutical and biotechnology companies are driving the demand for biologic imaging reagents.
  • Asia Pacific is expected to grow fastest owing to rising healthcare expenditure, increasing research capabilities, and a large patient population.
  • The rising focus on molecular diagnostics and precision medicine is creating a significant demand for targeted imaging reagents that can accurately detect and characterize specific molecular markers.
  • Advancements in molecular imaging techniques, such as optical coherence tomography (OCT) and positron emission tomography (PET), are expanding the applications of biologic imaging reagents in areas like ophthalmology, cardiology, and oncology.

Segmentation

  • By Class
    • Contrast Reagents
    • Optical Reagents
    • Nuclear Reagents
  • By Modality
    • MRI
    • Ultrasound
    • X-ray & CT
    • Nuclear
    • Optical Imaging
    • Others
  • By Application
    • In Vitro
    • In Vivo
  • By End User
    • Diagnostic Laboratories
    • Imaging Centres
    • Life Science Companies
    • Research & Academic Institutes
    • Others
  • By Region
  • North America
    • The U.S.
    • Canada
    • Mexico
  • Europe
    • Germany
    • France
    • The U.K.
    • Italy
    • Spain
    • Rest of Europe
  • Asia Pacific
    • China
    • Japan
    • India
    • South Korea
    • South-east Asia
    • Rest of Asia Pacific
  • Latin America
    • Brazil
    • Argentina
    • Rest of Latin America
  • Middle East & Africa
    • GCC Countries
    • South Africa
    • Rest of the Middle East and Africa

1. Preface
1.1. Report Description
1.1.1. Purpose of the Report
1.1.2. Target Audience
1.1.3. USP and Key Offerings
1.2. Research Scope
1.3. Research Methodology
1.3.1. Phase I – Secondary Research
1.3.2. Phase II – Data Modelling
1.3.2.1. Company Share Analysis Model
1.3.2.2. Revenue-Based Modelling
1.3.3. Phase III – Primary Research
1.3.4. Research Limitations
1.3.5. Assumptions
1.4. Market Introduction
1.5. Market Research Scope

2. Executive Summary
2.1. Market Snapshot: Global Biologic Imaging Reagents Market
2.2. Global Biologic Imaging Reagents Market, By Class
2.3. Global Biologic Imaging Reagents Market, By Application
2.4. Global Biologic Imaging Reagents Market, By Modality
2.5. Global Biologic Imaging Reagents Market, By End User
2.6. Global Biologic Imaging Reagents Market, By Region

3. Market Dynamics & Factors Analysis
3.1. Introduction
3.1.1. Global Biologic Imaging Reagents Market Value, 2017-2030, (US$ Bn)
3.1.2. Y-o-Y Growth Trend Analysis
3.2. Market Dynamics
3.2.1. Market Drivers
3.2.2. Market Restraints
3.2.3. Market Opportunities
3.2.4. Major Industry Challenges
3.3. Growth and Development Patterns
3.4. Investment Feasibility Analysis
3.5. Market Opportunity Analysis
3.5.1. Class
3.5.2. Application
3.5.3. Modality
3.5.4. End User
3.5.5. Geography

4. Premium Insights
4.1. STAR (Situation, Task, Action, Results) Analysis
4.2. Porter’s Five Forces Analysis
4.2.1. Threat of New Entrants
4.2.2. Bargaining Power of Buyers/Consumers
4.2.3. Bargaining Power of Suppliers
4.2.4. Threat of Substitute Types
4.2.5. Intensity of Competitive Rivalry
4.3. Key Market Trends
4.3.1. Demand Side Trends
4.3.2. Supply Side Trends
4.4. Value Chain Analysis
4.5. Technology Analysis
4.6. Analysis and Recommendations
4.7. Marketing Strategy Analysis
4.7.1. Direct Marketing
4.7.2. Indirect Marketing
4.7.3. Marketing Channel Development Trend

5. Market Positioning of Key Players, 2022
5.1. Company Market Share of Key Players, 2022
5.2. Competitive Benchmarking
5.3. Market Positioning of Key Vendors
5.4. Geographical Presence Analysis
5.5. Major Strategies Adopted by Key Players
5.5.1. Key Strategies Analysis
5.5.2. Mergers and Acquisitions
5.5.3. Partnerships
5.5.4. Product Launch
5.5.5. Geographical Expansion
5.5.6. Others

6. Economic Impact Analysis
6.1. Recession Impact
6.1.1. North America
6.1.2. Europe
6.1.3. Asia Pacific
6.1.4. Latin America
6.1.5. Middle East and Africa
6.2. Ukraine-Russia War Impact
6.2.1. North America
6.2.2. Europe
6.2.3. Asia Pacific
6.2.4. Latin America
6.2.5. Middle East and Africa
6.3. COVID-19 Impact Analysis
6.3.1. North America
6.3.2. Europe
6.3.3. Asia Pacific
6.3.4. Latin America
6.3.5. Middle East and Africa

7. Global Biologic Imaging Reagents Market, By Class
7.1. Global Biologic Imaging Reagents Market Overview, by Class
7.1.1. Global Biologic Imaging Reagents Market Revenue Share, By Class, 2022 Vs 2030 (in %)
7.2. Contrast Reagents
7.2.1. Global Biologic Imaging Reagents Market, By Region, 2017-2030 (US$ Bn)
7.3. Optical Reagents
7.3.1. Global Biologic Imaging Reagents Market, By Region, 2017-2030 (US$ Bn)
7.4. Nuclear Reagents
7.4.1. Global Biologic Imaging Reagents Market, By Region, 2017-2030 (US$ Bn)

8. Global Biologic Imaging Reagents Market, By Application
8.1. Global Biologic Imaging Reagents Market Overview, by Application
8.1.1. Global Biologic Imaging Reagents Market, By Application, 2022 vs 2030 (in %)
8.2. In Vivo
8.2.1. Global Biologic Imaging Reagents Market, By Region, 2017-2030 (US$ Bn)
8.3. In Vitro
8.3.1. Global Biologic Imaging Reagents Market, By Region, 2017-2030 (US$ Bn)

9. Global Biologic Imaging Reagents Market, by Modality, 2017-2030 (US$ Bn)
9.1. Global Biologic Imaging Reagents Market Overview, by Modality
9.1.1. Global Biologic Imaging Reagents Market, By Modality, 2022 vs 2030 (in%)
9.2. MRI
9.2.1. Global Biologic Imaging Reagents Market, By Region, 2017-2030 (US$ Bn)
9.3. Ultrasound
9.3.1. Global Biologic Imaging Reagents Market, By Region, 2017-2030 (US$ Bn)
9.4. X-ray & CT
9.4.1. Global Biologic Imaging Reagents Market, By Region, 2017-2030 (US$ Bn)
9.5. Nuclear
9.5.1. Global Biologic Imaging Reagents Market, By Region, 2017-2030 (US$ Bn)
9.6. Optical Imaging
9.6.1. Global Biologic Imaging Reagents Market, By Region, 2017-2030 (US$ Bn)
9.7. Others
9.7.1. Global Biologic Imaging Reagents Market, By Region, 2017-2030 (US$ Bn)

10. Global Biologic Imaging Reagents Market, by End User, 2017-2030 (US$ Bn)
10.1. Global Biologic Imaging Reagents Market Overview, by End User
10.1.1. Global Biologic Imaging Reagents Market, By End User, 2022 vs 2030 (in%)
10.2. Diagnostic Laboratories
10.2.1. Global Biologic Imaging Reagents Market, By Region, 2017-2030 (US$ Bn)
10.3. Imaging Centres
10.3.1. Global Biologic Imaging Reagents Market, By Region, 2017-2030 (US$ Bn)
10.4. Life Science Companies
10.4.1. Global Biologic Imaging Reagents Market, By Region, 2017-2030 (US$ Bn)
10.5. Research & Academic Institutes
10.5.1. Global Biologic Imaging Reagents Market, By Region, 2017-2030 (US$ Bn)
10.6. Others
10.6.1. Global Biologic Imaging Reagents Market, By Region, 2017-2030 (US$ Bn)

11. Global Biologic Imaging Reagents Market, By Region
11.1. Global Biologic Imaging Reagents Market Overview, by Region
11.1.1. Global Biologic Imaging Reagents Market, By Region, 2022 vs 2030 (in%)
11.2. Class
11.2.1. Global Biologic Imaging Reagents Market, By Class, 2017-2030 (US$ Bn)
11.3. Application
11.3.1. Global Biologic Imaging Reagents Market, By Application, 2017-2030 (US$ Bn)
11.4. Modality
11.4.1. Global Biologic Imaging Reagents Market, By Modality, 2017-2030 (US$ Bn)
11.5. End User
11.5.1. Global Biologic Imaging Reagents Market, By End User, 2017-2030 (US$ Bn)

12. North America Biologic Imaging Reagents Market Analysis
12.1. North America Biologic Imaging Reagents Market, by Class, 2017-2030(US$ Bn)
12.1.1. Overview
12.1.2. SRC Analysis
12.2. North America Biologic Imaging Reagents Market, by Application, 2017-2030(US$ Bn)
12.2.1. Overview
12.2.2. SRC Analysis
12.3. North America Biologic Imaging Reagents Market, by Modality, 2017-2030(US$ Bn)
12.3.1. Overview
12.3.2. SRC Analysis
12.4. North America Biologic Imaging Reagents Market, by End User, 2017-2030(US$ Bn)
12.4.1. Overview
12.4.2. SRC Analysis
12.5. North America Biologic Imaging Reagents Market, by Country, 2017-2030 (US$ Bn)
12.5.1. North America Biologic Imaging Reagents Market, by Country, 2022 Vs 2030 (in%)
12.5.2. U.S.
12.5.2.1. U.S. Biologic Imaging Reagents Market Estimates and Forecast, 2017-2030 (US$ Bn)
12.5.2.2. U.S. Biologic Imaging Reagents, By Class, 2017-2030 (US$ Bn)
12.5.2.3. U.S. Biologic Imaging Reagents, By Application, 2017-2030 (US$ Bn)
12.5.2.4. U.S. Biologic Imaging Reagents, By Modality, 2017-2030 (US$ Bn)
12.5.2.5. U.S. Biologic Imaging Reagents, By End User, 2017-2030 (US$ Bn)
12.5.3. Canada
12.5.3.1. Canada Biologic Imaging Reagents Market Estimates and Forecast, 2017-2030 (US$ Bn)
12.5.3.2. Canada Biologic Imaging Reagents, By Class, 2017-2030 (US$ Bn)
12.5.3.3. Canada Biologic Imaging Reagents, By Application, 2017-2030 (US$ Bn)
12.5.3.4. Canada Biologic Imaging Reagents, By Modality, 2017-2030 (US$ Bn)
12.5.3.5. Canada Biologic Imaging Reagents, By End User, 2017-2030 (US$ Bn)
12.5.4. Mexico
12.5.4.1. Mexico Biologic Imaging Reagents Market Estimates and Forecast, 2017-2030 (US$ Bn)
12.5.4.2. Mexico Biologic Imaging Reagents, By Class, 2017-2030 (US$ Bn)
12.5.4.3. Mexico Biologic Imaging Reagents, By Application, 2017-2030 (US$ Bn)
12.5.4.4. Mexico Biologic Imaging Reagents, By Modality, 2017-2030 (US$ Bn)
12.5.4.5. Mexico Biologic Imaging Reagents, By End User, 2017-2030 (US$ Bn)

13. Europe Biologic Imaging Reagents Market Analysis
13.1. Europe Biologic Imaging Reagents Market, by Class, 2017-2030(US$ Bn)
13.1.1. Overview
13.1.2. SRC Analysis
13.2. Europe Biologic Imaging Reagents Market, by Application, 2017-2030(US$ Bn)
13.2.1. Overview
13.2.2. SRC Analysis
13.3. Europe Biologic Imaging Reagents Market, by Modality, 2017-2030(US$ Bn)
13.3.1. Overview
13.3.2. SRC Analysis
13.4. Europe Biologic Imaging Reagents Market, by End User, 2017-2030(US$ Bn)
13.4.1. Overview
13.4.2. SRC Analysis
13.5. Europe Biologic Imaging Reagents Market, by Country, 2017-2030 (US$ Bn)
13.5.1. Europe Biologic Imaging Reagents Market, by Country, 2022 Vs 2030 (in%)
13.5.2. Germany
13.5.2.1. Germany Biologic Imaging Reagents Market Estimates and Forecast, 2017-2030 (US$ Bn)
13.5.2.2. Germany Biologic Imaging Reagents, By Class, 2017-2030 (US$ Bn)
13.5.2.3. Germany Biologic Imaging Reagents, By Application, 2017-2030 (US$ Bn)
13.5.2.4. Germany Biologic Imaging Reagents, By Modality, 2017-2030 (US$ Bn)
13.5.2.5. Germany Biologic Imaging Reagents, By End User, 2017-2030 (US$ Bn)
13.5.3. France
13.5.3.1. France Biologic Imaging Reagents Market Estimates and Forecast, 2017-2030 (US$ Bn)
13.5.3.2. France Biologic Imaging Reagents, By Class, 2017-2030 (US$ Bn)
13.5.3.3. France Biologic Imaging Reagents, By Application, 2017-2030 (US$ Bn)
13.5.3.4. France Biologic Imaging Reagents, By Modality, 2017-2030 (US$ Bn)
13.5.3.5. France Biologic Imaging Reagents, By End User, 2017-2030 (US$ Bn)
13.5.4. UK
13.5.4.1. UK Biologic Imaging Reagents Market Estimates and Forecast, 2017-2030 (US$ Bn)
13.5.4.2. UK Biologic Imaging Reagents, By Class, 2017-2030 (US$ Bn)
13.5.4.3. UK Biologic Imaging Reagents, By Application, 2017-2030 (US$ Bn)
13.5.4.4. UK Biologic Imaging Reagents, By Modality, 2017-2030 (US$ Bn)
13.5.4.5. UK Biologic Imaging Reagents, By End User, 2017-2030 (US$ Bn)
13.5.5. Italy
13.5.5.1. Italy Biologic Imaging Reagents Market Estimates and Forecast, 2017-2030 (US$ Bn)
13.5.5.2. Italy Biologic Imaging Reagents, By Class, 2017-2030 (US$ Bn)
13.5.5.3. Italy Biologic Imaging Reagents, By Application, 2017-2030 (US$ Bn)
13.5.5.4. Italy Biologic Imaging Reagents, By Modality, 2017-2030 (US$ Bn)
13.5.5.5. Italy Biologic Imaging Reagents, By End User, 2017-2030 (US$ Bn)
13.5.6. Spain
13.5.6.1. Spain Biologic Imaging Reagents Market Estimates and Forecast, 2017-2030 (US$ Bn)
13.5.6.2. Spain Biologic Imaging Reagents, By Class, 2017-2030 (US$ Bn)
13.5.6.3. Spain Biologic Imaging Reagents, By Application, 2017-2030 (US$ Bn)
13.5.6.4. Spain Biologic Imaging Reagents, By Modality, 2017-2030 (US$ Bn)
13.5.6.5. Spain Biologic Imaging Reagents, By End User, 2017-2030 (US$ Bn)
13.5.7. Rest of Europe
13.5.7.1. Rest of Europe Biologic Imaging Reagents Market Estimates and Forecast, 2017-2030 (US$ Bn)
13.5.7.2. Rest of Europe Biologic Imaging Reagents, By Class, 2017-2030 (US$ Bn)
13.5.7.3. Rest of Europe Biologic Imaging Reagents, By Application, 2017-2030 (US$ Bn)
13.5.7.4. Rest of Europe Biologic Imaging Reagents, By Modality, 2017-2030 (US$ Bn)
13.5.7.5. Rest of Europe Biologic Imaging Reagents, By End User, 2017-2030 (US$ Bn)

14. Asia Pacific Biologic Imaging Reagents Market Analysis
14.1. Asia Pacific Biologic Imaging Reagents Market, by Class, 2017-2030(US$ Bn)
14.1.1. Overview
14.1.2. SRC Analysis
14.2. Asia Pacific Biologic Imaging Reagents Market, by Application, 2017-2030(US$ Bn)
14.2.1. Overview
14.2.2. SRC Analysis
14.3. Asia Pacific Biologic Imaging Reagents Market, by Modality, 2017-2030(US$ Bn)
14.3.1. Overview
14.3.2. SRC Analysis
14.4. Asia Pacific Biologic Imaging Reagents Market, by End User, 2017-2030(US$ Bn)
14.4.1. Overview
14.4.2. SRC Analysis
14.5. Asia Pacific Biologic Imaging Reagents Market, by Country, 2017-2030 (US$ Bn)
14.5.1. Asia Pacific Biologic Imaging Reagents Market, by Country, 2022 Vs 2030 (in%)
14.5.2. China
14.5.2.1. China Biologic Imaging Reagents Market Estimates and Forecast, 2017-2030 (US$ Bn)
14.5.2.2. China Biologic Imaging Reagents, By Class, 2017-2030 (US$ Bn)
14.5.2.3. China Biologic Imaging Reagents, By Application, 2017-2030 (US$ Bn)
14.5.2.4. China Biologic Imaging Reagents, By Modality, 2017-2030 (US$ Bn)
14.5.2.5. China Biologic Imaging Reagents, By End User, 2017-2030 (US$ Bn)
14.5.3. Japan
14.5.3.1. Japan Biologic Imaging Reagents Market Estimates and Forecast, 2017-2030 (US$ Bn)
14.5.3.2. Japan Biologic Imaging Reagents, By Class, 2017-2030 (US$ Bn)
14.5.3.3. Japan Biologic Imaging Reagents, By Application, 2017-2030 (US$ Bn)
14.5.3.4. Japan Biologic Imaging Reagents, By Modality, 2017-2030 (US$ Bn)
14.5.3.5. Japan Biologic Imaging Reagents, By End User, 2017-2030 (US$ Bn)
14.5.4. India
14.5.4.1. India Biologic Imaging Reagents Market Estimates and Forecast, 2017-2030 (US$ Bn)
14.5.4.2. India Biologic Imaging Reagents, By Class, 2017-2030 (US$ Bn)
14.5.4.3. India Biologic Imaging Reagents, By Application, 2017-2030 (US$ Bn)
14.5.4.4. India Biologic Imaging Reagents, By Modality, 2017-2030 (US$ Bn)
14.5.4.5. India Biologic Imaging Reagents, By End User, 2017-2030 (US$ Bn)
14.5.5. South Korea
14.5.5.1. South Korea Biologic Imaging Reagents Market Estimates and Forecast, 2017-2030 (US$ Bn)
14.5.5.2. South Korea Biologic Imaging Reagents, By Class, 2017-2030 (US$ Bn)
14.5.5.3. South Korea Biologic Imaging Reagents, By Application, 2017-2030 (US$ Bn)
14.5.5.4. South Korea Biologic Imaging Reagents, By Modality, 2017-2030 (US$ Bn)
14.5.5.5. South Korea Biologic Imaging Reagents, By End User, 2017-2030 (US$ Bn)
14.5.6. South-East Asia
14.5.6.1. South-East Asia Biologic Imaging Reagents Market Estimates and Forecast, 2017-2030 (US$ Bn)
14.5.6.2. South-East Asia Biologic Imaging Reagents, By Class, 2017-2030 (US$ Bn)
14.5.6.3. South-East Asia Biologic Imaging Reagents, By Application, 2017-2030 (US$ Bn)
14.5.6.4. South-East Asia Biologic Imaging Reagents, By Modality, 2017-2030 (US$ Bn)
14.5.6.5. South-East Asia Biologic Imaging Reagents, By End User, 2017-2030 (US$ Bn)
14.5.7. Rest of Asia Pacific
14.5.7.1. Rest of Asia Pacific Biologic Imaging Reagents Market Estimates and Forecast, 2017-2030 (US$ Bn)
14.5.7.2. Rest of Asia Pacific Biologic Imaging Reagents, By Class, 2017-2030 (US$ Bn)
14.5.7.3. Rest of Asia Pacific Biologic Imaging Reagents, By Application, 2017-2030 (US$ Bn)
14.5.7.4. Rest of Asia Pacific Biologic Imaging Reagents, By Modality, 2017-2030 (US$ Bn)
14.5.7.5. Rest of Asia Pacific Biologic Imaging Reagents, By End User, 2017-2030 (US$ Bn)

15. Latin America Biologic Imaging Reagents Market Analysis
15.1. Latin America Biologic Imaging Reagents Market, by Class, 2017-2030(US$ Bn)
15.1.1. Overview
15.1.2. SRC Analysis
15.2. Latin America Biologic Imaging Reagents Market, by Application, 2017-2030(US$ Bn)
15.2.1. Overview
15.2.2. SRC Analysis
15.3. Latin America Biologic Imaging Reagents Market, by Modality, 2017-2030(US$ Bn)
15.3.1. Overview
15.3.2. SRC Analysis
15.4. Latin America Biologic Imaging Reagents Market, by End User, 2017-2030(US$ Bn)
15.4.1. Overview
15.4.2. SRC Analysis
15.5. Latin America Biologic Imaging Reagents Market, by Country, 2017-2030 (US$ Bn)
15.5.1. Latin America Biologic Imaging Reagents Market, by Country, 2022 Vs 2030 (in%)
15.5.2. Brazil
15.5.2.1. Brazil Biologic Imaging Reagents Market Estimates and Forecast, 2017-2030 (US$ Bn)
15.5.2.2. Brazil Biologic Imaging Reagents, By Class, 2017-2030 (US$ Bn)
15.5.2.3. Brazil Biologic Imaging Reagents, By Application, 2017-2030 (US$ Bn)
15.5.2.4. Brazil Biologic Imaging Reagents, By Modality, 2017-2030 (US$ Bn)
15.5.2.5. Brazil Biologic Imaging Reagents, By End User, 2017-2030 (US$ Bn)
15.5.3. Argentina
15.5.3.1. Argentina Biologic Imaging Reagents Market Estimates and Forecast, 2017-2030 (US$ Bn)
15.5.3.2. Argentina Biologic Imaging Reagents, By Class, 2017-2030 (US$ Bn)
15.5.3.3. Argentina Biologic Imaging Reagents, By Application, 2017-2030 (US$ Bn)
15.5.3.4. Argentina Biologic Imaging Reagents, By Modality, 2017-2030 (US$ Bn)
15.5.3.5. Argentina Biologic Imaging Reagents, By End User, 2017-2030 (US$ Bn)
15.5.4. Rest of Latin America
15.5.4.1. Rest of Latin America Biologic Imaging Reagents Market Estimates and Forecast, 2017-2030 (US$ Bn)
15.5.4.2. Rest of Latin America Biologic Imaging Reagents, By Class, 2017-2030 (US$ Bn)
15.5.4.3. Rest of Latin America Biologic Imaging Reagents, By Application, 2017-2030 (US$ Bn)
15.5.4.4. Rest of Latin America Biologic Imaging Reagents, By Modality, 2017-2030 (US$ Bn)
15.5.4.5. Rest of Latin America Biologic Imaging Reagents, By End User, 2017-2030 (US$ Bn)

16. Middle East and Africa Biologic Imaging Reagents Market Analysis
16.1. Middle East and Africa Biologic Imaging Reagents Market, by Class, 2017-2030(US$ Bn)
16.1.1. Overview
16.1.2. SRC Analysis
16.2. Middle East and Africa Biologic Imaging Reagents Market, by Application, 2017-2030(US$ Bn)
16.2.1. Overview
16.2.2. SRC Analysis
16.3. Middle East and Africa Biologic Imaging Reagents Market, by Modality, 2017-2030(US$ Bn)
16.3.1. Overview
16.3.2. SRC Analysis
16.4. Middle East and Africa Biologic Imaging Reagents Market, by End User, 2017-2030(US$ Bn)
16.4.1. Overview
16.4.2. SRC Analysis
16.5. Middle East and Africa Biologic Imaging Reagents Market, by Country, 2017-2030 (US$ Bn)
16.5.1. Middle East and Africa Biologic Imaging Reagents Market, by Country, 2022 Vs 2030 (in%)
16.5.2. GCC Countries
16.5.2.1. GCC Countries Biologic Imaging Reagents Market Estimates and Forecast, 2017-2030 (US$ Bn)
16.5.2.2. GCC Countries Biologic Imaging Reagents, By Class, 2017-2030 (US$ Bn)
16.5.2.3. GCC Countries Biologic Imaging Reagents, By Application, 2017-2030 (US$ Bn)
16.5.2.4. GCC Countries Biologic Imaging Reagents, By Modality, 2017-2030 (US$ Bn)
16.5.2.5. GCC Countries Biologic Imaging Reagents, By End User, 2017-2030 (US$ Bn)
16.5.3. South Africa
16.5.3.1. South Africa Biologic Imaging Reagents Market Estimates and Forecast, 2017-2030 (US$ Bn)
16.5.3.2. South Africa Biologic Imaging Reagents, By Class, 2017-2030 (US$ Bn)
16.5.3.3. South Africa Biologic Imaging Reagents, By Application, 2017-2030 (US$ Bn)
16.5.3.4. South Africa Biologic Imaging Reagents, By Modality, 2017-2030 (US$ Bn)
16.5.3.5. South Africa Biologic Imaging Reagents, By End User, 2017-2030 (US$ Bn)
16.5.4. Rest of Middle East and Africa
16.5.4.1. Rest of Middle East and Africa Biologic Imaging Reagents Market Estimates and Forecast, 2017-2030 (US$ Bn)
16.5.4.2. Rest of Middle East and Africa Biologic Imaging Reagents, By Class, 2017-2030 (US$ Bn)
16.5.4.3. Rest of Middle East and Africa Biologic Imaging Reagents, By Application, 2017-2030 (US$ Bn)
16.5.4.4. Rest of Middle East and Africa Biologic Imaging Reagents, By Modality, 2017-2030 (US$ Bn)
16.5.4.5. Rest of Middle East and Africa Biologic Imaging Reagents, By End User, 2017-2030 (US$ Bn)

17. Company Profiles
17.1. Thermo Fisher Scientific
17.1.1. Company Overview
17.1.2. Products/Services Portfolio
17.1.3. Geographical Presence
17.1.4. Financial Summary
17.1.4.1. Market Revenue and Net Profit (2019-2022)
17.1.4.2. Business Segment Revenue Analysis
17.1.4.3. Geographical Revenue Analysis
17.2. PerkinElmer Inc
17.3. Guerbet
17.4. Beckman Coulter Inc
17.5. Bracco Diagnostic Inc
17.6. Bayer
17.7. FUJIFILM VisualSonics Inc
17.8. General Electric
17.9. Cardinal Health
17.10. Koninklijke Philips N.V.
17.11. Siemens
17.12. Advanced Proteome
17.13. Promega Corporation

List of Figures
FIG. 1 Global Biologic Imaging Reagents Market: Research Methodology
FIG. 2 Market Size Estimation – Top Down & Bottom Up Approach
FIG. 3 Global Biologic Imaging Reagents Market Segmentation
FIG. 4 Global Biologic Imaging Reagents Market, by Class, 2022 (US$ Bn)
FIG. 5 Global Biologic Imaging Reagents Market, by Application, 2022 (US$ Bn)
FIG. 6 Global Biologic Imaging Reagents Market, by Modality, 2022 (US$ Bn)
FIG. 7 Global Biologic Imaging Reagents Market, by End User, 2022 (US$ Bn)
FIG. 8 Global Biologic Imaging Reagents Market, by Geography, 2022 (US$ Bn)
FIG. 9 Attractive Investment Proposition, by Class, 2022
FIG. 10 Attractive Investment Proposition, by Application, 2022
FIG. 11 Attractive Investment Proposition, by Modality, 2022
FIG. 12 Attractive Investment Proposition, by End User, 2022
FIG. 13 Attractive Investment Proposition, by Geography, 2022
FIG. 14 Global Market Share Analysis of Key Biologic Imaging Reagents Market Manufacturers, 2022
FIG. 15 Global Market Positioning of Key Biologic Imaging Reagents Market Manufacturers, 2022
FIG. 16 Global Biologic Imaging Reagents Market Value Contribution, By Class, 2022 & 2030 (Value %)
FIG. 17 Global Biologic Imaging Reagents Market, by Contrast Reagents, Value, 2017-2030 (US$ Bn)
FIG. 18 Global Biologic Imaging Reagents Market, by Optical Reagents, Value, 2017-2030 (US$ Bn)
FIG. 19 Global Biologic Imaging Reagents Market, by Nuclear Reagents, Value, 2017-2030 (US$ Bn)
FIG. 20 Global Biologic Imaging Reagents Market Value Contribution, By Application, 2022 & 2030 (Value %)
FIG. 21 Global Biologic Imaging Reagents Market, by In Vitro, 2017-2030 (US$ Bn)
FIG. 22 Global Biologic Imaging Reagents Market, by In Vivo, Value, 2017-2030 (US$ Bn)
FIG. 23 Global Biologic Imaging Reagents Market Value Contribution, By Modality, 2022 & 2030 (Value %)
FIG. 24 Global Biologic Imaging Reagents Market, by MRI, Value, 2017-2030 (US$ Bn)
FIG. 25 Global Biologic Imaging Reagents Market, by Ultrasound, 2017-2030 (US$ Bn)
FIG. 26 Global Biologic Imaging Reagents Market, by X-ray & CT, 2017-2030 (US$ Bn)
FIG. 27 Global Biologic Imaging Reagents Market, by Nuclear, 2017-2030 (US$ Bn)
FIG. 28 Global Biologic Imaging Reagents Market, by Optical Imaging, 2017-2030 (US$ Bn)
FIG. 29 Global Biologic Imaging Reagents Market, by Others, 2017-2030 (US$ Bn)
FIG. 30 Global Biologic Imaging Reagents Market Value Contribution, By End User, 2022 & 2030 (Value %)
FIG. 31 Global Biologic Imaging Reagents Market, by Diagnostic Laboratories, Value, 2017-2030 (US$ Bn)
FIG. 32 Global Biologic Imaging Reagents Market, by Imaging Centres, 2017-2030 (US$ Bn)
FIG. 33 Global Biologic Imaging Reagents Market, by Life Science Companies, 2017-2030 (US$ Bn)
FIG. 34 Global Biologic Imaging Reagents Market, by Research & Academic Institutes, 2017-2030 (US$ Bn)
FIG. 35 Global Biologic Imaging Reagents Market, by Others, 2017-2030 (US$ Bn)
FIG. 36 North America Biologic Imaging Reagents Market, 2017-2030 (US$ Bn)
FIG. 37 U.S. Biologic Imaging Reagents Market, 2017-2030 (US$ Bn)
FIG. 38 Canada Biologic Imaging Reagents Market, 2017-2030 (US$ Bn)
FIG. 39 Europe Biologic Imaging Reagents Market, 2017-2030 (US$ Bn)
FIG. 40 Germany Biologic Imaging Reagents Market, 2017-2030 (US$ Bn)
FIG. 41 France Biologic Imaging Reagents Market, 2017-2030 (US$ Bn)
FIG. 42 U.K. Biologic Imaging Reagents Market, 2017-2030 (US$ Bn)
FIG. 43 Italy Biologic Imaging Reagents Market, 2017-2030 (US$ Bn)
FIG. 44 Spain Biologic Imaging Reagents Market, 2017-2030 (US$ Bn)
FIG. 45 Rest of Europe Biologic Imaging Reagents Market, 2017-2030 (US$ Bn)
FIG. 46 Asia Pacific Biologic Imaging Reagents Market, 2017-2030 (US$ Bn)
FIG. 47 China Biologic Imaging Reagents Market, 2017-2030 (US$ Bn)
FIG. 48 Japan Biologic Imaging Reagents Market, 2017-2030 (US$ Bn)
FIG. 49 India Biologic Imaging Reagents Market, 2017-2030 (US$ Bn)
FIG. 50 South Korea Biologic Imaging Reagents Market, 2017-2030 (US$ Bn)
FIG. 51 South-East Asia Biologic Imaging Reagents Market, 2017-2030 (US$ Bn)
FIG. 52 Rest of Asia Pacific Biologic Imaging Reagents Market, 2017-2030 (US$ Bn)
FIG. 53 Latin America Biologic Imaging Reagents Market, 2017-2030 (US$ Bn)
FIG. 54 Brazil Biologic Imaging Reagents Market, 2017-2030 (US$ Bn)
FIG. 55 Mexico Biologic Imaging Reagents Market, 2017-2030 (US$ Bn)
FIG. 56 Rest of Latin America Biologic Imaging Reagents Market, 2017-2030 (US$ Bn)
FIG. 57 Middle East & Africa Biologic Imaging Reagents Market, 2017-2030 (US$ Bn)
FIG. 58 GCC Countries Biologic Imaging Reagents Market, 2017-2030 (US$ Bn)
FIG. 59 South Africa Biologic Imaging Reagents Market, 2017-2030 (US$ Bn)
FIG. 60 Rest of Middle East and Africa Biologic Imaging Reagents Market, 2017-2030 (US$ Bn)

List of Tables
TABLE 1 Market Snapshot: Global Biologic Imaging Reagents Market
TABLE 2 Global Biologic Imaging Reagents Market: Market Drivers Impact Analysis
TABLE 3 Global Biologic Imaging Reagents Market: Market Restraints Impact Analysis
TABLE 4 Global Biologic Imaging Reagents Market, by Competitive Benchmarking, 2022
TABLE 5 Global Biologic Imaging Reagents Market, by Geographical Presence Analysis, 2022
TABLE 6 Global Biologic Imaging Reagents Market, by Key Strategies Analysis, 2022
TABLE 7 Global Biologic Imaging Reagents Market, by Contrast Reagents, By Region, 2017-2022 (US$ Bn)
TABLE 8 Global Biologic Imaging Reagents Market, by Contrast Reagents, By Region, 2023-2030 (US$ Bn)
TABLE 9 Global Biologic Imaging Reagents Market, by Optical Reagents, By Region, 2017-2022 (US$ Bn)
TABLE 10 Global Biologic Imaging Reagents Market, by Optical Reagents, By Region, 2023-2030 (US$ Bn)
TABLE 11 Global Biologic Imaging Reagents Market, by Nuclear Reagents, By Region, 2017-2022 (US$ Bn)
TABLE 12 Global Biologic Imaging Reagents Market, by Nuclear Reagents, By Region, 2023-2030 (US$ Bn)
TABLE 13 Global Biologic Imaging Reagents Market, by In Vitro, By Region, 2017-2022 (US$ Bn)
TABLE 14 Global Biologic Imaging Reagents Market, by In Vitro, By Region, 2023-2030 (US$ Bn)
TABLE 15 Global Biologic Imaging Reagents Market, by In Vivo, By Region, 2017-2022 (US$ Bn)
TABLE 16 Global Biologic Imaging Reagents Market, by In Vivo, By Region, 2023-2030 (US$ Bn)
TABLE 17 Global Biologic Imaging Reagents Market, by MRI, By Region, 2017-2022 (US$ Bn)
TABLE 18 Global Biologic Imaging Reagents Market, by MRI, By Region, 2023-2030 (US$ Bn)
TABLE 19 Global Biologic Imaging Reagents Market, by Ultrasound, By Region, 2017-2022 (US$ Bn)
TABLE 20 Global Biologic Imaging Reagents Market, by Ultrasound, By Region, 2023-2030 (US$ Bn)
TABLE 21 Global Biologic Imaging Reagents Market, by X-ray & CT, By Region, 2017-2022 (US$ Bn)
TABLE 22 Global Biologic Imaging Reagents Market, by X-ray & CT, By Region, 2023-2030 (US$ Bn)
TABLE 23 Global Biologic Imaging Reagents Market, by Nuclear, By Region, 2017-2022 (US$ Bn)
TABLE 24 Global Biologic Imaging Reagents Market, by Nuclear, By Region, 2023-2030 (US$ Bn)
TABLE 25 Global Biologic Imaging Reagents Market, by Optical Imaging, By Region, 2017-2022 (US$ Bn)
TABLE 26 Global Biologic Imaging Reagents Market, by Optical Imaging, By Region, 2023-2030 (US$ Bn)
TABLE 27 Global Biologic Imaging Reagents Market, by Others, By Region, 2017-2022 (US$ Bn)
TABLE 28 Global Biologic Imaging Reagents Market, by Others, By Region, 2023-2030 (US$ Bn)
TABLE 29 Global Biologic Imaging Reagents Market, by Diagnostic Laboratories, By Region, 2017-2022 (US$ Bn)
TABLE 30 Global Biologic Imaging Reagents Market, by Diagnostic Laboratories, By Region, 2023-2030 (US$ Bn)
TABLE 31 Global Biologic Imaging Reagents Market, by Imaging Centres, By Region, 2017-2022 (US$ Bn)
TABLE 32 Global Biologic Imaging Reagents Market, by Imaging Centres, By Region, 2023-2030 (US$ Bn)
TABLE 33 Global Biologic Imaging Reagents Market, by Life Science Companies, By Region, 2017-2022 (US$ Bn)
TABLE 34 Global Biologic Imaging Reagents Market, by Life Science Companies, By Region, 2023-2030 (US$ Bn)
TABLE 35 Global Biologic Imaging Reagents Market, by Research & Academic Institutes, By Region, 2017-2022 (US$ Bn)
TABLE 36 Global Biologic Imaging Reagents Market, by Research & Academic Institutes, By Region, 2023-2030 (US$ Bn)
TABLE 37 Global Biologic Imaging Reagents Market, by Class, 2017-2022 (US$ Bn)
TABLE 38 Global Biologic Imaging Reagents Market, by Class, 2023-2030 (US$ Bn)
TABLE 39 Global Biologic Imaging Reagents Market, by Application, 2017-2022 (US$ Bn)
TABLE 40 Global Biologic Imaging Reagents Market, by Application, 2023-2030 (US$ Bn)
TABLE 41 Global Biologic Imaging Reagents Market, by Modality, 2017-2022 (US$ Bn)
TABLE 42 Global Biologic Imaging Reagents Market, by Modality, 2023-2030 (US$ Bn)
TABLE 43 Global Biologic Imaging Reagents Market, by End User, 2017-2022 (US$ Bn)
TABLE 44 Global Biologic Imaging Reagents Market, by End User, 2023-2030 (US$ Bn)
TABLE 45 Global Biologic Imaging Reagents Market, by Region, 2017-2022 (US$ Bn)
TABLE 46 Global Biologic Imaging Reagents Market, by Region, 2023-2030 (US$ Bn)
TABLE 47 North America Biologic Imaging Reagents Market, by Class, 2017-2022 (US$ Bn)
TABLE 48 North America Biologic Imaging Reagents Market, by Class, 2023-2030 (US$ Bn)
TABLE 49 North America Biologic Imaging Reagents Market, by Application, 2017-2022 (US$ Bn)
TABLE 50 North America Biologic Imaging Reagents Market, by Application, 2023-2030 (US$ Bn)
TABLE 51 North America Biologic Imaging Reagents Market, by Modality, 2017-2022 (US$ Bn)
TABLE 52 North America Biologic Imaging Reagents Market, by Modality, 2023-2030 (US$ Bn)
TABLE 53 North America Biologic Imaging Reagents Market, by End User, 2017-2022 (US$ Bn)
TABLE 54 North America Biologic Imaging Reagents Market, by End User, 2023-2030 (US$ Bn)
TABLE 55 North America Biologic Imaging Reagents Market, by Country, 2017-2022 (US$ Bn)
TABLE 56 North America Biologic Imaging Reagents Market, by Country, 2023-2030 (US$ Bn)
TABLE 57 United States Biologic Imaging Reagents Market, by Class, 2017-2022 (US$ Bn)
TABLE 58 United States Biologic Imaging Reagents Market, by Class, 2023-2030 (US$ Bn)
TABLE 59 United States Biologic Imaging Reagents Market, by Application, 2017-2022 (US$ Bn)
TABLE 60 United States Biologic Imaging Reagents Market, by Application, 2023-2030 (US$ Bn)
TABLE 61 United States Biologic Imaging Reagents Market, by Modality, 2017-2022 (US$ Bn)
TABLE 62 United States Biologic Imaging Reagents Market, by Modality, 2023-2030 (US$ Bn)
TABLE 63 United States Biologic Imaging Reagents Market, by End User, 2017-2022 (US$ Bn)
TABLE 64 United States Biologic Imaging Reagents Market, by End User, 2023-2030 (US$ Bn)
TABLE 65 Canada Biologic Imaging Reagents Market, by Class, 2017-2022 (US$ Bn)
TABLE 66 Canada Biologic Imaging Reagents Market, by Class, 2023-2030 (US$ Bn)
TABLE 67 Canada Biologic Imaging Reagents Market, by Application, 2017-2022 (US$ Bn)
TABLE 68 Canada Biologic Imaging Reagents Market, by Application, 2023-2030 (US$ Bn)
TABLE 69 Canada Biologic Imaging Reagents Market, by Modality, 2017-2022 (US$ Bn)
TABLE 70 Canada Biologic Imaging Reagents Market, by Modality, 2023-2030 (US$ Bn)
TABLE 71 Canada Biologic Imaging Reagents Market, by End User, 2017-2022 (US$ Bn)
TABLE 72 Canada Biologic Imaging Reagents Market, by End User, 2023-2030 (US$ Bn)
TABLE 73 Mexico Biologic Imaging Reagents Market, by Class, 2017-2022 (US$ Bn)
TABLE 74 Mexico Biologic Imaging Reagents Market, by Class, 2023-2030 (US$ Bn)
TABLE 75 Mexico Biologic Imaging Reagents Market, by Application, 2017-2022 (US$ Bn)
TABLE 76 Mexico Biologic Imaging Reagents Market, by Application, 2023-2030 (US$ Bn)
TABLE 77 Mexico Biologic Imaging Reagents Market, by Modality, 2017-2022 (US$ Bn)
TABLE 78 Mexico Biologic Imaging Reagents Market, by Modality, 2023-2030 (US$ Bn)
TABLE 79 Mexico Biologic Imaging Reagents Market, by End User, 2017-2022 (US$ Bn)
TABLE 80 Mexico Biologic Imaging Reagents Market, by End User, 2023-2030 (US$ Bn)
TABLE 81 Europe Biologic Imaging Reagents Market, by Class, 2017-2022 (US$ Bn)
TABLE 82 Europe Biologic Imaging Reagents Market, by Class, 2023-2030 (US$ Bn)
TABLE 83 Europe Biologic Imaging Reagents Market, by Application, 2017-2022 (US$ Bn)
TABLE 84 Europe Biologic Imaging Reagents Market, by Application, 2023-2030 (US$ Bn)
TABLE 85 Europe Biologic Imaging Reagents Market, by Modality, 2017-2022 (US$ Bn)
TABLE 86 Europe Biologic Imaging Reagents Market, by Modality, 2023-2030 (US$ Bn)
TABLE 87 Europe Biologic Imaging Reagents Market, by End User, 2017-2022 (US$ Bn)
TABLE 88 Europe Biologic Imaging Reagents Market, by End User, 2023-2030 (US$ Bn)
TABLE 89 Europe Biologic Imaging Reagents Market, by Country, 2017-2022 (US$ Bn)
TABLE 90 Europe Biologic Imaging Reagents Market, by Country, 2023-2030 (US$ Bn)
TABLE 91 Germany Biologic Imaging Reagents Market, by Class, 2017-2022 (US$ Bn)
TABLE 92 Germany Biologic Imaging Reagents Market, by Class, 2023-2030 (US$ Bn)
TABLE 93 Germany Biologic Imaging Reagents Market, by Application, 2017-2022 (US$ Bn)
TABLE 94 Germany Biologic Imaging Reagents Market, by Application, 2023-2030 (US$ Bn)
TABLE 95 Germany Biologic Imaging Reagents Market, by Modality, 2017-2022 (US$ Bn)
TABLE 96 Germany Biologic Imaging Reagents Market, by Modality, 2023-2030 (US$ Bn)
TABLE 97 Germany Biologic Imaging Reagents Market, by End User, 2017-2022 (US$ Bn)
TABLE 98 Germany Biologic Imaging Reagents Market, by End User, 2023-2030 (US$ Bn)
TABLE 99 France Biologic Imaging Reagents Market, by Class, 2017-2022 (US$ Bn)
TABLE 100 France Biologic Imaging Reagents Market, by Class, 2023-2030 (US$ Bn)
TABLE 101 France Biologic Imaging Reagents Market, by Application, 2017-2022 (US$ Bn)
TABLE 102 France Biologic Imaging Reagents Market, by Application, 2023-2030 (US$ Bn)
TABLE 103 France Biologic Imaging Reagents Market, by Modality, 2017-2022 (US$ Bn)
TABLE 104 France Biologic Imaging Reagents Market, by Modality, 2023-2030 (US$ Bn)
TABLE 105 France Biologic Imaging Reagents Market, by End User, 2017-2022 (US$ Bn)
TABLE 106 France Biologic Imaging Reagents Market, by End User, 2023-2030 (US$ Bn)
TABLE 107 United Kingdom Biologic Imaging Reagents Market, by Class, 2017-2022 (US$ Bn)
TABLE 108 United Kingdom Biologic Imaging Reagents Market, by Class, 2023-2030 (US$ Bn)
TABLE 109 United Kingdom Biologic Imaging Reagents Market, by Application, 2017-2022 (US$ Bn)
TABLE 110 United Kingdom Biologic Imaging Reagents Market, by Application, 2023-2030 (US$ Bn)
TABLE 111 United Kingdom Biologic Imaging Reagents Market, by Modality, 2017-2022 (US$ Bn)
TABLE 112 United Kingdom Biologic Imaging Reagents Market, by Modality, 2023-2030 (US$ Bn)
TABLE 113 United Kingdom Biologic Imaging Reagents Market, by End User, 2017-2022 (US$ Bn)
TABLE 114 United Kingdom Biologic Imaging Reagents Market, by End User, 2023-2030 (US$ Bn)
TABLE 115 Italy Biologic Imaging Reagents Market, by Class, 2017-2022 (US$ Bn)
TABLE 116 Italy Biologic Imaging Reagents Market, by Class, 2023-2030 (US$ Bn)
TABLE 117 Italy Biologic Imaging Reagents Market, by Application, 2017-2022 (US$ Bn)
TABLE 118 Italy Biologic Imaging Reagents Market, by Application, 2023-2030 (US$ Bn)
TABLE 119 Italy Biologic Imaging Reagents Market, by Modality, 2017-2022 (US$ Bn)
TABLE 120 Italy Biologic Imaging Reagents Market, by Modality, 2023-2030 (US$ Bn)
TABLE 121 Italy Biologic Imaging Reagents Market, by End User, 2017-2022 (US$ Bn)
TABLE 122 Italy Biologic Imaging Reagents Market, by End User, 2023-2030 (US$ Bn)
TABLE 123 Spain Biologic Imaging Reagents Market, by Class, 2017-2022 (US$ Bn)
TABLE 124 Spain Biologic Imaging Reagents Market, by Class, 2023-2030 (US$ Bn)
TABLE 125 Spain Biologic Imaging Reagents Market, by Application, 2017-2022 (US$ Bn)
TABLE 126 Spain Biologic Imaging Reagents Market, by Application, 2023-2030 (US$ Bn)
TABLE 127 Spain Biologic Imaging Reagents Market, by Modality, 2017-2022 (US$ Bn)
TABLE 128 Spain Biologic Imaging Reagents Market, by Modality, 2023-2030 (US$ Bn)
TABLE 129 Spain Biologic Imaging Reagents Market, by End User, 2017-2022 (US$ Bn)
TABLE 130 Spain Biologic Imaging Reagents Market, by End User, 2023-2030 (US$ Bn)
TABLE 131 Rest of Europe Biologic Imaging Reagents Market, by Class, 2017-2022 (US$ Bn)
TABLE 132 Rest of Europe Biologic Imaging Reagents Market, by Class, 2023-2030 (US$ Bn)
TABLE 133 Rest of Europe Biologic Imaging Reagents Market, by Application, 2017-2022 (US$ Bn)
TABLE 134 Rest of Europe Biologic Imaging Reagents Market, by Application, 2023-2030 (US$ Bn)
TABLE 135 Rest of Europe Biologic Imaging Reagents Market, by Modality, 2017-2022 (US$ Bn)
TABLE 136 Rest of Europe Biologic Imaging Reagents Market, by Modality, 2023-2030 (US$ Bn)
TABLE 137 Rest of Europe Biologic Imaging Reagents Market, by End User, 2017-2022 (US$ Bn)
TABLE 138 Rest of Europe Biologic Imaging Reagents Market, by End User, 2023-2030 (US$ Bn)
TABLE 139 Asia Pacific Biologic Imaging Reagents Market, by Class, 2017-2022 (US$ Bn)
TABLE 140 Asia Pacific Biologic Imaging Reagents Market, by Class, 2023-2030 (US$ Bn)
TABLE 141 Asia Pacific Biologic Imaging Reagents Market, by Application, 2017-2022 (US$ Bn)
TABLE 142 Asia Pacific Biologic Imaging Reagents Market, by Application, 2023-2030 (US$ Bn)
TABLE 143 Asia Pacific Biologic Imaging Reagents Market, by Modality, 2017-2022 (US$ Bn)
TABLE 144 Asia Pacific Biologic Imaging Reagents Market, by Modality, 2023-2030 (US$ Bn)
TABLE 145 Asia Pacific Biologic Imaging Reagents Market, by End User, 2017-2022 (US$ Bn)
TABLE 146 Asia Pacific Biologic Imaging Reagents Market, by End User, 2023-2030 (US$ Bn)
TABLE 147 China Biologic Imaging Reagents Market, by Class, 2017-2022 (US$ Bn)
TABLE 148 China Biologic Imaging Reagents Market, by Class, 2023-2030 (US$ Bn)
TABLE 149 China Biologic Imaging Reagents Market, by Application, 2017-2022 (US$ Bn)
TABLE 150 China Biologic Imaging Reagents Market, by Application, 2023-2030 (US$ Bn)
TABLE 151 China Biologic Imaging Reagents Market, by Modality, 2017-2022 (US$ Bn)
TABLE 152 China Biologic Imaging Reagents Market, by Modality, 2023-2030 (US$ Bn)
TABLE 153 China Biologic Imaging Reagents Market, by End User, 2017-2022 (US$ Bn)
TABLE 154 China Biologic Imaging Reagents Market, by End User, 2023-2030 (US$ Bn)
TABLE 155 Japan Biologic Imaging Reagents Market, by Class, 2017-2022 (US$ Bn)
TABLE 156 Japan Biologic Imaging Reagents Market, by Class, 2023-2030 (US$ Bn)
TABLE 157 Japan Biologic Imaging Reagents Market, by Application, 2017-2022 (US$ Bn)
TABLE 158 Japan Biologic Imaging Reagents Market, by Application, 2023-2030 (US$ Bn)
TABLE 159 Japan Biologic Imaging Reagents Market, by Modality, 2017-2022 (US$ Bn)
TABLE 160 Japan Biologic Imaging Reagents Market, by Modality, 2023-2030 (US$ Bn)
TABLE 161 Japan Biologic Imaging Reagents Market, by End User, 2017-2022 (US$ Bn)
TABLE 162 Japan Biologic Imaging Reagents Market, by End User, 2023-2030 (US$ Bn)
TABLE 163 India Biologic Imaging Reagents Market, by Class, 2017-2022 (US$ Bn)
TABLE 164 India Biologic Imaging Reagents Market, by Class, 2023-2030 (US$ Bn)
TABLE 165 India Biologic Imaging Reagents Market, by Application, 2017-2022 (US$ Bn)
TABLE 166 India Biologic Imaging Reagents Market, by Application, 2023-2030 (US$ Bn)
TABLE 167 India Biologic Imaging Reagents Market, by Modality, 2017-2022 (US$ Bn)
TABLE 168 India Biologic Imaging Reagents Market, by Modality, 2023-2030 (US$ Bn)
TABLE 169 India Biologic Imaging Reagents Market, by End User, 2017-2022 (US$ Bn)
TABLE 170 India Biologic Imaging Reagents Market, by End User, 2023-2030 (US$ Bn)
TABLE 171 South Korea Biologic Imaging Reagents Market, by Class, 2017-2022 (US$ Bn)
TABLE 172 South Korea Biologic Imaging Reagents Market, by Class, 2023-2030 (US$ Bn)
TABLE 173 South Korea Biologic Imaging Reagents Market, by Application, 2017-2022 (US$ Bn)
TABLE 174 South Korea Biologic Imaging Reagents Market, by Application, 2023-2030 (US$ Bn)
TABLE 175 South Korea Biologic Imaging Reagents Market, by Modality, 2017-2022 (US$ Bn)
TABLE 176 South Korea Biologic Imaging Reagents Market, by Modality, 2023-2030 (US$ Bn)
TABLE 177 South Korea Biologic Imaging Reagents Market, by End User, 2017-2022 (US$ Bn)
TABLE 178 South Korea Biologic Imaging Reagents Market, by End User, 2023-2030 (US$ Bn)
TABLE 179 South-East Asia Biologic Imaging Reagents Market, by Class, 2017-2022 (US$ Bn)
TABLE 180 South-East Asia Biologic Imaging Reagents Market, by Class, 2023-2030 (US$ Bn)
TABLE 181 South-East Asia Biologic Imaging Reagents Market, by Application, 2017-2022 (US$ Bn)
TABLE 182 South-East Asia Biologic Imaging Reagents Market, by Application, 2023-2030 (US$ Bn)
TABLE 183 South-East Asia Biologic Imaging Reagents Market, by Modality, 2017-2022 (US$ Bn)
TABLE 184 South-East Asia Biologic Imaging Reagents Market, by Modality, 2023-2030 (US$ Bn)
TABLE 185 South-East Asia Biologic Imaging Reagents Market, by End User, 2017-2022 (US$ Bn)
TABLE 186 South-East Asia Biologic Imaging Reagents Market, by End User, 2023-2030 (US$ Bn)
TABLE 187 Rest of Asia Pacific Biologic Imaging Reagents Market, by Class, 2017-2022 (US$ Bn)
TABLE 188 Rest of Asia Pacific Biologic Imaging Reagents Market, by Class, 2023-2030 (US$ Bn)
TABLE 189 Rest of Asia Pacific Biologic Imaging Reagents Market, by Application, 2017-2022 (US$ Bn)
TABLE 190 Rest of Asia Pacific Biologic Imaging Reagents Market, by Application, 2023-2030 (US$ Bn)
TABLE 191 Rest of Asia Pacific Biologic Imaging Reagents Market, by Modality, 2017-2022 (US$ Bn)
TABLE 192 Rest of Asia Pacific Biologic Imaging Reagents Market, by Modality, 2023-2030 (US$ Bn)
TABLE 193 Rest of Asia Pacific Biologic Imaging Reagents Market, by End User, 2017-2022 (US$ Bn)
TABLE 194 Rest of Asia Pacific Biologic Imaging Reagents Market, by End User, 2023-2030 (US$ Bn)
TABLE 195 Latin America Biologic Imaging Reagents Market, by Class, 2017-2022 (US$ Bn)
TABLE 196 Latin America Biologic Imaging Reagents Market, by Class, 2023-2030 (US$ Bn)
TABLE 197 Latin America Biologic Imaging Reagents Market, by Application, 2017-2022 (US$ Bn)
TABLE 198 Latin America Biologic Imaging Reagents Market, by Application, 2023-2030 (US$ Bn)
TABLE 199 Latin America Biologic Imaging Reagents Market, by Modality, 2017-2022 (US$ Bn)
TABLE 200 Latin America Biologic Imaging Reagents Market, by Modality, 2023-2030 (US$ Bn)
TABLE 201 Latin America Biologic Imaging Reagents Market, by End User, 2017-2022 (US$ Bn)
TABLE 202 Latin America Biologic Imaging Reagents Market, by End User, 2023-2030 (US$ Bn)
TABLE 203 Brazil Biologic Imaging Reagents Market, by Class, 2017-2022 (US$ Bn)
TABLE 204 Brazil Biologic Imaging Reagents Market, by Class, 2023-2030 (US$ Bn)
TABLE 205 Brazil Biologic Imaging Reagents Market, by Application, 2017-2022 (US$ Bn)
TABLE 206 Brazil Biologic Imaging Reagents Market, by Application, 2023-2030 (US$ Bn)
TABLE 207 Brazil Biologic Imaging Reagents Market, by Modality, 2017-2022 (US$ Bn)
TABLE 208 Brazil Biologic Imaging Reagents Market, by Modality, 2023-2030 (US$ Bn)
TABLE 209 Brazil Biologic Imaging Reagents Market, by End User, 2017-2022 (US$ Bn)
TABLE 210 Brazil Biologic Imaging Reagents Market, by End User, 2023-2030 (US$ Bn)
TABLE 211 Argentina Biologic Imaging Reagents Market, by Class, 2017-2022 (US$ Bn)
TABLE 212 Argentina Biologic Imaging Reagents Market, by Class, 2023-2030 (US$ Bn)
TABLE 213 Argentina Biologic Imaging Reagents Market, by Application, 2017-2022 (US$ Bn)
TABLE 214 Argentina Biologic Imaging Reagents Market, by Application, 2023-2030 (US$ Bn)
TABLE 215 Argentina Biologic Imaging Reagents Market, by Modality, 2017-2022 (US$ Bn)
TABLE 216 Argentina Biologic Imaging Reagents Market, by Modality, 2023-2030 (US$ Bn)
TABLE 217 Argentina Biologic Imaging Reagents Market, by End User, 2017-2022 (US$ Bn)
TABLE 218 Argentina Biologic Imaging Reagents Market, by End User, 2023-2030 (US$ Bn)
TABLE 219 Rest of Latin America Biologic Imaging Reagents Market, by Class, 2017-2022 (US$ Bn)
TABLE 220 Rest of Latin America Biologic Imaging Reagents Market, by Class, 2023-2030 (US$ Bn)
TABLE 221 Rest of Latin America Biologic Imaging Reagents Market, by Application, 2017-2022 (US$ Bn)
TABLE 222 Rest of Latin America Biologic Imaging Reagents Market, by Application, 2023-2030 (US$ Bn)
TABLE 223 Rest of Latin America Biologic Imaging Reagents Market, by Modality, 2017-2022 (US$ Bn)
TABLE 224 Rest of Latin America Biologic Imaging Reagents Market, by Modality, 2023-2030 (US$ Bn)
TABLE 225 Rest of Latin America Biologic Imaging Reagents Market, by End User, 2017-2022 (US$ Bn)
TABLE 226 Rest of Latin America Biologic Imaging Reagents Market, by End User, 2023-2030 (US$ Bn)
TABLE 227 Middle East and Africa Biologic Imaging Reagents Market, by Class, 2017-2022 (US$ Bn)
TABLE 228 Middle East and Africa Biologic Imaging Reagents Market, by Class, 2023-2030 (US$ Bn)
TABLE 229 Middle East and Africa Biologic Imaging Reagents Market, by Application, 2017-2022 (US$ Bn)
TABLE 230 Middle East and Africa Biologic Imaging Reagents Market, by Application, 2023-2030 (US$ Bn)
TABLE 231 Middle East and Africa Biologic Imaging Reagents Market, by Modality, 2017-2022 (US$ Bn)
TABLE 232 Middle East and Africa Biologic Imaging Reagents Market, by Modality, 2023-2030 (US$ Bn)
TABLE 233 Middle East and Africa Biologic Imaging Reagents Market, by End User, 2017-2022 (US$ Bn)
TABLE 234 Middle East and Africa Biologic Imaging Reagents Market, by End User, 2023-2030 (US$ Bn)
TABLE 235 GCC Countries Biologic Imaging Reagents Market, by Class, 2017-2022 (US$ Bn)
TABLE 236 GCC Countries Biologic Imaging Reagents Market, by Class, 2023-2030 (US$ Bn)
TABLE 237 GCC Countries Biologic Imaging Reagents Market, by Application, 2017-2022 (US$ Bn)
TABLE 238 GCC Countries Biologic Imaging Reagents Market, by Application, 2023-2030 (US$ Bn)
TABLE 239 GCC Countries Biologic Imaging Reagents Market, by Modality, 2017-2022 (US$ Bn)
TABLE 240 GCC Countries Biologic Imaging Reagents Market, by Modality, 2023-2030 (US$ Bn)
TABLE 241 GCC Countries Biologic Imaging Reagents Market, by End User, 2017-2022 (US$ Bn)
TABLE 242 GCC Countries Biologic Imaging Reagents Market, by End User, 2023-2030 (US$ Bn)
TABLE 243 South Africa Biologic Imaging Reagents Market, by Class, 2017-2022 (US$ Bn)
TABLE 244 South Africa Biologic Imaging Reagents Market, by Class, 2023-2030 (US$ Bn)
TABLE 245 South Africa Biologic Imaging Reagents Market, by Application, 2017-2022 (US$ Bn)
TABLE 246 South Africa Biologic Imaging Reagents Market, by Application, 2023-2030 (US$ Bn)
TABLE 247 South Africa Biologic Imaging Reagents Market, by Modality, 2017-2022 (US$ Bn)
TABLE 248 South Africa Biologic Imaging Reagents Market, by Modality, 2023-2030 (US$ Bn)
TABLE 249 South Africa Biologic Imaging Reagents Market, by End User, 2017-2022 (US$ Bn)
TABLE 250 South Africa Biologic Imaging Reagents Market, by End User, 2023-2030 (US$ Bn)
TABLE 251 Rest of Middle East and Africa Biologic Imaging Reagents Market, by Class, 2017-2022 (US$ Bn)
TABLE 252 Rest of Middle East and Africa Biologic Imaging Reagents Market, by Class, 2023-2030 (US$ Bn)
TABLE 253 Rest of Middle East and Africa Biologic Imaging Reagents Market, by Application, 2017-2022 (US$ Bn)
TABLE 254 Rest of Middle East and Africa Biologic Imaging Reagents Market, by Application, 2023-2030 (US$ Bn)
TABLE 255 Rest of Middle East and Africa Biologic Imaging Reagents Market, by Modality, 2017-2022 (US$ Bn)
TABLE 256 Rest of Middle East and Africa Biologic Imaging Reagents Market, by Modality, 2023-2030 (US$ Bn)
TABLE 257 Rest of Middle East and Africa Biologic Imaging Reagents Market, by End User, 2017-2022 (US$ Bn)
TABLE 258 Rest of Middle East and Africa Biologic Imaging Reagents Market, by End User, 2023-2030 (US$ Bn)

Frequently Asked Questions

What is the current size of the global biologic imaging reagents market?

The global biologic imaging reagents market was valued at USD 16.5 Billion in 2022.

What is the anticipated growth rate of the biologic imaging reagents market between 2023 and 2030?

The biologic imaging reagents market is anticipated to grow at a CAGR of 8.70% between 2023 and 2030, reaching USD 29.59 Billion in 2030.

Which segment is leading the market share in terms of class?

Contrast reagents are the leading segment by class, holding over 39% share in terms of value in 2022.

Which modality segment governs the global demand for biologic imaging reagents?

The optical imaging segment governs the demand for biologic imaging reagents worldwide, holding a massive share of over 32% in 2022.

Which application segment is estimated to post the highest CAGR during the forecast period?

The in vitro segment will post the highest CAGR in the projected period.

Which region is fuelling the growth of the biologic imaging reagents industry?

Asia Pacific is fuelling the rapid growth of the biologic imaging reagents industry, with an over one-third share in 2022.

Who are the major global biologic imaging reagents market players?

The top players include Thermo Fisher Scientific, Bracco Diagnostic Inc, Cardinal Health, and Siemens. Other major players include Bayer, FUJIFILM VisualSonics Inc, Koninklijke Philips N.V., and Promega Corporation.

What are the major market drivers of the biologic imaging reagents industry?

The major market drivers are the advancements in imaging technologies, emerging demands for personalized medicine, rising research activities in life sciences, and the growing prevalence of chronic diseases.

What are the major market restraints of the biologic imaging reagents industry?

The major market restraints are the high cost of imaging reagents, stringent regulatory requirements, limited reimbursement policies, and ethical concerns related to certain imaging agents.

What are the major market opportunities of the biologic imaging reagents industry?

The major market opportunities of the biologic imaging reagents industry lie in the expanding applications in drug discovery and development, emerging imaging modalities and technologies, and the potential for collaborations and partnerships to drive innovation and market growth.

Biotechnology Contract Manufacturing Market

Published:
Report ID: 36713

Cell Culture Media And Reagents Market

Published:
Report ID: 3489

Viral Antigens Market

Published:
Report ID: 36114

Recombinant Protein Market

Published:
Report ID: 35991

Bacteriophage Market

Published:
Report ID: 2114

India Bone Marrow Transplantation (BMT) Market

Published:
Report ID: 35571

Bioengineered Skin And Skin Substitutes Market

Published:
Report ID: 3472

DNA and RNA Sample Preparation Market

Published:
Report ID: 34911

Laboratory Filtration Market

Published:
Report ID: 7940

Adult Hemoglobinopathy Testing Market

Published:
Report ID: 34717

Nanobiotechnology Market

Published:
Report ID: 14350

Canine Stem Cell Therapy Market

Published:
Report ID: 34386

Purchase Options

$2999
Delivery Format: Excel.
$4999
Designed for the individual purchaser.
$6999
Users located at a single corporate site or regional office.
$7999
Allowed for unlimited sharing globally within one company.
Smallform of Sample request

Have a question?

User Profile

Don’t settle for less – trust Mitul to help you find the best solution.

Report delivery within 24 to 48 hours

– Other Info –

What people say?-

User Review

I am very impressed with the information in this report. The author clearly did their research when they came up with this product and it has already given me a lot of ideas.

Jana Schmidt
CEDAR CX Technologies

– Connect with us –

Phone

+91 6232 49 3207


support

24/7 Research Support


sales@credenceresearch.com

– Research Methodology –

Going beyond the basics: advanced techniques in research methodology

– Trusted By –

Pepshi, LG, Nestle
Motorola, Honeywell, Johnson and johnson
LG Chem, SIEMENS, Pfizer
Unilever, Samsonite, QIAGEN