
Packaging law and drop-in grades set the demand base
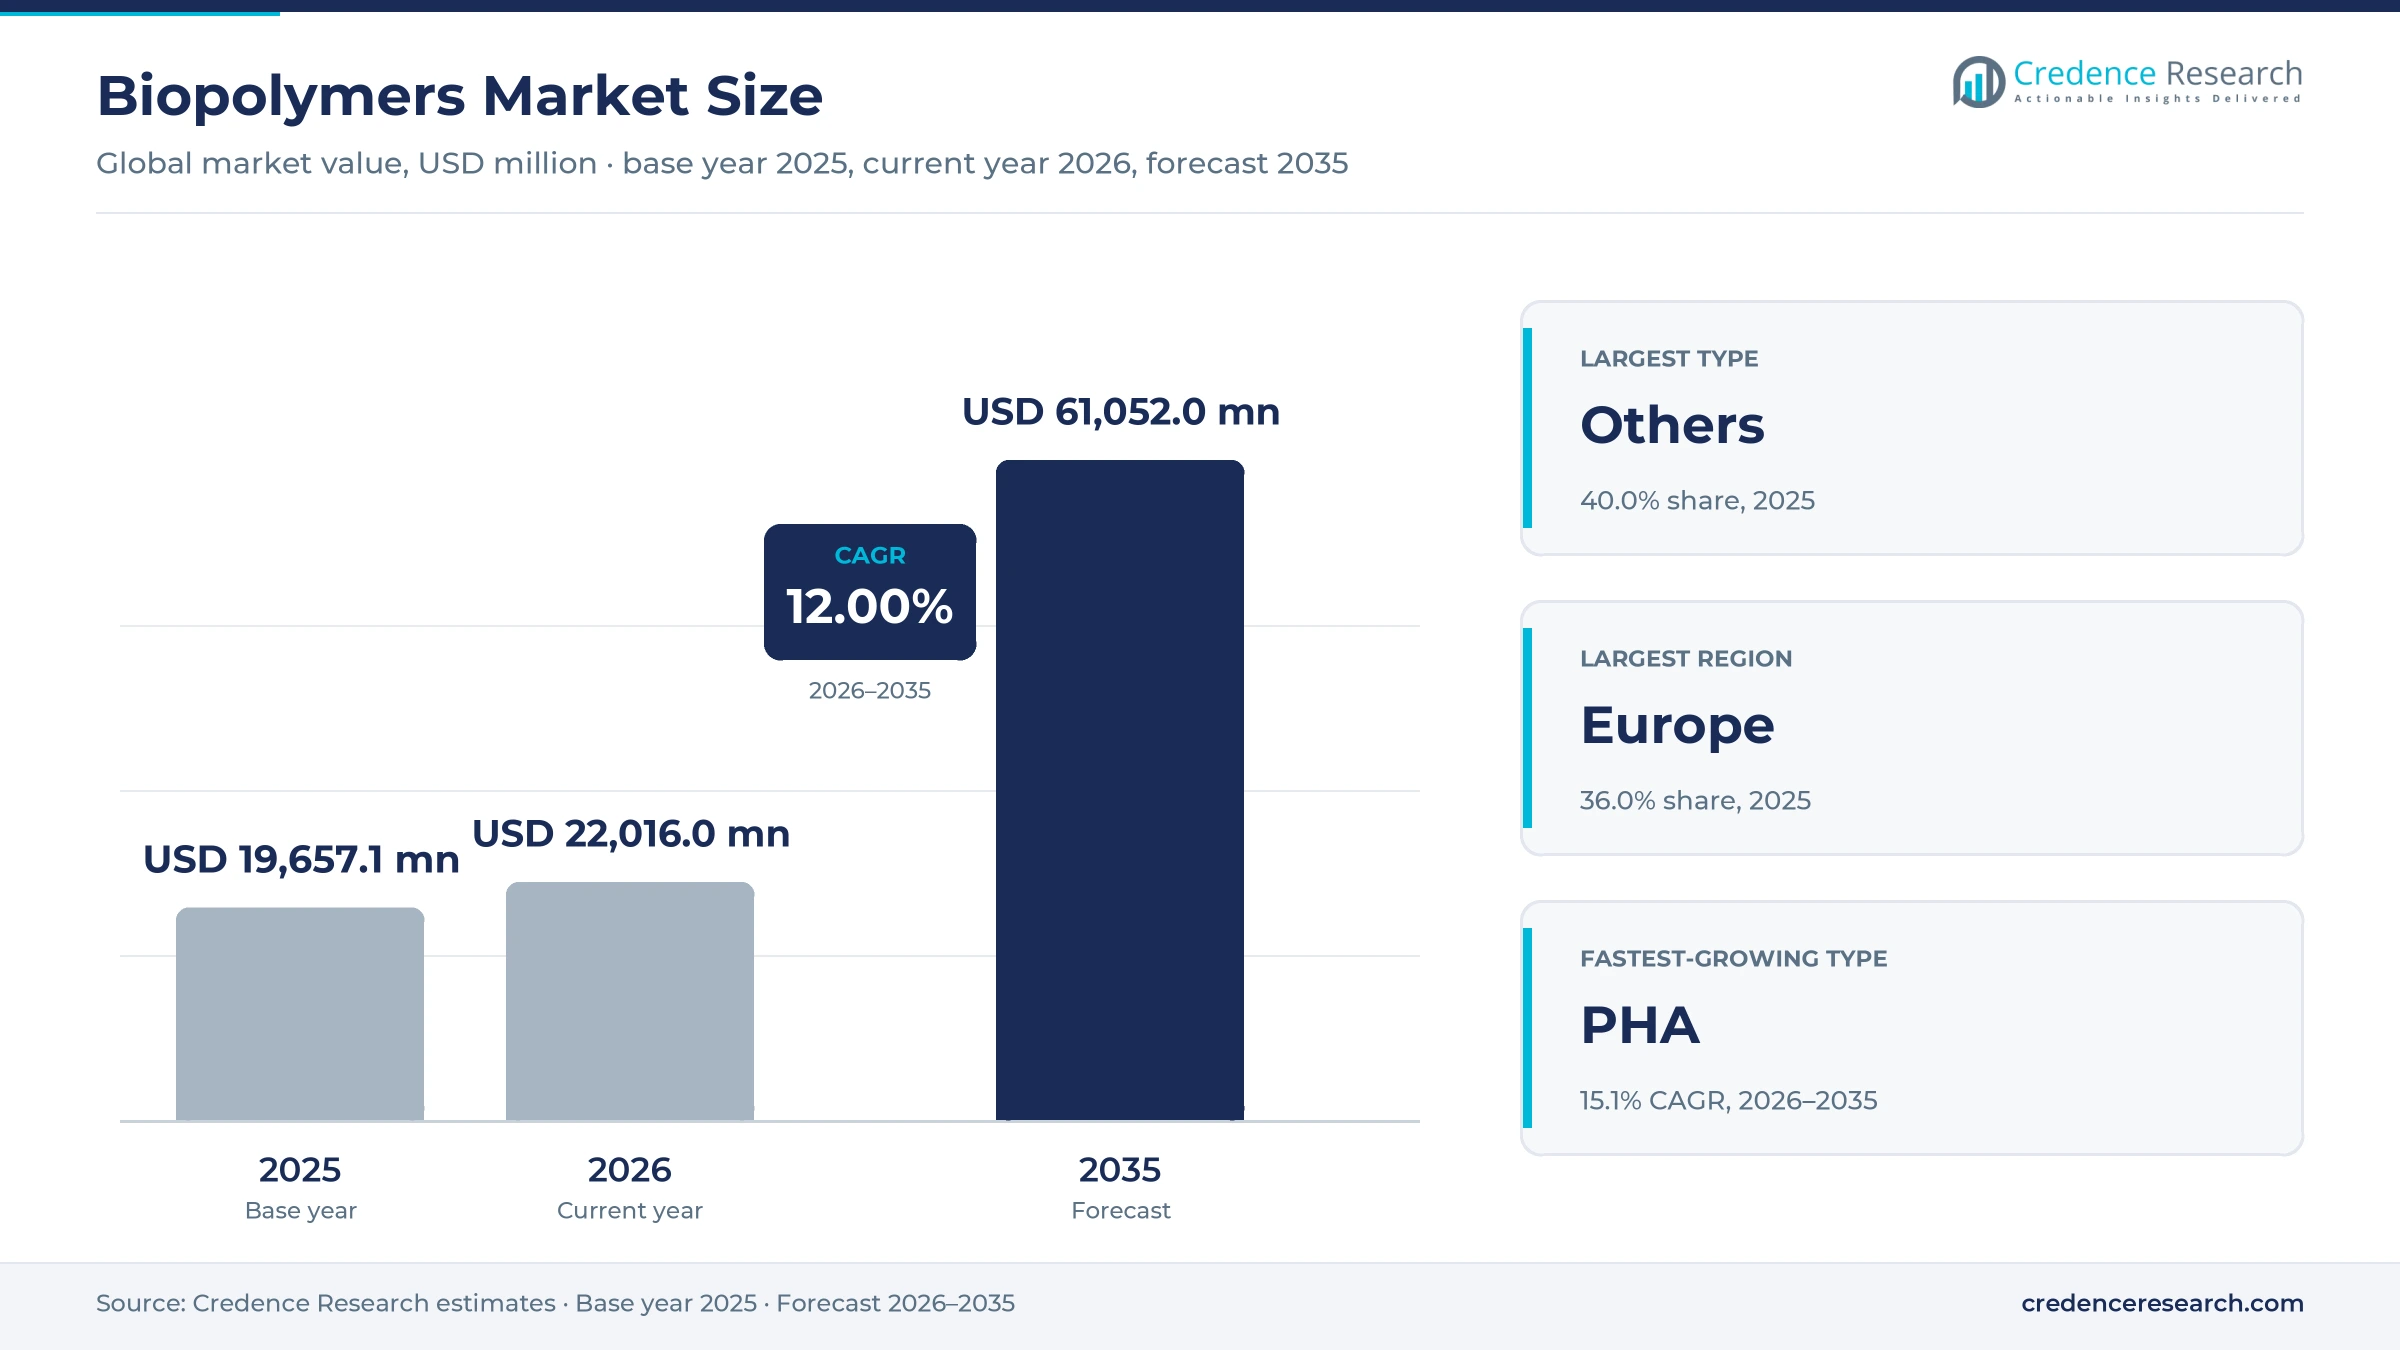
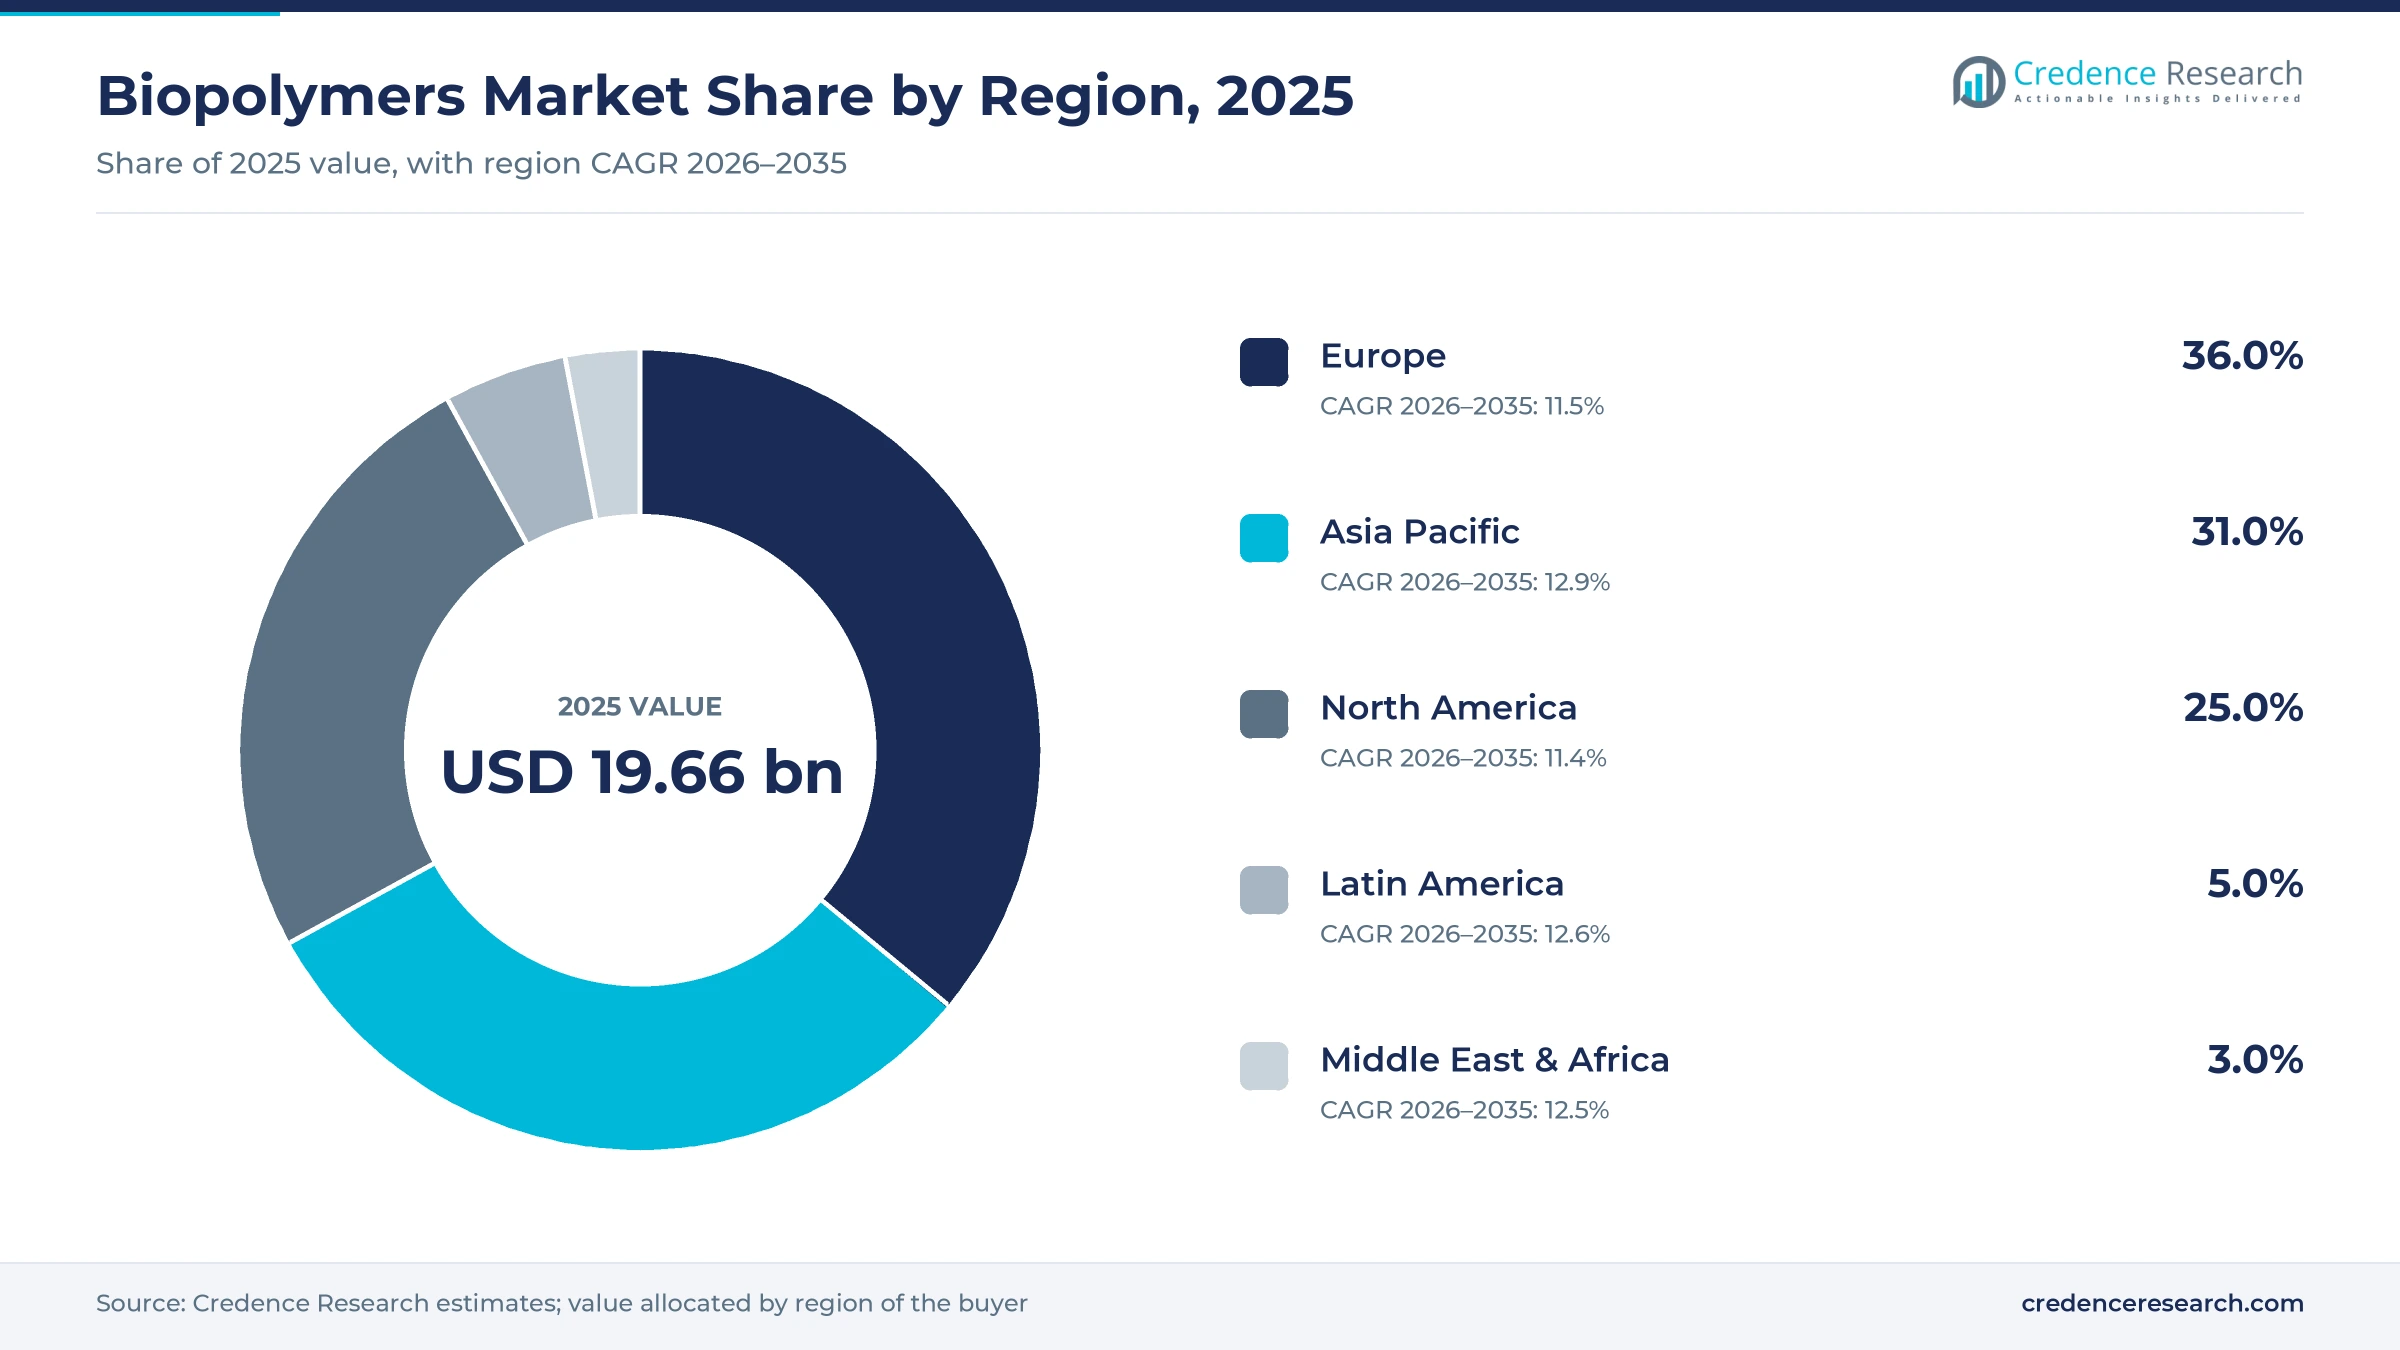
The global biopolymers market was valued at USD 19.66 billion in 2025 and is projected to increase from USD 22.02 billion in 2026 to USD 61.05 billion by 2035, registering a CAGR of 12.00% during 2026–2035. Demand comes from packaging converters, foodservice brands, fiber and nonwoven makers, automotive suppliers and farm film producers that need materials made from plant feedstock or able to break down in compost or soil. Europe held the largest regional share, 36.0% in 2025, because packaging and bag rules there turn compostability and bio-based content into purchasing criteria. Asia Pacific is the fastest-growing region at 12.9% a year, as integrated sugarcane-to-polymer plants in Thailand and India add supply close to converters. The EU packaging regulation, which applies from August 2026, is the main commercial change for buyers. A persistent price premium over fossil polyethylene remains the main restraint on wider substitution.
Which materials and buyers does the estimate cover?
The estimate counts sales of polymers made wholly or partly from biomass, or able to biodegrade, sold as resin or compound to converters. That covers PLA, starch blends, PBAT, PHA, PBS and PCL, bio-based polyethylene, PET, polyamide and PTT, plus bio-based polypropylene, PEF, cellulose acetate, regenerated cellulose and other natural polymers grouped as others, which carry the largest value in the estimate.
Finished bags, cups, films and implants sit outside the value, which is measured at the resin seller. Buyers usually contract by grade and tonnage with quarterly price reviews, so producer revenue moves with volume, feedstock costs and the premium that converters accept over fossil resins.
Biopolymers Market Insights
- The market is valued at USD 19.66 billion in 2025 and is projected to reach USD 61.05 billion by 2035, growing at a 12.00% CAGR as packaging rules and new capacity lift use.
- Europe led with 36.0% of 2025 value, because compostability and bio-based content are written into packaging and bag rules there.
- Others, mainly cellulose-based and other natural polymers, held 40.0% of 2025 value, while PHA grows fastest at 15.1% a year as producers such as Kaneka scale output.
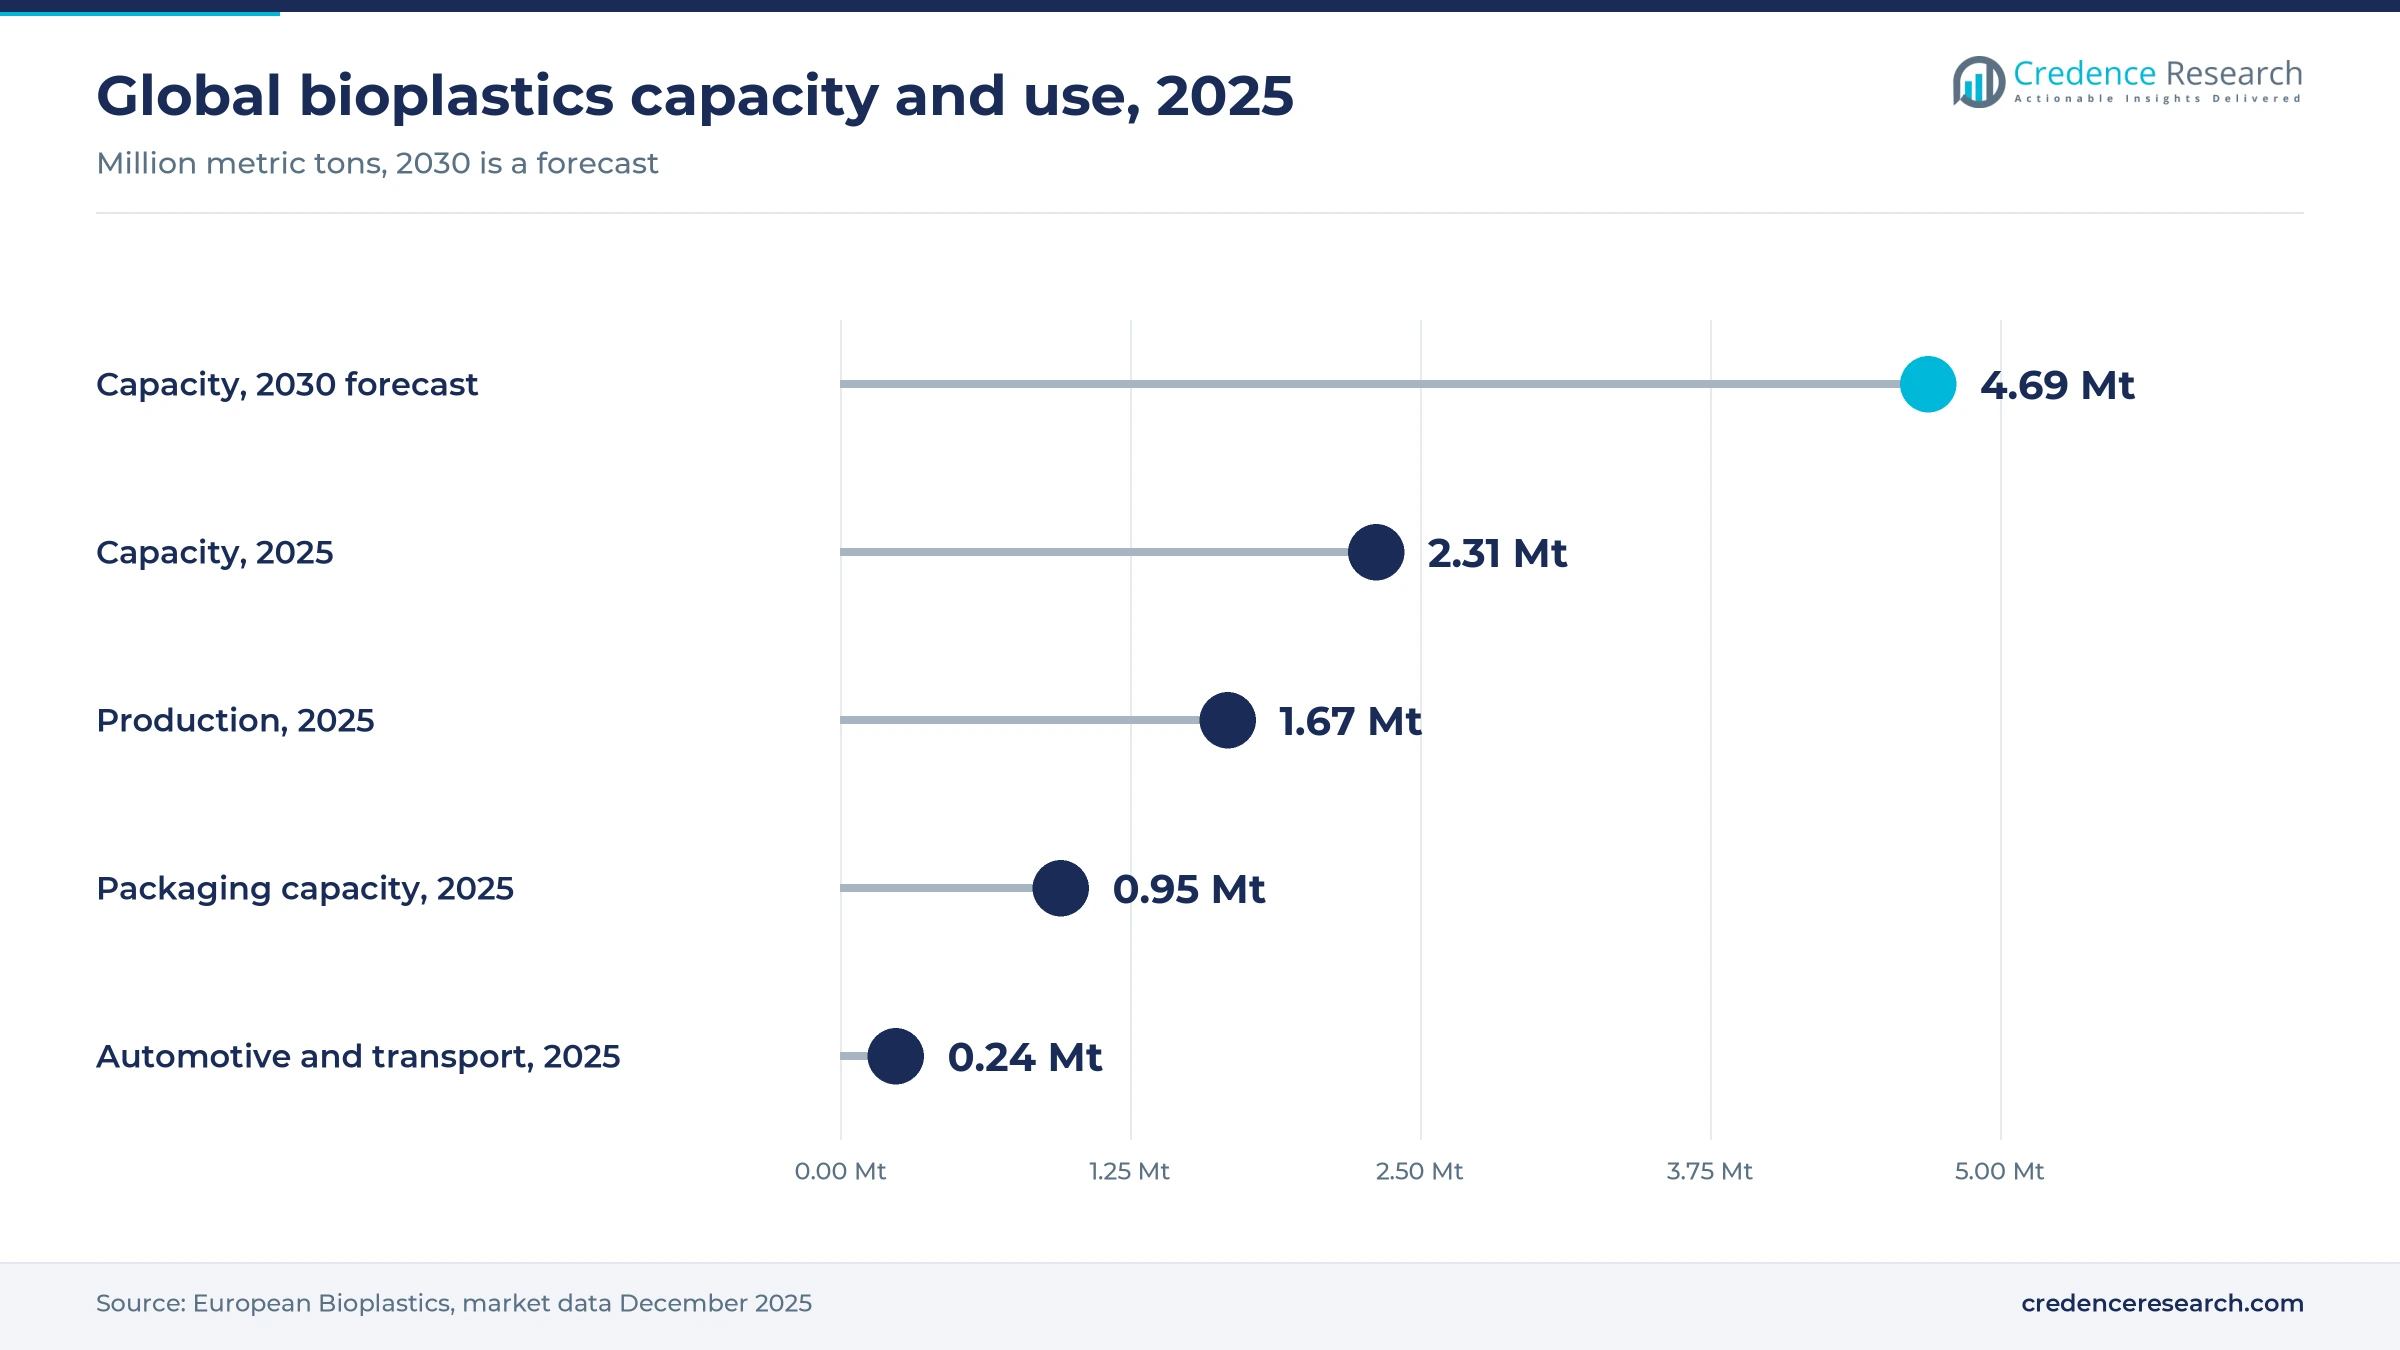
- Global bioplastics capacity was 2.31 million metric tons in 2025 and is forecast to reach about 4.69 million metric tons by 2030, according to European Bioplastics.
- NatureWorks opened a 75,000-metric-ton integrated PLA complex in Thailand in April 2026, combining lactic acid, lactide and polymer production at one site.
Cellulose-based grades lead by value while PHA grows fastest
Why do cellulose-based grades lead while PHA grows fastest?
Based on type, the market is categorized into PLA, starch blends, PBAT, PHA, PBS and PCL, bio-PE, bio-PET, bio-PA, bio-PTT and others. Others, which groups cellulose acetate, regenerated cellulose film, bio-based polyurethanes and medical-grade bioresorbables, led with 40.0% of 2025 value because cellulose-based materials have been sold at industrial scale for decades in filters, films, textiles and eyewear, while thermoplastic bioplastics output reached only 1.67 million metric tons in 2025, European Bioplastics reported. PHA grows fastest at 15.1% a year as output moves to commercial scale, and Kaneka quadrupled PHBH capacity to 20,000 metric tons a year in January 2024.
Why do films lead while medical implants grow fastest?
Based on application, the market is categorized into films, bottles, fibers, seed coating, vehicle components, medical implants and others. Films led with 30.0% of 2025 value because carrier bags, produce bags and mulch use thin gauges where compostability carries a clear disposal benefit. Medical Implants grow fastest at 13.5% a year as device makers move screws, anchors and sutures from metal to bioresorbable implants. Evonik expanded RESOMER powder capacity at Darmstadt in April 2024 and named IMCD as distributor for its medical device grades from July 1, 2025.
Why does packaging lead while agriculture grows fastest?
Based on end user, the market is categorized into packaging, consumer goods, automotive & transportation, textiles, agriculture & horticulture and others. Packaging led with 45.0% of 2025 value because food and retail packaging is where rules and brand pledges bite first. Packaging took 41.3% of global bioplastics capacity in 2025, or 0.95 million metric tons, European Bioplastics reported. Agriculture & Horticulture grows fastest at 13.2% a year as growers replace film and clips that must otherwise be collected from fields and greenhouses by hand.
| Segment Group | Leading Sub-segment | Share, 2025 | Fastest-growing Sub-segment | CAGR, 2026–2035 |
|---|---|---|---|---|
| By Type | Others | 40.0% | PHA | 15.1% |
| By Application | Films | 30.0% | Medical Implants | 13.5% |
| By End User | Packaging | 45.0% | Agriculture & Horticulture | 13.2% |
A two to eight times premium over polyethylene caps volume
Biopolymer prices are set per metric ton in grade contracts, and the gap to fossil resin decides how far substitution goes. PLA sells at roughly twice the price of HDPE, while PHA sells at roughly four to eight times, so PLA wins commodity films and cups and PHA is confined to uses where marine or home degradation justifies the cost. Feedstock sugar, plant utilization and fossil resin prices move the gap most. Converters that need compostability by law accept the premium, while those buying on carbon claims alone switch back when fossil prices fall.
| Material | Typical price or fee | Basis |
|---|---|---|
| HDPE, fossil reference, 2024 market price | USD 1.10-1.40 per kg | Plastics Engineering, May 2025 |
| PLA, 2024 market price | USD 2.40-3.00 per kg | Plastics Engineering, May 2025 |
| PHA, 2024 market price | USD 5.00-9.00 per kg | Plastics Engineering, May 2025 |
| PHA production cost | About 3 times the cost of conventional PE | Aimplas via Packaging Insights, December 2025 |
Request a Free Sample
Fill in your details and we'll send you a free sample report.
- Sample data tables & charts
- Research methodology
EU rules, engineering grades and new capacity lift demand
EU packaging rules make compostability a specification
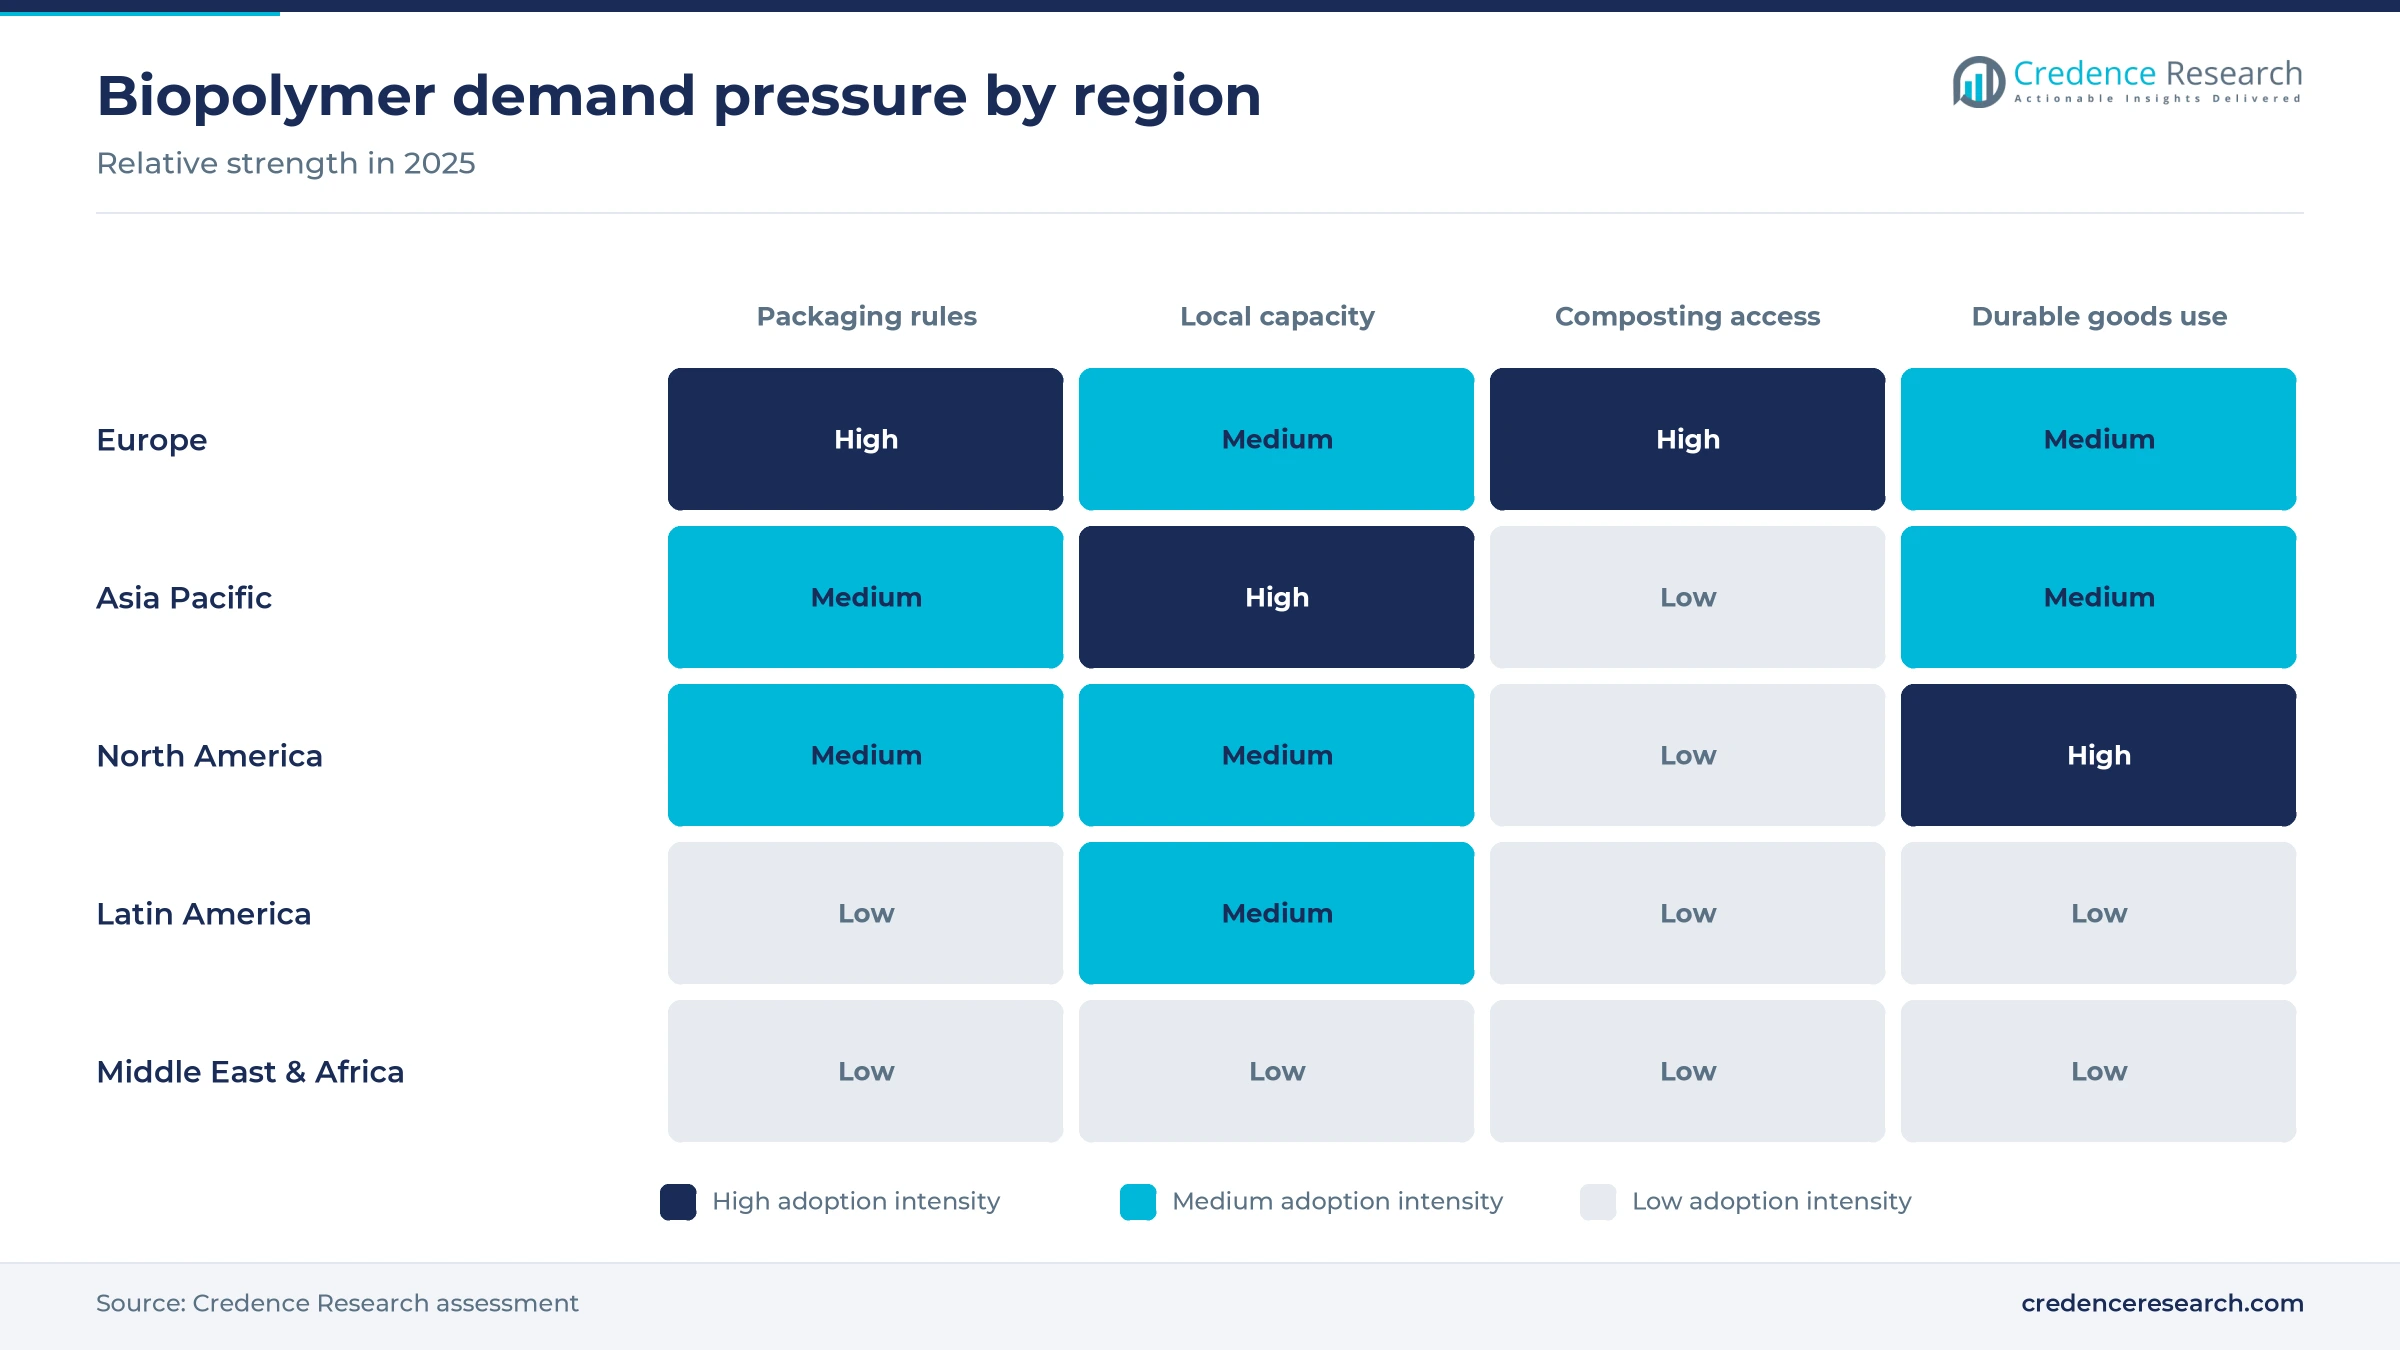
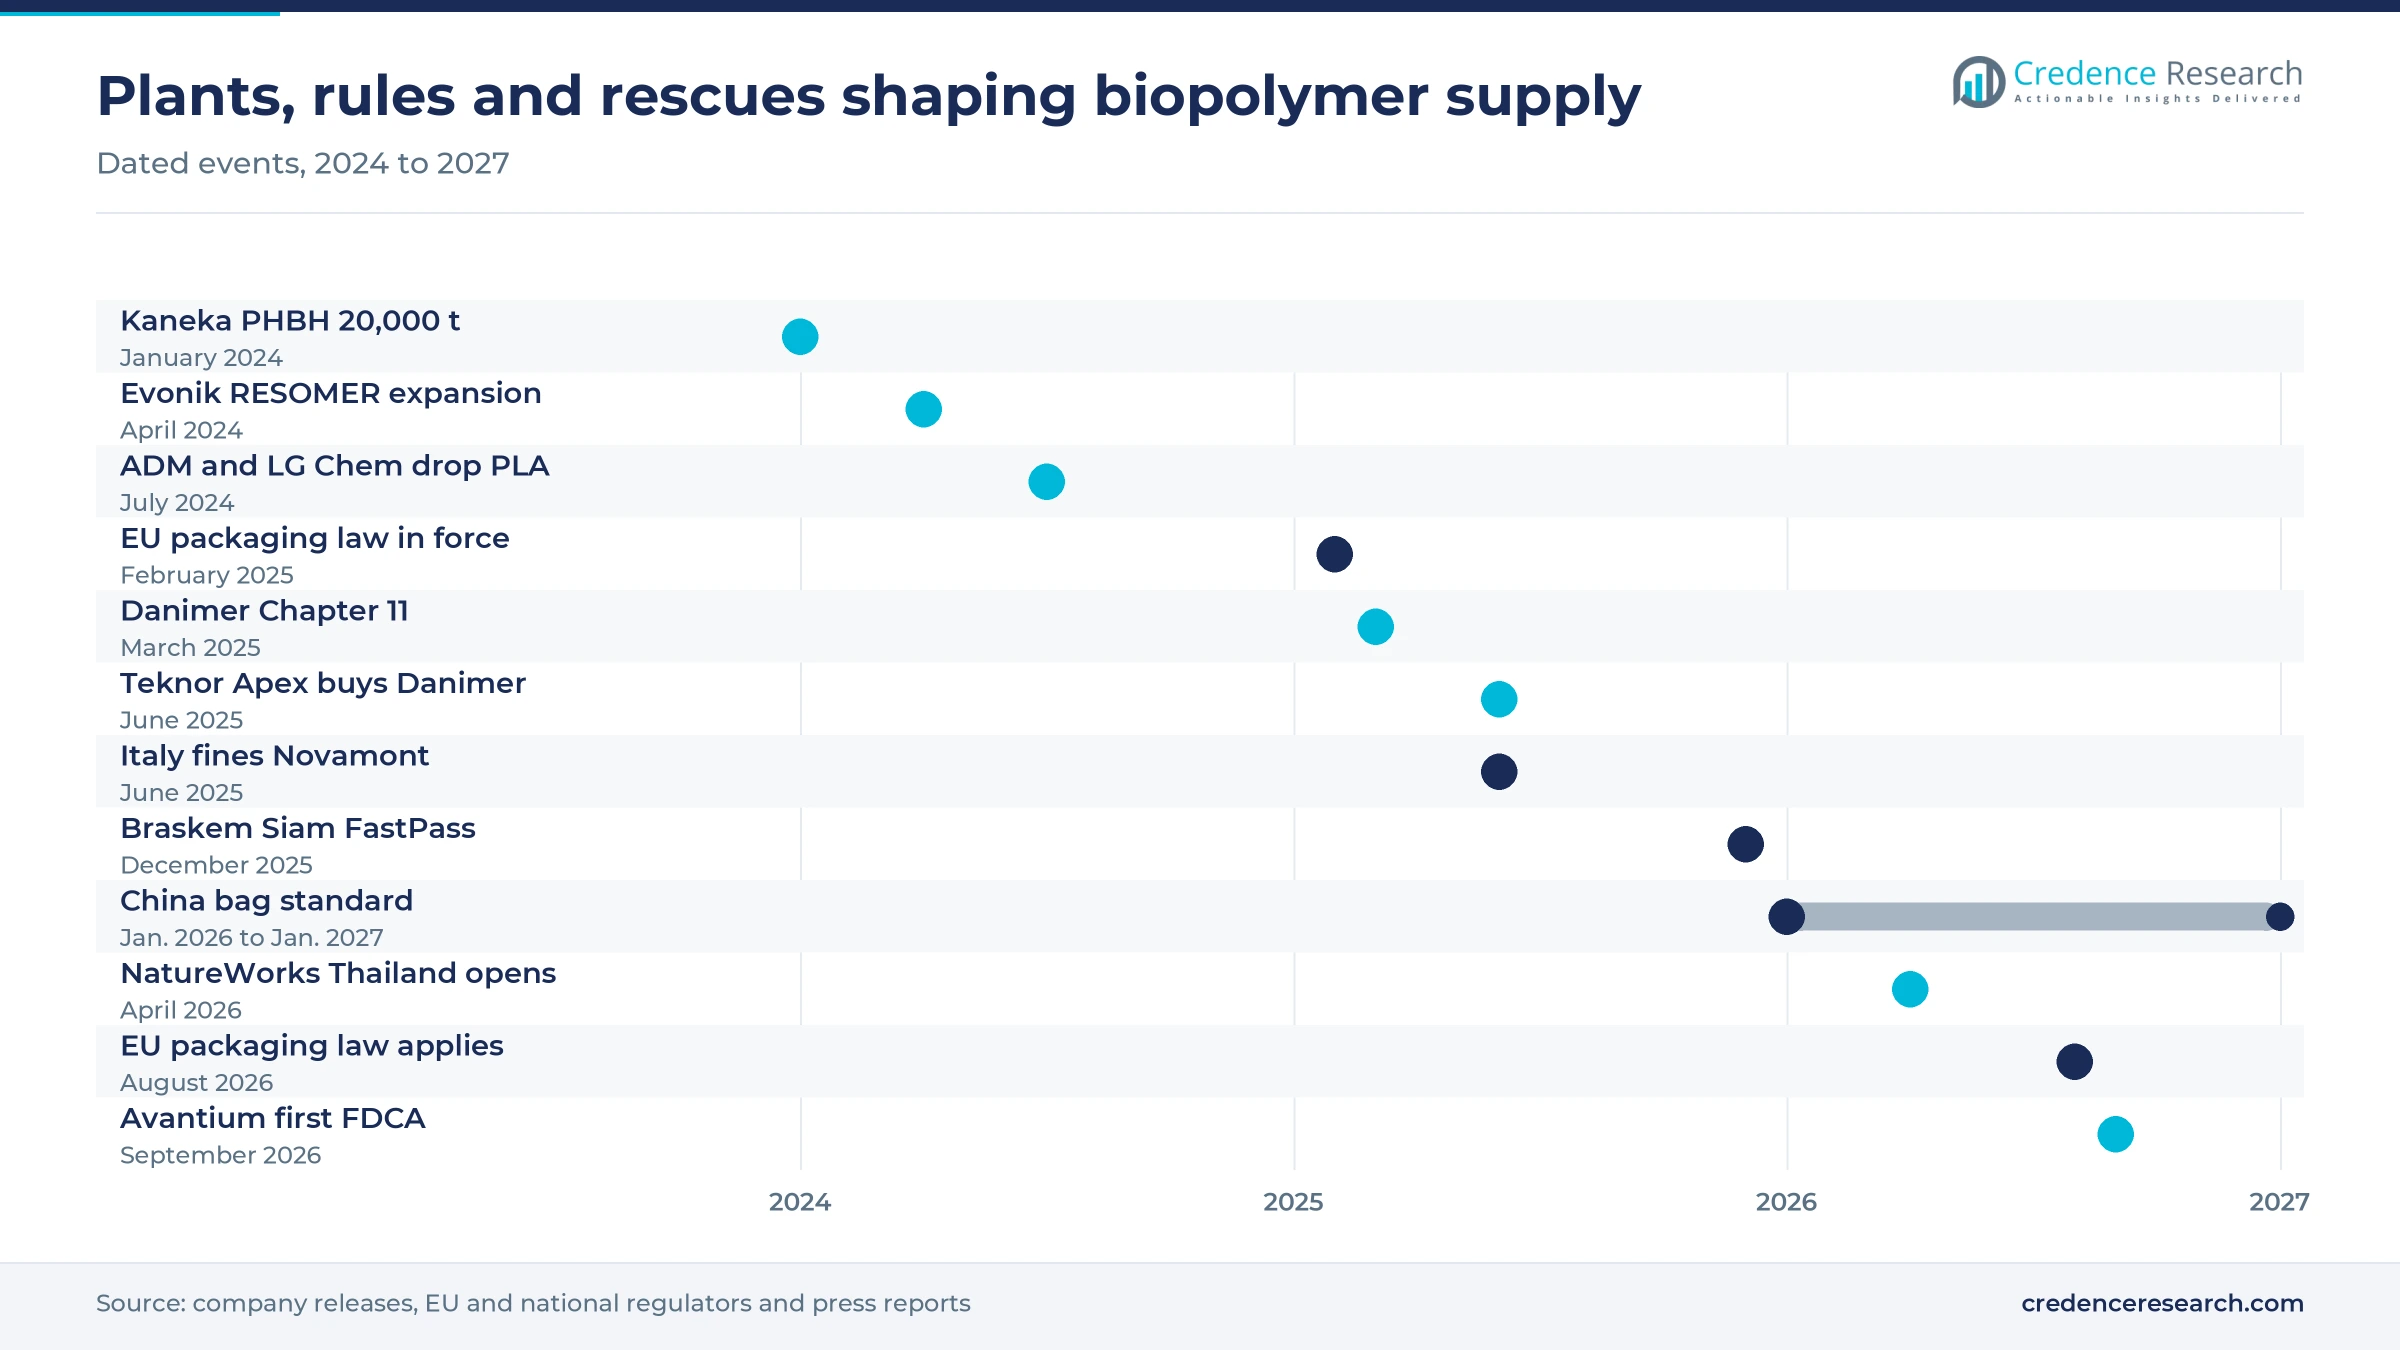
Binding packaging law turns compostable and bio-based content from a marketing choice into a technical requirement that buyers must document. The EU Packaging and Packaging Waste Regulation entered into force on Feb. 11, 2025, and generally applies from Aug. 12, 2026, according to the European Circular Economy Stakeholder Platform. That date forces converters to finalize material choices, labeling and supplier documentation for every packaging format they sell in the EU. Europe is already the largest regional buyer, so the rule lands on the biggest base of converters first. Suppliers with certified compostable film grades gain most, while converters holding unqualified fossil inventory face relabeling and requalification costs during the transition.
Engineering grades bring bio-based content into durable goods
Drop-in bio-based polymers grow because they run on existing molding and extrusion lines and need no new waste stream. Automotive and transport took 0.24 million metric tons, or 10.3% of bioplastics applications in 2025, according to European Bioplastics. Arkema said in July 2025 that its Singapore plant had lifted global Rilsan PA11 capacity by 50%, and its flagship transparent grades carry about 45% to 62% bio-based carbon. These grades sell into eyewear, electronics, healthcare devices and appliances, where price matters less than durability and recertifying a part is costly. Specialty producers with long qualification records keep pricing power, while commodity entrants struggle to qualify.
Microplastics limits push farm inputs toward degradable polymers
EU limits on intentionally added microplastics give fertilizer and seed treatment makers fixed dates to reformulate coatings with polymers that degrade. The restriction reaches fertilising products from Oct. 17, 2028, and plant protection products and treated seeds from Oct. 17, 2031, the European Commission says. Suppliers of seed coating and controlled-release fertilizer therefore need degradable binders tested well before those dates. BASF already sells ecovio M 2351 mulch film certified soil-biodegradable under EN 17033, which shows the certification route that coating suppliers can follow. Formulators with early test data gain contract wins, while slow movers risk losing EU registrations.
Capacity doubling to 2030 reduces supply risk for converters
Converters commit to biopolymers only when supply is deep enough to survive a plant outage, and that depth is building. Global bioplastics capacity reached 2.31 million metric tons in 2025 and is forecast to reach about 4.69 million metric tons by 2030, European Bioplastics reported. The association names PHA, PLA, bio-PP and bio-PE as the materials adding most capacity. Even so, bioplastics still equal only about 0.5% of the 431 million metric tons of plastics produced each year, which leaves wide headroom for substitution. Asia Pacific adds most of the new supply, as the plants described below show. Brand owners gain negotiating leverage as second sources appear for grades that once had a single qualified producer.
Asian sugarcane hubs and tighter Chinese standards
Producers shift toward integrated sugarcane hubs in Asia
PLA makers are shifting toward complexes that combine fermentation, monomer and polymer steps beside sugarcane supply to cut logistics costs and secure feedstock. NatureWorks announced the grand opening of a fully integrated 75,000-metric-ton Ingeo plant in Nakhon Sawan, Thailand, on April 29, 2026, targeting flexible packaging, compostable foodservice ware, nonwovens and 3D printing. In India, Balrampur Chini Mills expects its 80,000-metric-ton PLA plant in Uttar Pradesh to begin commercial operations in the January to March 2027 quarter, the Press Trust of India reported in November 2026. This shift creates openings for compostable foodservice packaging converters in Asia, while Western producers lose the freight advantage they held on shipments into Asian markets.
Chinese producers shift toward exports and stricter grades
Chinese biodegradable resin makers are shifting toward exports and higher-specification grades as domestic oversupply meets tighter product standards. China produced nearly 500,000 metric tons of biodegradable shopping bags in 2024, Caixin reported, a domestic outlet that the tighter standard below will narrow for PBAT makers. In January 2026, the State Administration for Market Regulation issued a revised standard requiring bags sold as biodegradable to reach 90% decomposition, up from 60%, effective Jan. 1, 2027, Caixin reported. Buyers outside China gain lower-cost PBAT offers, while compounders that blend PBAT with PLA or starch must retest formulations against the higher threshold before the 2027 deadline arrives, which favors compounders with in-house certification laboratories.
Japan supply gap opens an import opportunity
Japan offers exporters a clear opening because its national target sits far above domestic output. The government roadmap aims for 2 million metric tons of bioplastic products by 2030, yet Japanese bioplastics production reached only about 183,000 metric tons in 2023, the U.S. International Trade Administration reported, citing the Japan BioPlastics Association. Of that 2023 volume, about 104,000 metric tons were biodegradable and about 79,000 metric tons were not. PLA and bio-PE are mostly imported, with Brazil, Thailand and the United States as the main sources. Producers with Thai or Brazilian plants and Japanese food-contact approvals can win multiyear supply contracts with packaging and electronics converters.
Greenhouse clips and twines open a compostable niche
Commercial greenhouses offer a practical opening because plastic clips and twines are mixed into crop waste that growers want to compost. In February 2025, BASF launched ecovio 60 IA 1552 for plant clips on tomato, cucumber and pepper crops, certified industrially compostable under EN 13432. Dutch waste firm Renewi tested the clips at industrial scale in Hook of Holland and found that they biodegrade within six weeks after each crop cycle, BASF said. The grade runs on standard PE or PP clip machinery, so molders need no new tooling. Greenhouse operators save sorting labor, and suppliers can sell repeat volumes each growing season.
Price gaps, stalled plants and weak end-of-life systems
Price gaps keep PHA in niche uses
Cost remains the main brake because most buyers compare biopolymers directly with fossil polyethylene. Producing a kilogram of PHA still costs around three times more than conventional PE, an Aimplas packaging researcher told Packaging Insights in December 2025. PLA often needs fossil polymer blends to match performance in demanding uses. Converters in price-sensitive films and bottles are most exposed, especially when fossil resin prices fall. Producers can narrow the gap only through larger plants and higher utilization, which favors the largest PLA sites.
Rising construction costs stall new plants
New capacity is hard to finance when build costs rise faster than biopolymer prices. In July 2024, ADM and LG Chem dropped planned lactic acid and PLA projects in the United States, saying construction costs had climbed since 2022. Global bioplastics plants ran at about 72% utilization in 2025, well below design rates, European Bioplastics reported. Underused existing capacity weakens the case for new plants, so investors favor brownfield additions and partnerships over greenfield builds.
Pure-play producers carry high financing risk
Single-product producers lack the cash flow of chemical majors and can fail when one large customer changes plans. Danimer Scientific filed for Chapter 11 protection in Delaware on March 18, 2025, listing about USD 449 million of liabilities, Bloomberg Law reported. The company cited headwinds from changes in Starbucks straw sourcing. Brand owners buying from such suppliers face qualification restarts if a plant closes, so many now insist on dual sourcing.
Weak collection systems limit compostable claims
Compostable grades deliver value only where collection and composting exist, and those systems remain thin. Only about 12% of U.S. households had access to municipal food waste collection in 2023, a BioCycle survey cited by Packaging Dive found. EU recyclability grades also apply from 2030, according to the same packaging regulation. Compostable packaging makers are most exposed in markets without organics collection, where products end in landfill.
Europe leads while Asia Pacific adds the most capacity
| Region | Value, 2025 (USD billion) | Share, 2025 | CAGR, 2026–2035 |
|---|---|---|---|
| Europe | 7.08 | 36.0% | 11.5% |
| Asia Pacific | 6.09 | 31.0% | 12.9% |
| North America | 4.91 | 25.0% | 11.4% |
| Latin America | 0.98 | 5.0% | 12.6% |
| Middle East & Africa | 0.59 | 3.0% | 12.5% |
Europe leads on bag and packaging mandates
Europe held 36.0% of 2025 value and grows at 11.5% a year, because national rules created steady demand for compostable film long before the EU regulation. Italy has required compostable bags in supermarkets since 2011, Packaging Insights noted in December 2025. European plants ran at 73% utilization in 2025, slightly above the global average, and new European capacity centers on bio-PP, bio-PE and PHA, European Bioplastics said. Film converters with certified compostable grades hold the strongest position as the 2026 packaging rules lift regional demand.
Asia Pacific adds supply and grows fastest
Asia Pacific held 31.0% of 2025 value and grows fastest at 12.9% a year, because the region hosts most new PLA, PBAT and PHA plants noted above. China produced nearly 500,000 metric tons of biodegradable shopping bags in 2024, with output value above 10 billion yuan, Caixin reported in January 2026. Local converters gain cheap resin, while exporters to Japan and Europe must meet stricter certification than the domestic market has required.
North America relies on one large PLA base
North America held 25.0% of 2025 value and grows at 11.4% a year, slower than the total, because composting access limits compostable packaging. NatureWorks makes Ingeo PLA at Blair, Nebraska, where Cargill opened the plant in 2002, Packaging Dive reported. USDA organic rules bar synthetic materials from compost certified as organic, so many composters screen out PLA. Durable bio-based grades in vehicles and appliances face no such barrier.
Latin America builds on sugarcane bio-polyethylene
Latin America held 5.0% of 2025 value and grows at 12.6% a year, because Brazilian sugarcane ethanol supports large-scale bio-polyethylene. Braskem lifted capacity at its Triunfo plant in Rio Grande do Sul from 200,000 to 260,000 metric tons a year after an investment of USD 87 million, completed in July 2023. Most of that output is exported to brand owners abroad, so local converter demand in 2025 remained small and the region depends on foreign brand contracts.
Middle East & Africa starts from distribution deals
Middle East & Africa held 3.0% of 2025 value and grows at 12.5% a year, because demand is still built through importers rather than local plants. In September 2025, TotalEnergies Corbion named Multi Trade Group as distribution partner for Luminy PLA in the UAE, Saudi Arabia and the wider Middle East, Zawya reported. Public data on regional biopolymer consumption remain sparse, so this share carries the widest error range.
Plant start-ups and rescues define 2025 and 2026
| Development | Status and market relevance |
|---|---|
| In September 2026, Avantium produced its first batch of FDCA at its Delfzijl flagship plant in the Netherlands, the first commercial-scale FDCA plant. | Start-up and product qualification; ramp-up over 12 to 24 months, with commercial sales expected from the end of 2026. |
| In June 2025, Teknor Apex acquired Danimer Scientific, the PHA and PLA compounder based in Bainbridge, Georgia. | Completed acquisition; Danimer continues as a separate entity under its own name, preserving its PHA supply to brand owners. |
| In March 2025, TotalEnergies Corbion offered chemically recycled Luminy PLA grades with 30% and 100% recycled content from Rayong, Thailand. | Commercial launch; gives converters a recycled-content route for PLA under packaging recyclability rules. |
| In December 2025, the Thailand Board of Investment selected the Braskem Siam bio-ethylene project of SCG Chemicals and Braskem for its FastPass measure. | Approval for fast-track handling; 200,000 metric tons a year planned, final investment decision expected in the second quarter of 2026 and completion in 2028. |
| In January 2026, Arkema started a new Rilsan Clear transparent polyamide unit in Singapore, an investment of about USD 20 million. | Operational launch; roughly triples global Rilsan Clear output for eyewear, electronics and medical devices. |
PHBH, FDCA and hydrolysis recycling widen the toolkit
- PHBH copolymers combine marine and soil degradability with better heat resistance than earlier PHA grades, which suits straws, cutlery and paper coatings that may escape collection.
- FDCA and PEF offer a fully plant-based polyester with a stronger gas barrier than PET, which suits carbonated drink bottles, food films and multilayer packaging that now relies on fossil barrier layers.
- Hydrolysis recycling breaks used PLA back to lactic acid that can be purified and repolymerized, which lets producers sell recycled-content grades with the same properties as virgin resin.
- Soil-biodegradable certification under EN 17033 lets mulch film stay in the field and break down after harvest, which removes the labor and disposal costs of collecting soiled film.
Need a Custom Version of This Report?
Tailor the scope, geography, or segments to your exact requirements.
- Custom geography or segment scope
- Direct access to our analyst team
Integrated PLA producers face chemical majors and pure plays
Competition turns on scale, feedstock integration and certified grades rather than on brand. NatureWorks and TotalEnergies Corbion supply most commercial PLA and compete on grade breadth and plant reliability. Versalis absorbed Novamont in October 2023, giving Eni control of the Mater-Bi starch-based range. In June 2025, Italy's competition authority fined Novamont 30.4 million euros and Eni 1.7 million euros, finding exclusivity clauses with bag makers and retailers from 2018 to 2023, AFP reported. Braskem leads bio-polyethylene from Brazil, while Arkema and Huafon, which bought DuPont's biomaterials business in May 2022, hold specialty bio-polyamide and bio-PTT positions. Eastman sells cellulose acetate and cellulosic fiber, Kaneka and Teknor Apex compete in PHA, and Evonik supplies medical bioresorbables. Buyers shortlist suppliers on certification, food-contact approval and second-source security. The 12 companies profiled below cover PLA, PHA, cellulose, bio-polyethylene, bio-polyamide, bio-PTT, FDCA and medical bioresorbable supply in the biopolymers market.
How is the supply side organized and where do margins sit?
Supply splits into three groups with different cost and risk profiles. Integrated PLA producers, led by NatureWorks, which Cargill and PTT Global Chemical own equally, and TotalEnergies Corbion, control fermentation, monomer and polymer steps. Chemical majors such as BASF, Arkema and Versalis sell biopolymers beside fossil lines and can absorb weak years. Pure plays such as Avantium, and Danimer before its sale, carry the most technology and financing risk. Barriers sit in monomer purification, food-contact approvals and compostability certification. Margins concentrate in specialty and medical grades, while commodity PLA and PBAT margins depend on utilization and sugar prices.
Companies profiled and their roles in this market
| Company | Type | Role in the market |
|---|---|---|
| NatureWorks LLC | Integrated PLA producer | Makes Ingeo PLA in Nebraska and Thailand for films, fibers and foodservice |
| TotalEnergies Corbion | Integrated PLA producer | Makes Luminy PLA and recycled PLA in Rayong, Thailand |
| Braskem S.A. | Bio-based polyolefin producer | Sells I'm green sugarcane-based polyethylene from Triunfo, Brazil |
| BASF SE | Diversified chemical producer | Sells ecovio compostable compounds and ecoflex PBAT for films and agriculture |
| Versalis S.p.A. (Novamont, Eni) | Starch-based biopolymer producer | Sells Mater-Bi compostable compounds for bags and food packaging |
| Kaneka Corporation | PHA producer | Makes Green Planet PHBH for straws, cutlery and coated packaging |
| Arkema S.A. | Specialty polyamide producer | Sells castor-based Rilsan PA11 and Rilsan Clear for durable goods |
| Teknor Apex Company (Danimer Scientific) | PHA compounder | Supplies Danimer PHA and PLA resins for straws and packaging |
| Huafon Group (Covation Biomaterials) | Bio-PDO and PTT producer | Sells Sorona bio-based PTT polymer for textiles and carpets |
| Evonik Industries AG | Medical biomaterials producer | Sells RESOMER bioresorbable polymers for implants and drug delivery |
| Avantium N.V. | FDCA and PEF developer | Starting FDCA output in Delfzijl for PEF bottles and films |
| Eastman Chemical Company | Cellulose-based materials producer | Sells cellulose acetate polymers and Naia cellulosic fiber made from wood pulp |
Utilization, not announced capacity, decides margins
Credence Research's view is that utilization, more than announced capacity, will decide who earns returns to 2035. Plants running well below design rates cannot cover fermentation and purification costs, which explains why greenfield PLA projects in the United States were dropped while integrated plants beside sugar supply went ahead. Buyers should expect PLA and PBAT prices to stay under pressure as Thai, Indian and Chinese capacity ramps, while PHA and medical grades keep premiums. Suppliers with certified compostable and recycled-content grades, plus a second production site, are best placed to win multiyear packaging contracts once EU rules apply.
Earlier estimate rolled forward and tested on output data
The report uses 2025 as the base year and forecasts to 2035. The earlier Credence Research estimate for 2024 was rolled forward one year at its own growth rate and tested against bioplastics output and capacity data from European Bioplastics, price ranges published in Plastics Engineering, and company plant disclosures. Regional and segment shares are Credence Research estimates based on capacity location, packaging rules and application data. Sources include industry associations, government agencies, company releases and trade press. No interviews or surveys were conducted for this update of the estimate.
Capacity doubling to 2030 shapes the path to 2035
Growth to 2035 depends on how quickly new Asian capacity reaches full rates and whether EU and Chinese rules are enforced as written. The base case assumes packaging and microplastics deadlines hold and that PLA prices drift down as Thai and Indian plants ramp. PHA and FDCA-based PEF should move from pilot volumes to commercial supply during the forecast, widening the range of uses. Composting access in North America remains the main swing factor for compostable packaging. Durable bio-based grades in vehicles and devices offer steadier, less policy-dependent growth.
Policy enforcement decides the spread of outcomes
The range of outcomes depends mainly on how strictly packaging and microplastics rules are enforced and on the price gap to fossil resins. Strict enforcement with cheaper sugar feedstock supports faster growth, while weak composting access and low oil prices push buyers back to conventional polymers. Plant start-ups in Thailand and India add supply in either case, so price, not volume, carries most of the risk.
| Scenario | CAGR, 2026–2035 | Value, 2035 | What has to hold |
|---|---|---|---|
| Downside | 10.0% | USD 51.91 billion | Fossil resin prices stay low and EU enforcement of compostable formats slips |
| Base | 12.00% | USD 61.05 billion | Packaging rules apply on schedule and Asian plants ramp to planned utilization |
| Upside | 13.5% | USD 68.82 billion | Organics collection expands and PHA costs fall toward twice the price of polyethylene |
Frequently Asked Questions
How big is the biopolymers market?
Which biopolymer type holds the largest share?
Which region leads the biopolymers market?
How much bioplastics capacity exists worldwide?
What restrains the biopolymers market?
Is there a large biopolymer plant in India?
Who are the key companies in the biopolymers market?
Which application of biopolymers grows fastest?
Table of Content
Chapter 1 Market Segmentation
- 1.1 Segmentation Framework
- 1.1.1 Product and Service Classification
- 1.1.2 Application and End-Use Classification
- 1.1.3 Technology and Solution Classification
- 1.1.4 Customer and Distribution Channel Classification
- 1.1.5 Geographic Segmentation
- 1.1.6 Market Segment Definitions and Boundaries
- 1.2 By Type
- 1.2.1 PLA
- 1.2.2 Starch Blends
- 1.2.3 PBAT
- 1.2.4 PHA
- 1.2.5 PBS and PCL
- 1.2.6 Bio-PE
- 1.2.7 Bio-PET
- 1.2.8 Bio-PA
- 1.2.9 Bio-PTT
- 1.2.10 Others
- 1.3 By Application
- 1.3.1 Films
- 1.3.2 Bottles
- 1.3.3 Fibers
- 1.3.4 Seed Coating
- 1.3.5 Vehicle Components
- 1.3.6 Medical Implants
- 1.3.7 Others
- 1.4 By End User
- 1.4.1 Packaging
- 1.4.2 Textiles
- 1.4.3 Consumer Goods
- 1.4.4 Automotive & Transportation
- 1.4.5 Agriculture & Horticulture
- 1.4.6 Others
Chapter 2 Introduction
- 2.1 Report Objectives and Scope
- 2.2 Product Definition and Industry Terminology
- 2.3 Market Inclusions and Exclusions
- 2.4 Research Process
- 2.4.1 Primary Research and Expert Interviews
- 2.4.2 Secondary Research and Source Review
- 2.4.3 Top-Down and Bottom-Up Estimation
- 2.4.4 Data Triangulation and Verification
- 2.5 Market Size Measurement Basis
- 2.5.1 2025: USD 19.66 billion → 2035: USD 61.05 billion
- 2.6 Historical and Forecast Reference Periods
- 2.6.1 Historical Period: 2018-2025
- 2.6.2 Base Year: 2025
- 2.6.3 Forecast Period: 2025-2035
- 2.7 Research Assumptions and Limitations
Chapter 3 Executive Summary
- 3.1 Market Snapshot and Key Findings
- 3.2 Base-Year Market Size, 2025
- 3.3 Forecast Market Size, 2035
- 3.4 Revenue and Volume Growth Outlook
- 3.5 Key Demand and Supply Indicators
- 3.6 Leading Market Segments
- 3.7 Fastest-Growing Market Opportunities
- 3.8 Regional Performance Highlights
- 3.9 Technology and Industry Transformation
- 3.10 Competitive Landscape Summary
- 3.11 Analyst View and Strategic Implications
Chapter 4 Global Biopolymers Market Trends and Developments
- 4.1 Historical Industry Development, 2018-2025
- 4.2 Recent Market Trends and Developments
- 4.3 Demand and Customer Behavior Trends
- 4.4 Technology and Product Innovation
- 4.5 Artificial Intelligence, Automation and Digitalization
- 4.6 Local Manufacturing and Supply Chain Realignment
- 4.7 Industry Partnerships, Mergers and Acquisitions
- 4.8 Sustainability and Circular Economy Developments
- 4.9 Government and Private Sector Investment Trends
- 4.10 Emerging Business Models and Commercialization
- 4.11 Industry Developments and Announcements
Chapter 5 Global Biopolymers Market Production, Supply and Demand Analysis
- 5.1 Demand Trend and Consumption Analysis, 2018-2025
- 5.2 Demand Forecast, 2025-2035
- 5.3 Production and Output Trend, 2018-2025
- 5.4 Production and Output Forecast, 2025-2035
- 5.5 Installed Capacity and Capacity Utilization
- 5.6 Company-Wise Production Plants and Statistics
- 5.6.1 Installed Production Capacity
- 5.6.2 Actual Production
- 5.6.3 Planned Capacity and Expansion Targets
- 5.7 Supply Chain Structure and Procurement Trends
- 5.8 Supply-Demand Gap and Bottlenecks
- 5.9 Import Dependence and Sourcing Structure
- 5.10 Contract Manufacturing and Outsourcing
- 5.11 Regional Supply and Demand Concentration
Chapter 6 Global Biopolymers Market Pricing Analysis
- 6.1 Pricing Structure and Measurement
- 6.2 Historical Pricing Trends, 2018-2025
- 6.3 Pricing Outlook, 2025-2035
- 6.4 Average Selling Price and Unit Economics
- 6.5 Pricing by Product and Market Segment
- 6.6 Geographic Pricing Differences
- 6.7 Key Input, Energy, Labor and Logistics Costs
- 6.8 Contract Pricing and Purchasing Models
- 6.9 Pricing Sensitivity and Competitive Positioning
- 6.10 Price, Margin and Profitability Implications
Chapter 7 Global Biopolymers Market Dynamics
- 7.1 Market Growth Drivers
- 7.1.1 Demand-Side Drivers
- 7.1.2 Technology and Innovation Drivers
- 7.1.3 Infrastructure and Investment Drivers
- 7.1.4 Regulatory and Policy Drivers
- 7.2 Market Restraints
- 7.2.1 Cost and Affordability Constraints
- 7.2.2 Technology and Adoption Barriers
- 7.2.3 Supply Chain and Operational Constraints
- 7.3 Market Challenges
- 7.3.1 Competitive Pressure and Margin Erosion
- 7.3.2 Skills, Infrastructure and Implementation Gaps
- 7.4 Emerging Market Opportunities
- 7.5 Market Dynamics Impact and Time-Horizon Assessment
Chapter 8 Global Biopolymers Value Chain Analysis
- 8.1 Industry Value Chain Overview
- 8.2 Upstream Suppliers and Critical Inputs
- 8.3 Technology and Component Providers
- 8.4 Manufacturing or Service Delivery
- 8.5 Distribution, Channel Partners and Integrators
- 8.6 Downstream Applications and End Users
- 8.7 Value Addition and Profit Pools
- 8.8 Vertical Integration and Outsourcing
- 8.9 Supplier Concentration and Risk
- 8.10 Supply Chain Localization and Resilience
Chapter 9 Global Biopolymers Market Regulations and Policies
- 9.1 Relevant Laws, Standards and Compliance Frameworks
- 9.2 Product, Service, Safety and Quality Requirements
- 9.3 Government Policies, Incentives and Subsidies
- 9.4 Imports, Exports and Trade Barriers
- 9.5 Public Procurement and Local Content Requirements
- 9.6 Environmental and Sustainability Compliance
- 9.7 Upcoming Policy Changes and Market Implications
Chapter 10 Global Biopolymers Market Hotspots and Opportunities
- 10.1 Market Opportunity Mapping and Growth Hotspots
- 10.2 High-Growth Applications and Customer Groups
- 10.3 Underserved Markets and White-Space Opportunities
- 10.4 Emerging Technology and Product Opportunities
- 10.5 New Capacity and Investment Hotspots
- 10.6 Market Entry and Expansion Opportunities
- 10.7 Distribution and Partnership Opportunities
- 10.8 Near-Term and Long-Term Commercial Potential
- 10.9 Opportunity Attractiveness and Execution Risks
Chapter 11 Global Biopolymers Market Outlook, 2025-2035
- 11.1 Market Size and Analysis
- 11.1.1 Revenue (Market Measurement: 2025: USD 19.66 billion → 2035: USD 61.05 billion)
- 11.1.2 Market Volume and Quantity Sold
- 11.1.3 Historical Market Size, 2018-2025
- 11.1.4 Base-Year Market Size, 2025
- 11.2 Market Forecast, 2025-2035
- 11.2.1 Revenue Forecast to 2035
- 11.2.2 Volume Forecast to 2035
- 11.2.3 CAGR and Year-on-Year Growth
- 11.2.4 Incremental Revenue Opportunity
- 11.3 Forecast Assumptions and Scenario Analysis
- 11.3.1 Base-Case Forecast
- 11.3.2 Optimistic and Conservative Scenarios
- 11.3.3 Technology, Pricing and Policy Sensitivities
- 11.4 Market Attractiveness and Growth Outlook
Chapter 12 Global Biopolymers Market Segmentation and Outlook
- 12.1 Segmentation Summary and Market Shares, 2025
- 12.2 Largest and Fastest-Growing Segments
- 12.3 By Type - Market Size and Forecast, 2025-2035
- 12.3.1 Segment Definition and Scope
- 12.3.2 Historical Market Size, 2018-2025
- 12.3.3 Revenue Forecast, 2025-2035
- 12.3.4 Volume Forecast, 2025-2035
- 12.3.5 Base-Year Market Share, 2025
- 12.3.6 Segment CAGR and Growth Drivers
- 12.3.7 Subsegment Market Size and Forecast
- 12.3.7.1 PLA
- 12.3.7.2 Starch Blends
- 12.3.7.3 PBAT
- 12.3.7.4 PHA
- 12.3.7.5 PBS and PCL
- 12.3.7.6 Bio-PE
- 12.3.7.7 Bio-PET
- 12.3.7.8 Bio-PA
- 12.3.7.9 Bio-PTT
- 12.3.7.10 Others
- 12.3.8 Subsegment Pricing and Adoption Trends
- 12.3.9 Leading Suppliers and Competition
- 12.3.10 Regional Demand and Opportunities
- 12.4 By Application - Market Size and Forecast, 2025-2035
- 12.4.1 Segment Definition and Scope
- 12.4.2 Historical Market Size, 2018-2025
- 12.4.3 Revenue Forecast, 2025-2035
- 12.4.4 Volume Forecast, 2025-2035
- 12.4.5 Base-Year Market Share, 2025
- 12.4.6 Segment CAGR and Growth Drivers
- 12.4.7 Subsegment Market Size and Forecast
- 12.4.7.1 Films
- 12.4.7.2 Bottles
- 12.4.7.3 Fibers
- 12.4.7.4 Seed Coating
- 12.4.7.5 Vehicle Components
- 12.4.7.6 Medical Implants
- 12.4.7.7 Others
- 12.4.8 Subsegment Pricing and Adoption Trends
- 12.4.9 Leading Suppliers and Competition
- 12.4.10 Regional Demand and Opportunities
- 12.5 By End User - Market Size and Forecast, 2025-2035
- 12.5.1 Segment Definition and Scope
- 12.5.2 Historical Market Size, 2018-2025
- 12.5.3 Revenue Forecast, 2025-2035
- 12.5.4 Volume Forecast, 2025-2035
- 12.5.5 Base-Year Market Share, 2025
- 12.5.6 Segment CAGR and Growth Drivers
- 12.5.7 Subsegment Market Size and Forecast
- 12.5.7.1 Packaging
- 12.5.7.2 Textiles
- 12.5.7.3 Consumer Goods
- 12.5.7.4 Automotive & Transportation
- 12.5.7.5 Agriculture & Horticulture
- 12.5.7.6 Others
- 12.5.8 Subsegment Pricing and Adoption Trends
- 12.5.9 Leading Suppliers and Competition
- 12.5.10 Regional Demand and Opportunities
- 12.6 Segment Growth Comparison
- 12.7 Segment Attractiveness and Priority Matrix
Chapter 13 Global Biopolymers End-Use and Application Market Outlook
- 13.1 End-Use Industry and Customer Demand Structure
- 13.2 Leading Applications and Customer Groups
- 13.3 End-Use Market Size, Share and Forecast
- 13.4 Major End-Use Industry Deep Dives
- 13.4.1 Customer Requirements and Use Cases
- 13.4.2 Demand and Replacement Cycles
- 13.4.3 Technical and Regulatory Considerations
- 13.4.4 Purchasing and Procurement Models
- 13.4.5 Leading Vendors and Distribution Channels
- 13.4.6 Forecast and Commercial Opportunities
- 13.5 Emerging Applications and Cross-Segment Demand
- 13.6 End-Use Industry Investment Priorities
Chapter 14 Global Biopolymers Geographic Market Outlook, 2025-2035
- 14.1 Regional Market Size and Share, 2025
- 14.2 Regional Market Forecast, 2025-2035
- 14.3 Regional Pricing, Production and Demand Differences
- 14.4 North America
- 14.4.1 United States
- 14.4.2 Canada
- 14.4.3 Mexico
- 14.5 Europe
- 14.5.1 Germany
- 14.5.2 France
- 14.5.3 Italy
- 14.5.4 United Kingdom
- 14.5.5 Spain
- 14.5.6 Poland
- 14.5.7 Russia
- 14.5.8 Netherlands
- 14.5.9 Belgium
- 14.5.10 Sweden
- 14.5.11 Denmark
- 14.5.12 Norway
- 14.5.13 Rest of Europe
- 14.6 Asia Pacific
- 14.6.1 China
- 14.6.2 India
- 14.6.3 Japan
- 14.6.4 South Korea
- 14.6.5 Thailand
- 14.6.6 Indonesia
- 14.6.7 Vietnam
- 14.6.8 Malaysia
- 14.6.9 Australia
- 14.6.10 Rest of Asia Pacific
- 14.7 Latin America
- 14.7.1 Brazil
- 14.7.2 Argentina
- 14.7.3 Colombia
- 14.7.4 Chile
- 14.7.5 Rest of Latin America
- 14.8 Middle East
- 14.8.1 Saudi Arabia
- 14.8.2 United Arab Emirates
- 14.8.3 Turkey
- 14.8.4 Israel
- 14.8.5 Iran
- 14.8.6 Rest of the Middle East
- 14.9 Africa
- 14.9.1 South Africa
- 14.9.2 Egypt
- 14.9.3 Nigeria
- 14.9.4 Morocco
- 14.9.5 Rest of Africa
- 14.10 Regional Investment, Policy and Supply Chain Differences
- 14.11 Regional Competitive Landscape
- 14.12 Geographic Growth Hotspots
Chapter 15 Global Biopolymers Technology, Innovation and Sustainability Outlook
- 15.1 Technology Landscape and Maturity
- 15.2 Product, Process and Service Innovation
- 15.3 AI, Automation and Digital Tools in the Industry
- 15.4 Technology Adoption and Performance Benchmarking
- 15.5 Innovation Pipeline and R&D Investment
- 15.6 Patent and Intellectual Property Trends
- 15.7 Energy Efficiency and Resource Management
- 15.8 Sustainability, Recycling and Circularity
- 15.9 Technology Roadmap, 2025-2035
- 15.10 Risks of Obsolescence and Technology Substitution
Chapter 16 Global Biopolymers Market Key Strategic Imperatives
- 16.1 Growth and Market Entry Priorities
- 16.2 High-Return Products and Segments
- 16.3 Pricing, Profitability and Cost Optimization
- 16.4 Technology Investment and Product Differentiation
- 16.5 Supply Chain Localization and Resilience
- 16.6 Distribution and Customer Acquisition
- 16.7 Partnership, Acquisition and Capacity Strategy
- 16.8 Regional Expansion Priorities
- 16.9 Short-, Medium- and Long-Term Actions
Chapter 17 Competition Outlook
- 17.1 Industry Competition Characteristics
- 17.2 Market Structure and Concentration
- 17.3 Market Share and Competitive Positioning, 2025
- 17.4 Company-Wise Revenue and Product Benchmarking
- 17.5 Production and Service Capacity Benchmarking
- 17.6 Technology, Pricing and Differentiation
- 17.7 Regional Footprint and Distribution Strength
- 17.8 Mergers, Acquisitions and Strategic Alliances
- 17.9 New Entrants and Competitive Threats
- 17.10 Porter's Five Forces and Industry Attractiveness
- 17.11 Competitive Outlook, 2025-2035
Chapter 18 Company Profiles
- 18.1 Company Coverage and Selection Criteria
- 18.2 NatureWorks LLC
- 18.2.1 Business Description
- 18.2.2 Company Ownership and Geographic Presence
- 18.2.3 Product and Service Portfolio
- 18.2.4 Manufacturing and Operating Footprint
- 18.2.5 Production Capacity and Expansion Plans
- 18.2.6 Financial Performance and Investment
- 18.2.7 Market Share and Competitive Position
- 18.2.8 Technology and Innovation Capabilities
- 18.2.9 Strategic Alliances or Partnerships
- 18.2.10 Recent Developments
- 18.2.11 Growth Strategy and Outlook
- 18.3 TotalEnergies Corbion
- 18.4 Braskem S.A.
- 18.5 BASF SE
- 18.6 Versalis S.p.A. (Novamont, Eni)
- 18.7 Kaneka Corporation
- 18.8 Arkema S.A.
- 18.9 Teknor Apex Company (Danimer Scientific)
- 18.10 Huafon Group (Covation Biomaterials)
- 18.11 Evonik Industries AG
- 18.12 Avantium N.V.
- 18.13 Eastman Chemical Company
- 18.14 Other Relevant Market Participants
Note: Every listed company is profiled on the structure shown under the first company. The company list is preliminary and may change based on research findings, market developments, data availability and client requirements.
Chapter 19 Disclaimer
- 19.1 Research and Forecast Disclaimer
- 19.2 Data Source and Estimation Limitations
Note: The depth of individual sections depends on data availability for this market. Volume, capacity, trade and other unit-based metrics are included where applicable.

