
Cloud and AI halls set power conversion spending in Brazil
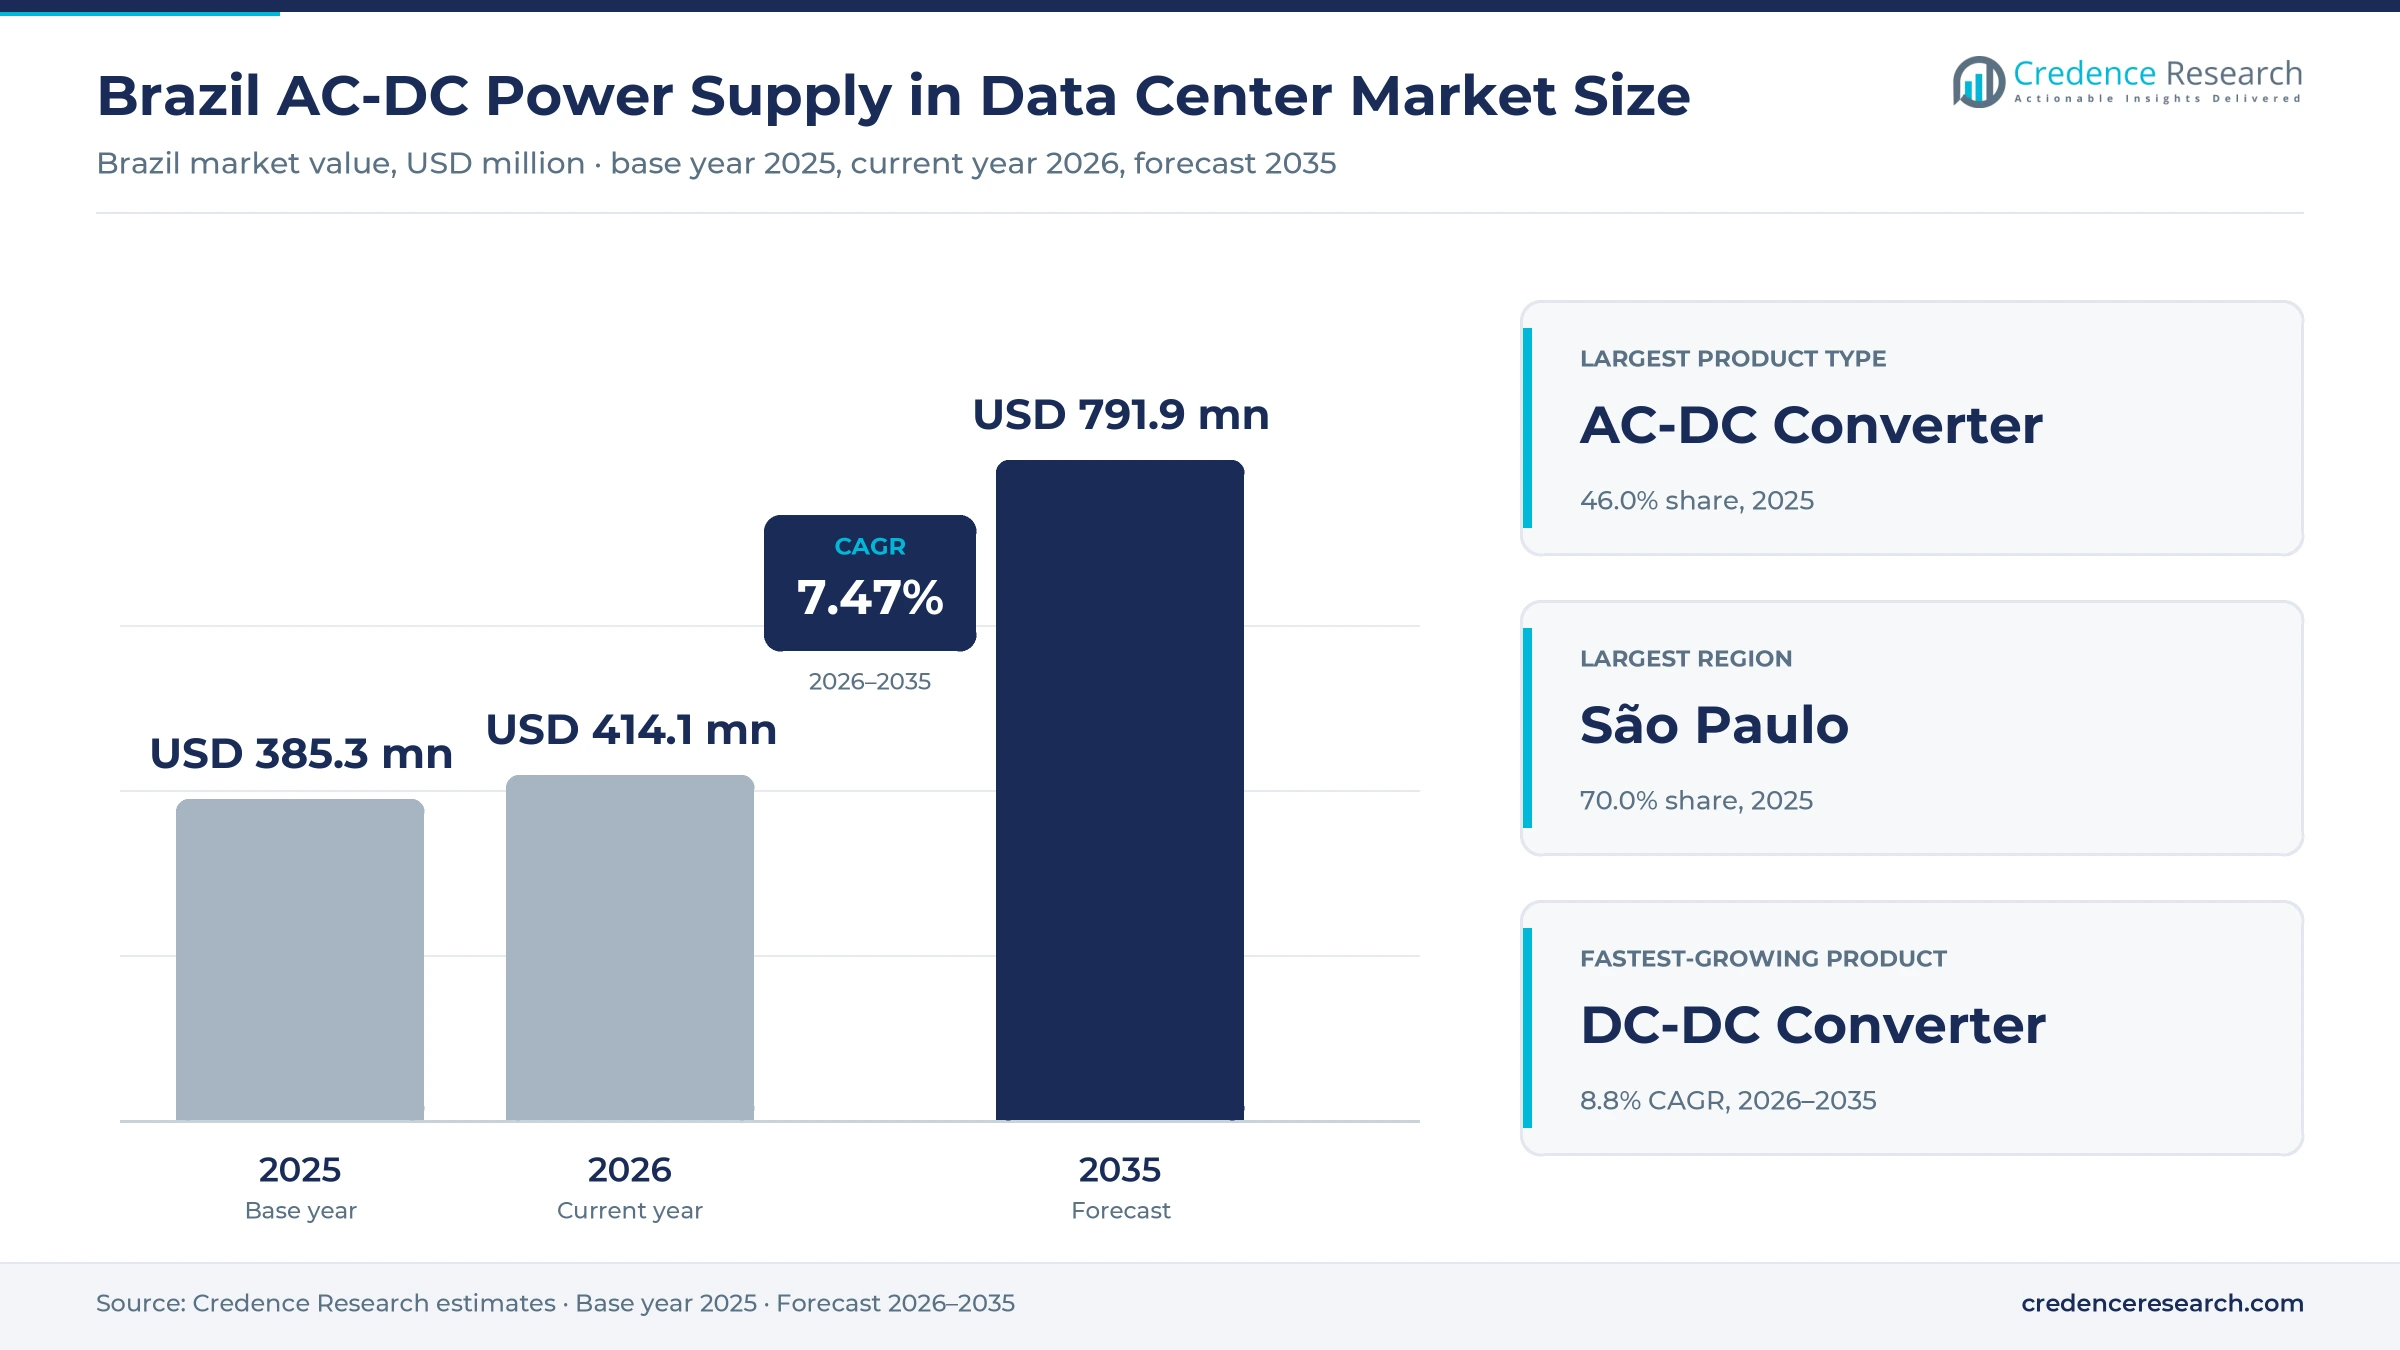
The Brazil AC-DC power supply in data center market was valued at USD 385.3 million in 2025 and is projected to increase from USD 414.1 million in 2026 to USD 791.9 million by 2035, registering a CAGR of 7.47% during 2026–2035. Demand comes from hyperscale cloud providers and colocation operators that fit out new halls around São Paulo, from banks, telecom groups and government agencies that run their own server rooms, and from AI campuses now planned in the South and Northeast. São Paulo held the largest regional share, 70.0% in 2025, because the Barueri, Campinas and Santana de Parnaíba clusters host most installed IT load. Northeast is the fastest-growing region, as a large social media data center at Pecém moves toward operation in 2027. AI racks are pushing buyers from single-phase rack power supplies toward high-voltage DC distribution, modular three-phase UPS frames and board-level DC-DC conversion.
Server converters, UPS frames and DC stages make up the count
The market counts the value of power conversion equipment installed in Brazilian data centers. It covers AC-DC converters such as redundant server and rack power supplies, DC-DC converters that step bus voltage down to processors and storage, and uninterruptible power supply systems from rack-mounted units to modular three-phase frames that protect whole halls.
Standby generators, medium-voltage switchgear, cabling and cooling equipment are excluded, although they decide how much conversion capacity a hall needs. Power supplies built into servers are counted at their component value, which is why the estimate exceeds the value of data center UPS alone. Value moves from global power makers and Brazilian UPS manufacturers through distributors, server assemblers and electrical integrators to colocation operators, cloud providers and enterprises.
Brazil AC-DC Power Supply in Data Center Market Insights
- The Brazil AC-DC power supply in data center market rises from USD 385.3 million in 2025 to USD 791.9 million by 2035, a 7.47% CAGR during 2026–2035, as cloud and AI halls open.
- São Paulo held 70.0% of 2025 value, because the state hosts 168 of the 554 data centers that Cetic.br mapped in Brazil in 2025.
- AC-DC Converter led with 46.0% of 2025 value, because every server ships with redundant power supplies and data processing equipment accounts for 70% to 80% of data center installation costs, according to Cetic.br.
- Brazil enacted Law 15,504 on Sept. 15, 2026, creating the Redata tax regime for data center equipment, with the list of eligible products still to be set by regulation.
- The national grid operator ONS allocated 228 MW of transmission capacity to three São Paulo data center projects in October 2026, against 451 MW of qualified demand.
Product, power band and buyer splits favor AI-ready gear
Server converters lead while DC-DC stages grow fastest
Based on product type, the market is categorized into AC-DC converter, DC-DC converter and UPS systems. AC-DC Converter led with 46.0% of 2025 value because each server carries at least two hot-swap power supplies, and data processing equipment accounts for 70% to 80% of data center installation costs, according to Cetic.br. DC-DC Converter grows fastest at 8.8% a year, as AI racks move conversion closer to the chip, and NVIDIA said in August 2026 that row power centers delivering up to 2 MW of high-voltage DC power per row are due in 2027.
Mid-power units lead as hall-scale frames grow faster
Based on power rating, the market is categorized into less than 500W, 500W to 1000W, 1000W to 10kW, 10kW to 50kW, and more than 50kW. 1000W to 10kW led with 38.0% of 2025 value because it spans both redundant server power supplies and rack-mounted UPS units, and national retailer Kabum listed NHS and TS Shara online UPS models in this band in November 2026. More Than 50kW grows fastest at 8.7% a year, as Ascenty began building its Sumaré 3 hall in March 2026, a pre-leased AI site that needs hall-scale modular frames.
IT companies lead while public agencies grow fastest
Based on end user, the market is categorized into government & healthcare, IT industry, telecommunication industry and others. IT Industry led with 54.0% of 2025 value because cloud providers and colocation operators fit out most new halls, and AWS planned R$10.1 billion through 2034 for São Paulo data centers, Teletime reported in September 2024. Government & Healthcare grows fastest at 8.0% a year, as Serpro received GPUs, servers and sovereign cloud appliances from AWS and Google for its Brasília government cloud between October and December 2024, Serpro said in February 2025.
| Segment Group | Leading Sub-segment | Share, 2025 | Fastest-growing Sub-segment | CAGR, 2026–2035 |
|---|---|---|---|---|
| By Product Type | AC-DC Converter | 46.0% | DC-DC Converter | 8.8% |
| By Power Rating | 1000W to 10kW | 38.0% | More Than 50kW | 8.7% |
| By End User | IT Industry | 54.0% | Government & Healthcare | 8.0% |
Watt ratings and topology set conversion equipment prices
Power conversion equipment in Brazil is priced per unit for rack products and per kilowatt for hall-scale UPS frames, with installation, batteries and service contracts quoted separately. Retail listings for online double-conversion units show that local brands compete hard below 10 kVA. Server power supplies are bought inside server contracts, so their price follows server assemblers and import duties. Large operators tender whole halls and press unit prices down, while suppliers earn better margins on modular frames, lithium batteries and multiyear maintenance.
| Offer or input | Typical price or fee | Basis |
|---|---|---|
| NHS Nsys Série K online UPS, 3 kVA | R$3,699.99 cash price | Kabum retail listing, November 2026 |
| TS Shara Syal In double-conversion UPS, 5 kVA | R$7,339.90 cash price | Kabum retail listing, November 2026 |
| NHS Nsys Série K online UPS, 10 kVA | R$13,799.60 cash price | Kabum retail listing, November 2026 |
| Redundant hot-swap server power supply, 1.4 kW to 3.2 kW | USD 150 to USD 450 per unit | Credence Research estimate from vendor list prices |
| Modular three-phase UPS for a new hall | USD 150 to USD 250 per kW installed | Credence Research estimate from tender and list price inputs |
Request a Free Sample
Fill in your details and we'll send you a free sample report.
- Sample data tables & charts
- Research methodology
Cloud pledges, AI campuses and tax relief lift demand
Hyperscale cloud pledges expand server power demand
Cloud providers are committing multiyear budgets to São Paulo campuses, and every new server rack they fill brings redundant power supplies and UPS capacity with it. Microsoft announced R$14.7 billion over three years in September 2024 for new cloud and AI capacity across several campuses in São Paulo state, the company said. Ascenty said in May 2026 that it will invest US$1.2 billion in new complexes in Sumaré and Vinhedo with at least 150 MW of initial capacity, all of it pre-leased to global technology companies. These pre-leased halls give converter and UPS suppliers visible order books into 2027, which favors makers with hyperscale design approvals.
AI campus approvals open multigigawatt power pipelines
Government approvals for very large AI campuses are turning concept projects into long-dated demand for conversion equipment outside São Paulo. The Ministry of Mines and Energy authorized a 5 GW energy reservation for Scala AI City in Eldorado do Sul in May 2025, with a first phase of 54 MW of IT capacity, the Rio Grande do Sul government said. TikTok confirmed its Pecém data center in December 2025 with more than R$200 billion planned, including R$108 billion for high-tech equipment through 2035, TikTok said. Elea announced a Rio AI City concept of up to 3.2 GW in May 2025. These are plans and early phases rather than energized halls, so suppliers book only first-phase volumes now.
Redata tax relief lowers the cost of imported hardware
Brazil now offers a dedicated tax regime that cuts the cost of equipment for data centers that serve the domestic market. Law 15,504, sanctioned on Sept. 15, 2026, suspends PIS/Pasep, Cofins, IPI and import tax on ICT products bought for data centers that run fully on renewable or low-emission power, invest the equivalent of 2% of the value of those purchases in Brazil and reserve at least 10% of capacity for the domestic market, although the IPI, PIS/Pasep and Cofins relief runs only to Dec. 31, 2026, because of tax reform. About 60% of national digital loads are served from abroad, Cetic.br reported in December 2025. Whether UPS and power supplies sit on the eligible list is still open, which is an evidence gap for converter pricing.
Grid outages keep UPS ride-through a design requirement
Repeated distribution failures in Greater São Paulo keep operators specifying long UPS autonomy and redundant power paths, even in halls fed from the transmission grid. A storm on Dec. 10, 2025, interrupted supply to about 4.4 million Enel customers, double the peak figure first reported, the company told the regulator Aneel. Field crews had to restore about 3.2 million of those customers by hand, which lengthened the outages. The federal government then sought early termination of the concession, after similar multiday blackouts in November 2023 and October 2024. Energy is the largest operating cost of a hall, so buyers want ride-through without efficiency losses, which favors lithium-ion UPS and high-efficiency modes.
Higher-voltage racks and modular UPS reshape purchases
Higher-voltage racks shift conversion toward DC stages
AI hall designers are shifting from AC power supplies in each server toward high-voltage DC distribution with DC-DC conversion near the accelerator. NVIDIA plans an MGX-compatible 800 VDC power rack for the second half of 2026 and row power centers of up to 2 MW per row in 2027, NVIDIA said. Ascenty's Sumaré 3 hall will use direct-to-chip liquid cooling at the rack, the kind of dense AI hall these power racks target. NVIDIA says more than 80 equipment makers and infrastructure companies are building products to its 800 VDC specification. Suppliers with 800 VDC shelves and board-level converters gain, while makers of standard 1U server power supplies face slower unit growth.
Modular, high-efficiency UPS frames replace legacy towers
Operators are shifting from fixed tower UPS units toward modular frames with lithium batteries and high-efficiency operating modes, because energy dominates operating costs. Schneider Electric says its Galaxy VXL reaches up to 97.5% efficiency in double conversion and 99% in eConversion mode, in a footprint 52% below the industry average, according to its Brazilian blog in July 2026. Engetron, Saft and Stulz agreed in January 2025 to sell joint packages of modular IoT UPS, lithium and nickel-cadmium batteries and cooling. ABB won its first Latin American contracts for a new UPS line in May 2026, BNamericas reported. Each efficiency point now carries more weight in hyperscale and colocation tenders.
Northeast and southern campuses open new supply routes
AI campuses planned far from São Paulo give power suppliers an opening to build stock, service crews and distribution in regions they barely served before. The Energy Research Company counts 26.3 GW of data center grid access requests through 2038, the U.S. International Trade Administration noted in January 2026. Tecto, the data center unit of V.tal, plans to invest R$200 million in a Porto Alegre site, Teletime reported in January 2026, and already runs three data centers in Fortaleza. Vertiv signed MAXID in April 2026 as master distributor, with inventory consolidated in Brazil. Suppliers holding local stock near Fortaleza and Porto Alegre can shorten lead times.
Government cloud rebuilds open public power tenders
Federal IT agencies need new halls for sovereign cloud and tax reform systems, which creates public tenders for UPS and conversion equipment outside the hyperscale channel. Serpro already runs two sovereign cloud zones in Brasília and plans two new data centers, one in Brasília and one in São Paulo, and its president estimated about R$1 billion for each initial build and R$3 billion to R$4 billion over ten years, Convergência Digital reported in February 2026. The Brasília build is ready to start at the Biotic campus, while the São Paulo project is still in design. The tax reform system must run fully in 2027, so the schedule is fixed. Suppliers with public procurement experience and local service teams are best placed.
Grid queues, imports and direct DC limit supplier upside
Grid connection queues delay hall energization
Converter and UPS orders follow hall energization, so transmission queues push supplier revenue into later years. In the first competitive access round in October 2026, seven qualified São Paulo projects sought 451 MW at four connection points, and ONS could allocate only 228 MW, Cenário Energia reported. Projects that lost the round must wait for later seasons or new substations. Suppliers holding stock for planned São Paulo halls are most exposed if energization dates slip.
Import dependence exposes prices to currency swings
Most conversion hardware is imported, so swings in the real pass quickly into tender prices and project budgets. Cetic.br notes that most data processing equipment is imported and that operating in Brazil costs about 30% more than abroad, mainly because of taxes on ICT equipment. The short window for part of the Redata relief noted above adds pricing uncertainty for importers. Distributors and smaller integrators that buy in dollars and sell in reais carry the most risk.
Direct DC architectures could bypass rack converters
High-voltage DC designs remove conversion stages that today use separate AC-DC power supplies in every server. Ascenty's Sumaré 3 hall, due in the third quarter of 2027, shows the kind of dense AI site that may adopt these designs, which would cut unit demand for server power supplies. Makers of standard AC-DC power supplies for 1U and 2U servers are most exposed.
Crowded UPS ranges squeeze small-unit margins
Single-phase UPS units below 10 kVA face crowded local competition, which caps margins in enterprise and edge rooms. Engetron, NHS, TS Shara, Intelbras, Delta and Vertiv all sell online double-conversion units, and Kabum lists 3 kVA to 10 kVA online models from R$3,699.99 to R$13,799.60. Buyers compare models on price and delivery, so brands without service networks lose on small orders.
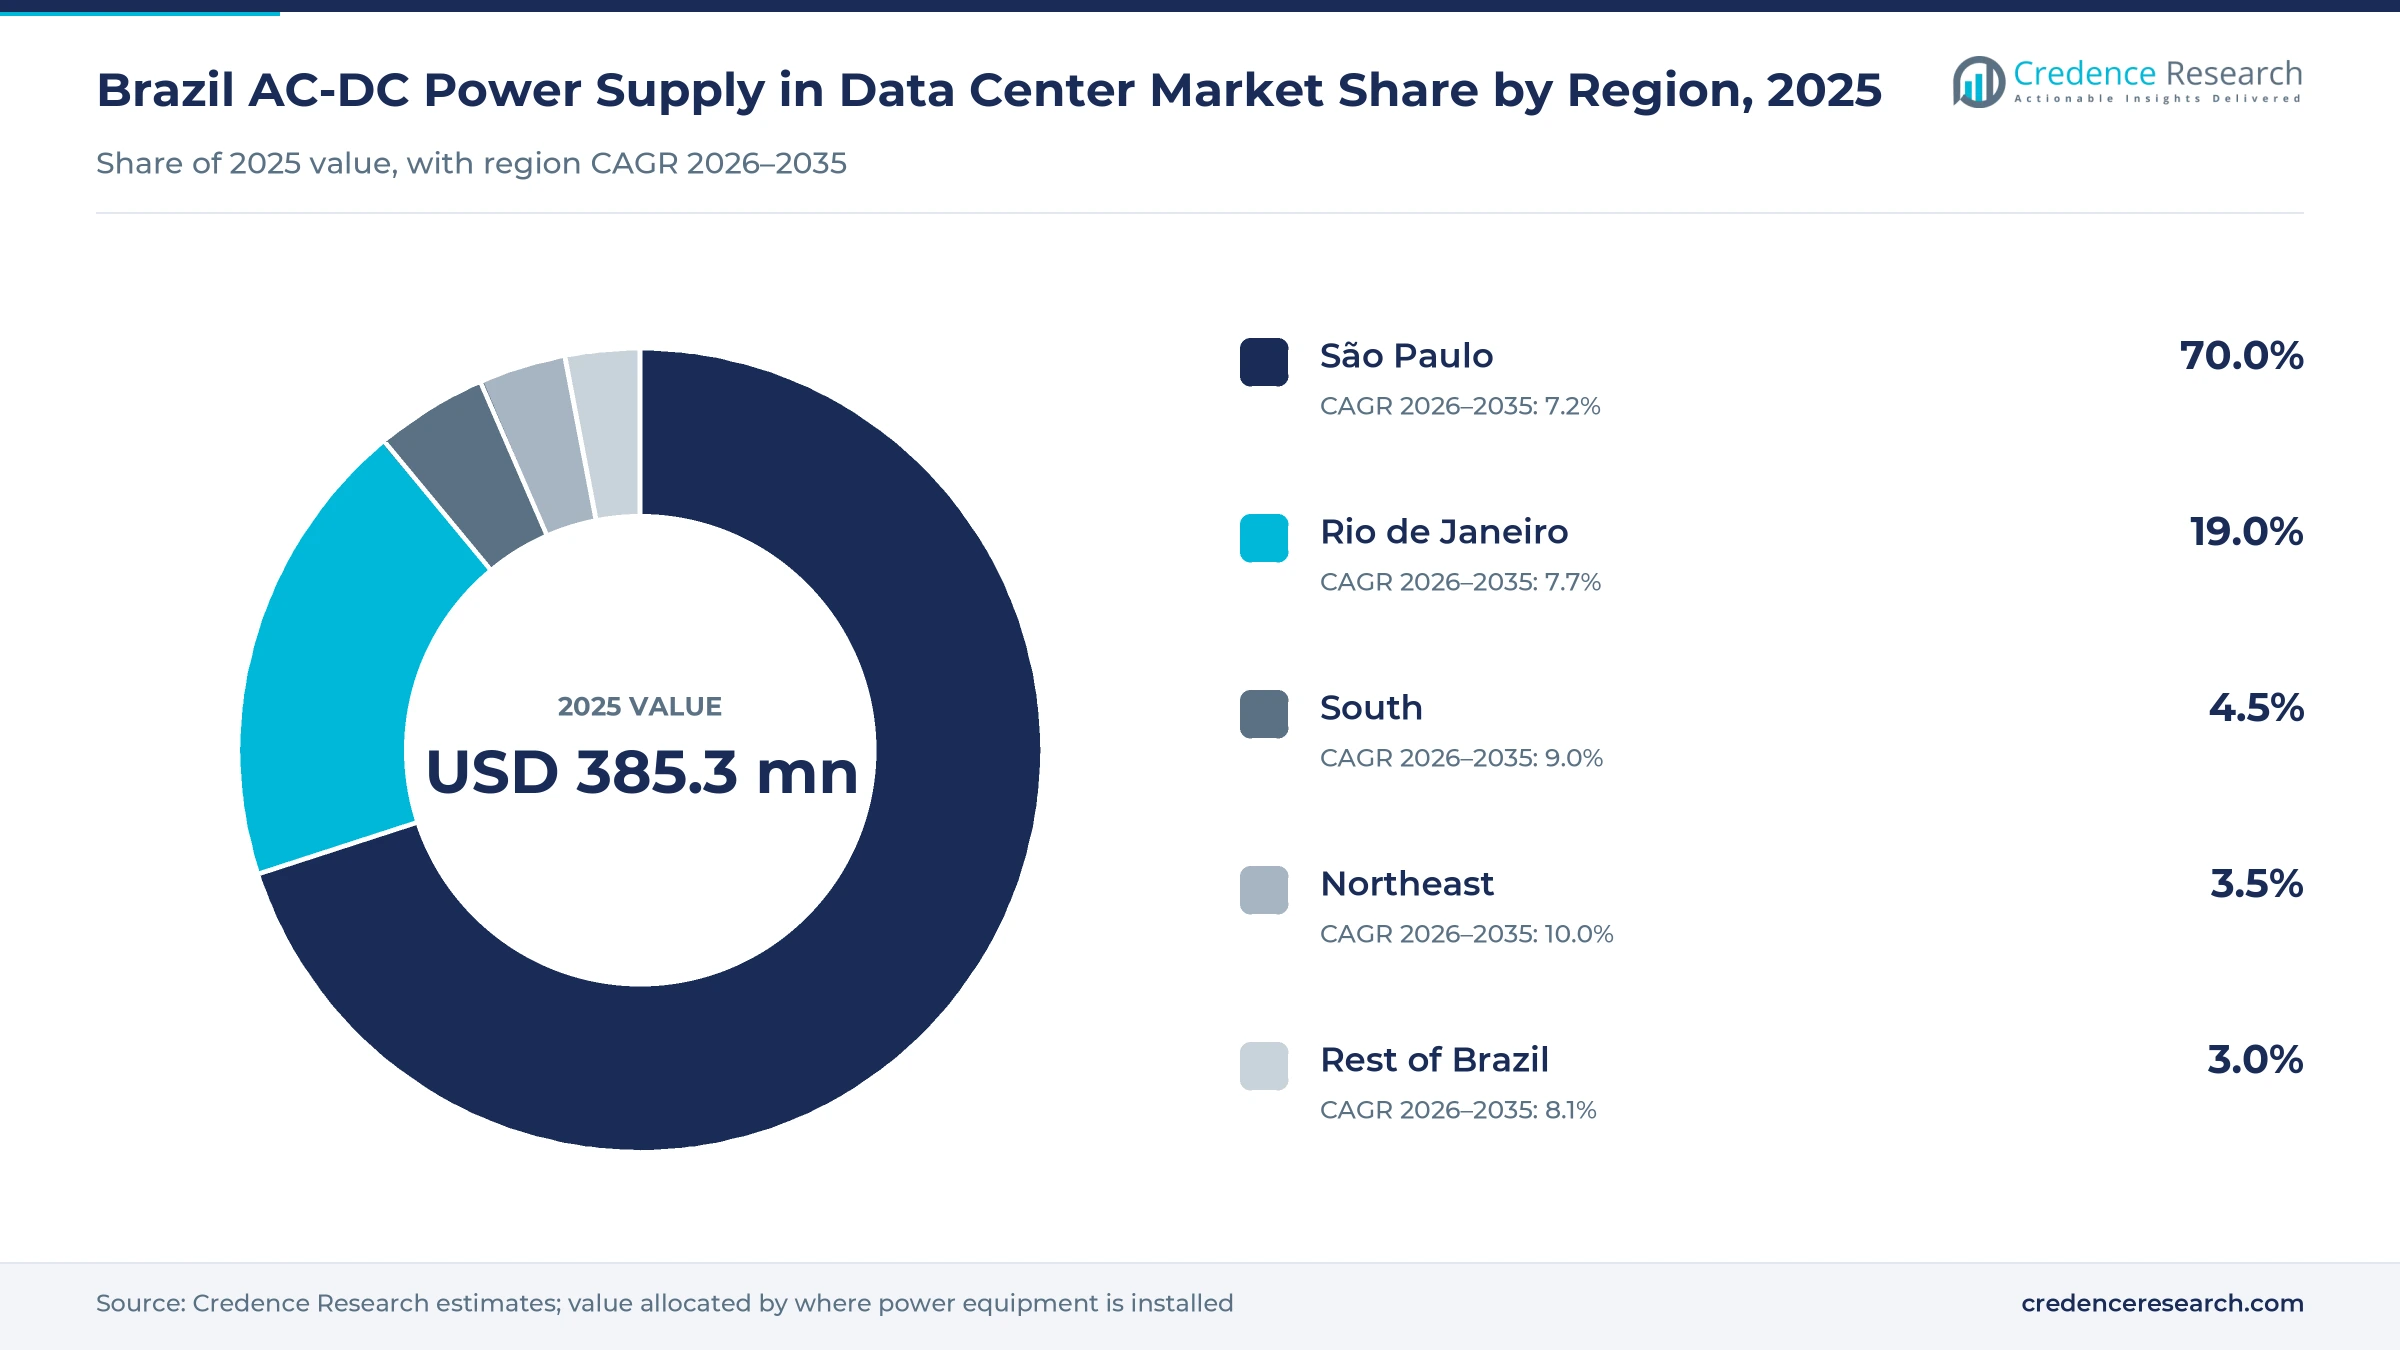
São Paulo buys most as the Northeast adds AI campuses
| Region | Value, 2025 (USD million) | Share, 2025 | CAGR, 2026–2035 |
|---|---|---|---|
| São Paulo | 269.7 | 70.0% | 7.2% |
| Rio de Janeiro | 73.2 | 19.0% | 7.7% |
| South | 17.3 | 4.5% | 8.9% |
| Northeast | 13.5 | 3.5% | 9.9% |
| Rest of Brazil | 11.6 | 3.0% | 8.1% |
São Paulo leads through Barueri and Campinas clusters
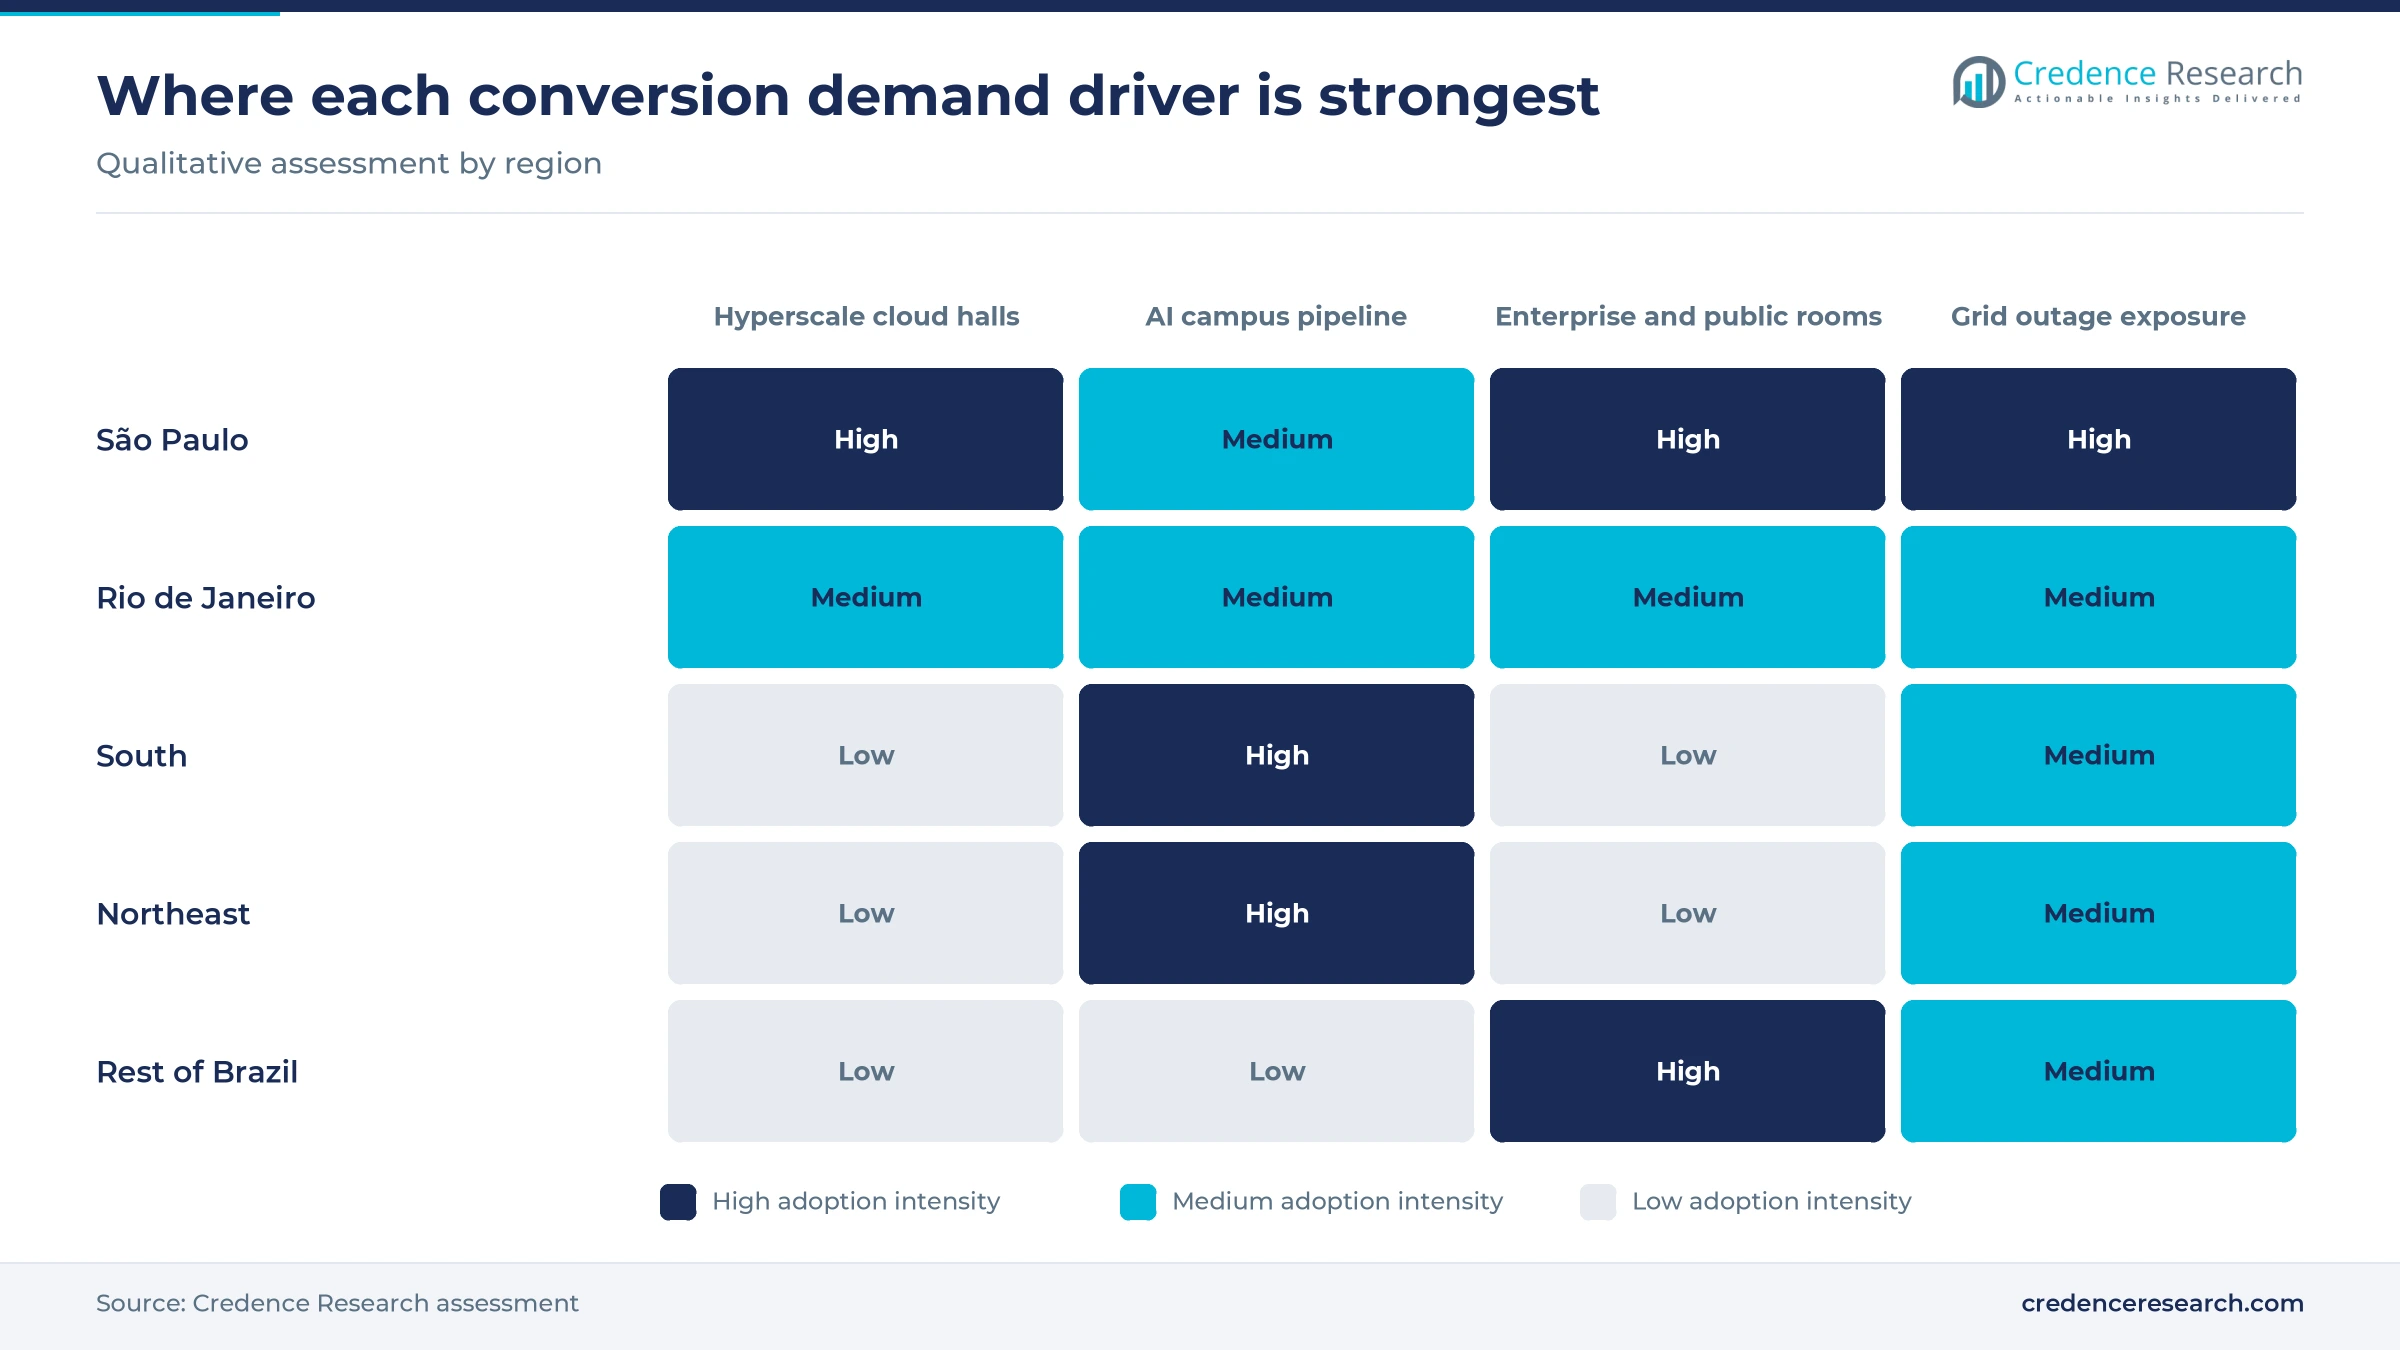
São Paulo held 70.0% of 2025 value and grows at 7.2% a year through 2035. Cetic.br mapped 168 of 554 Brazilian data centers in the state in 2025, most of them in the capital metropolitan area. Tecto plans up to 200 MW at its TGRU1 site in Santana de Parnaíba, and Ascenty is building in Sumaré and Vinhedo. This flow of new halls keeps the state the main buyer of server converters and large UPS fleets.
Rio de Janeiro grows from cloud and AI campus plans
Rio de Janeiro held 19.0% of 2025 value and grows at 7.7% a year. Microsoft has run its Brazil Southeast cloud region from Rio de Janeiro since 2020, and Brasscom says more than 90% of national processing capacity sits on the Rio de Janeiro and São Paulo axis. Elea's Rio AI City remains a concept of up to 3.2 GW, so Credence Research models only modest early phases. Tecto also runs one Rio data center, which keeps demand for power gear and precision air conditioning in Rio steady.
The South grows on the Scala AI City first phase
The South held 4.5% of 2025 value and grows at 8.9% a year. The 54 MW first phase of Scala AI City in Eldorado do Sul, backed by the energy reservation noted above, is the largest single source of new demand in the region. Tecto's Porto Alegre site adds a smaller interconnection hall linked to a subsea cable, DCD reported in January 2026. Credence Research treats later Scala phases as upside, because their timing depends on grid reinforcement and tenant contracts.
The Northeast grows fastest as Pecém moves to operation
The Northeast held 3.5% of 2025 value and is the fastest-growing region at 9.9% a year. TikTok expects initial operations at Pecém in 2027 on power from new wind farms built for the project, with Omnia and Casa dos Ventos as partners. Tecto opened its largest Fortaleza data center in October 2025, Teletime reported. Credence Research expects suppliers to expand service crews in Ceará, because hall-scale UPS frames there would otherwise be maintained from São Paulo.
Rest of Brazil relies on Brasília and Belém projects
Rest of Brazil held 3.0% of 2025 value and grows at 8.1% a year. Brasília hosts Serpro's two sovereign cloud zones and the Biotic campus, where Banco do Brasil and Caixa run data centers. Elea plans a 7.5 MW AI data center in Belém for the second quarter of 2027, with R$250 million for the first phase and room for 100 MW, Teletime reported in June 2026. Demand here comes mostly from public, banking and regional cloud halls.
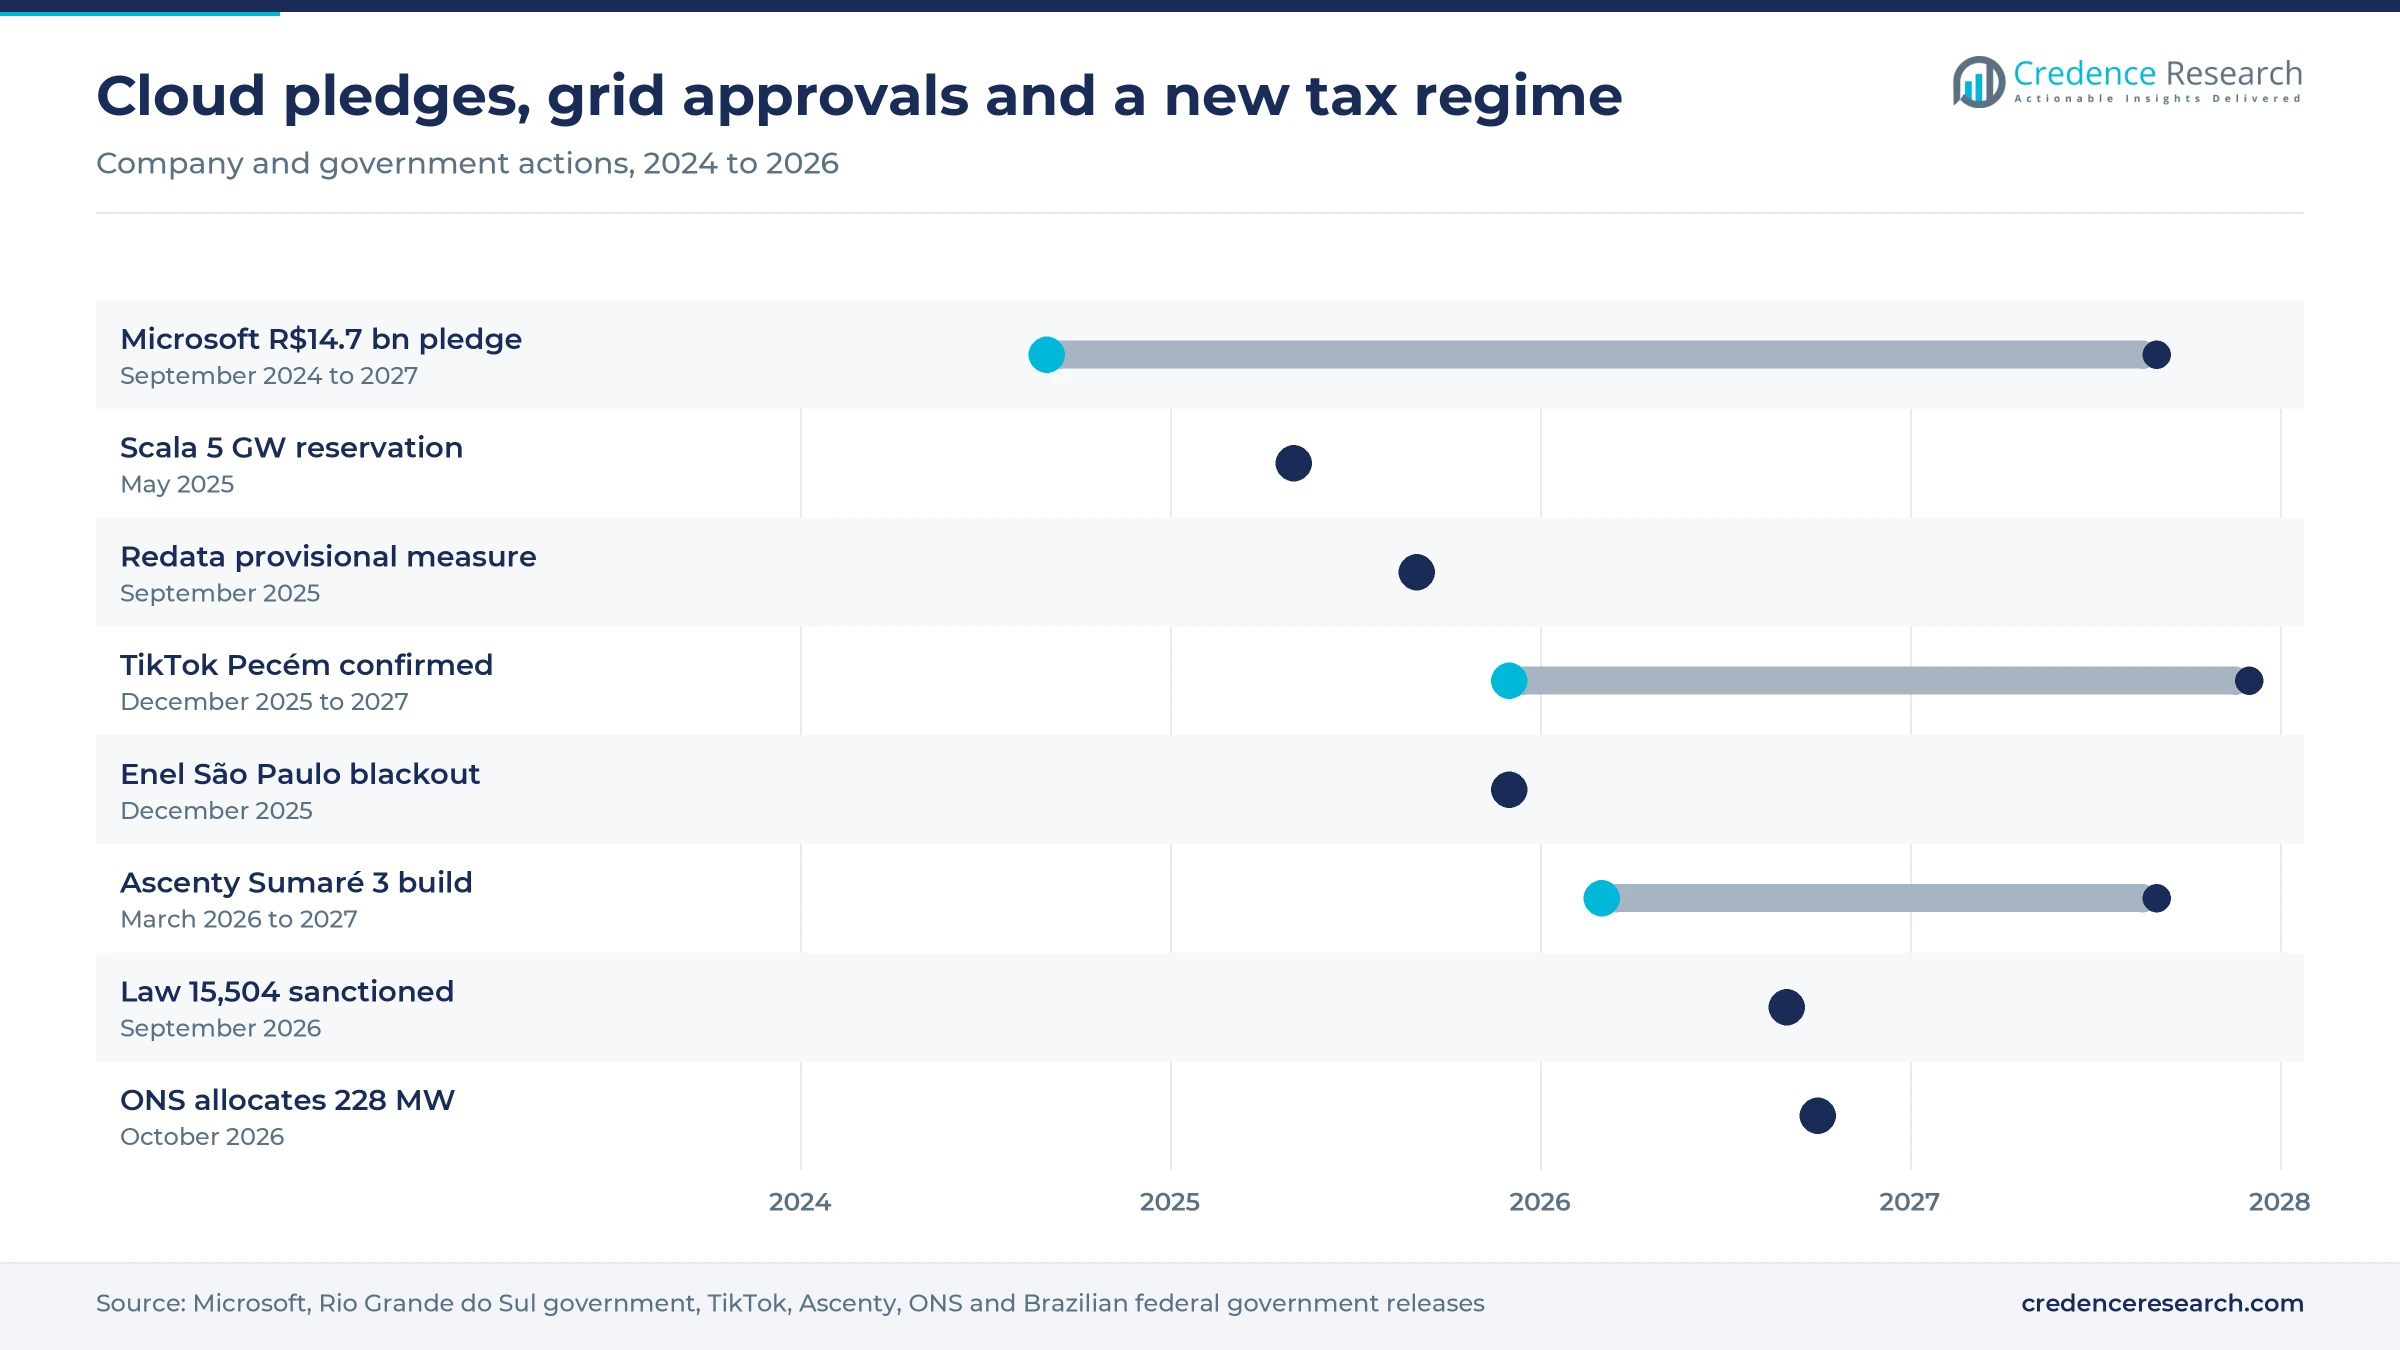
Cloud pledges, grid approvals and a new tax regime
| Development | Status and market relevance |
|---|---|
| In September 2024, Microsoft announced R$14.7 billion over three years for cloud and AI infrastructure across campuses in São Paulo state. | Investment commitment; spending runs through 2027. |
| In May 2025, the Ministry of Mines and Energy authorized a 5 GW energy reservation for Scala AI City in Eldorado do Sul. | Approval; first phase of 54 MW of IT capacity planned. |
| In December 2025, TikTok confirmed its first Latin American data center at Pecém, with more than R$200 billion planned. | Announcement; initial operations expected in 2027. |
| In May 2026, Ascenty announced US$1.2 billion for new complexes in Sumaré and Vinhedo with at least 150 MW of capacity. | Under construction; Sumaré 3 completion expected in the third quarter of 2027. |
| In September 2026, Brazil sanctioned Law 15,504, creating the Redata tax regime for data center equipment. | Law enacted; eligible product list and habilitation rules pending regulation. |
High-voltage DC racks, lithium UPS and smart rectifiers
- High-voltage DC power racks distribute high-voltage direct current along a row, which removes AC conversion stages inside each AI server rack.
- 48-volt rack shelves feed servers through a shared busbar, which cuts the number of separate power supplies per rack and raises conversion efficiency.
- Lithium-ion modular UPS replaces lead-acid strings with smaller battery cabinets and hot-swap power modules, which suits halls that add load in phases.
- Monitored smart rectifiers report load, temperature and battery health to operators remotely, which helps telecom and edge rooms outside large cities.
Need a Custom Version of This Report?
Tailor the scope, geography, or segments to your exact requirements.
- Custom geography or segment scope
- Direct access to our analyst team
Global power makers compete with Brazilian UPS brands
Competition in the Brazil AC-DC power supply in data center market splits between global power makers and Brazilian UPS brands. Schneider Electric promotes its Galaxy VXL frame to Brazilian buyers, while Vertiv sells power and thermal systems through MAXID, its master distributor since April 2026. Delta Electronics lists Amplon tower units and Modulon modular UPS ranges on its Brazilian site, and ABB won its first Latin American contracts for a new UPS line in May 2026. Engetron pairs modular IoT UPS with Saft batteries and Stulz cooling, and NHS sells online units through national retailers. Buyers judge suppliers on efficiency at partial load, lithium battery options, delivery lead times and national service coverage.
How is the supply side organized?
The supply side serving Brazilian buyers runs in three distinct tiers. Global power makers, led by Schneider Electric, Vertiv, Eaton, ABB and Delta Electronics, sell hall-scale UPS frames and power systems to hyperscale and colocation operators. Brazilian manufacturers such as Engetron and NHS, and Legrand through its SMS brand, compete strongly in rack and room UPS for enterprises and telecom sites. Server power supplies reach the market inside servers assembled by Lenovo in Indaiatuba, Positivo and imported brands. Entry barriers sit in hyperscale design approvals and national service coverage.
Power conversion suppliers buyers shortlist in Brazil
| Company | Type | Role in the market |
|---|---|---|
| Schneider Electric | Full-line supplier | Sells Galaxy three-phase UPS frames and rack UPS for data center halls |
| Vertiv | Full-line supplier | Supplies UPS, power management and thermal systems through master distributor MAXID |
| Eaton | Full-line supplier | Sells 9395-series three-phase UPS and power distribution for data centers |
| Delta Electronics | Power electronics maker | Lists Amplon tower UPS, Modulon modular UPS and server power supplies |
| ABB | Full-line supplier | Sells MegaFlex UPS and won first Latin American contracts for a new line |
| Huawei | Digital power supplier | Sells SmartLi lithium UPS and modular power systems for data centers |
| Legrand | Full-line supplier | Sells Keor UPS and SMS-branded UPS units for IT rooms |
| Engetron | Brazilian UPS maker | Builds modular IoT UPS and partners with Saft and Stulz on data centers |
| NHS | Brazilian UPS maker | Sells Nsys Série K online double-conversion UPS through national retailers |
| Advanced Energy | Power supply specialist | Designs AC-DC power supplies and power shelves for servers and racks |
Conversion architecture will decide value per megawatt
Credence Research's view is that conversion architecture, not the number of new halls, will decide how much value the market adds by 2035. Server AC-DC converters lead today because every rack still converts power inside each server, yet AI halls are moving toward high-voltage DC rows and board-level DC-DC stages that change which components buyers order. Grid access will set the pace of São Paulo halls through 2030, while Pecém and Scala decide regional upside. Suppliers with modular UPS, DC power shelves and national service teams should gain the most share.
Estimates rest on load, price and project disclosures
The report uses 2025 as the base year and 2026 to 2035 as the forecast period. The 2025 value brings the earlier Credence Research estimate for 2023 forward at its own growth rate and was checked against installed IT load, new hall announcements, redundant power supply counts and UPS prices. Market values come from the Credence Research model, and the regional, product type, power rating and end user splits are Credence Research estimates informed by public data. Sources include Cetic.br, the Ministry of Mines and Energy, ONS and EPE releases, Brasscom material, company announcements, retailer listings and Brazilian business publishers. No interviews or surveys were used to build these estimates.
Grid access and AI hall timing shape value to 2035
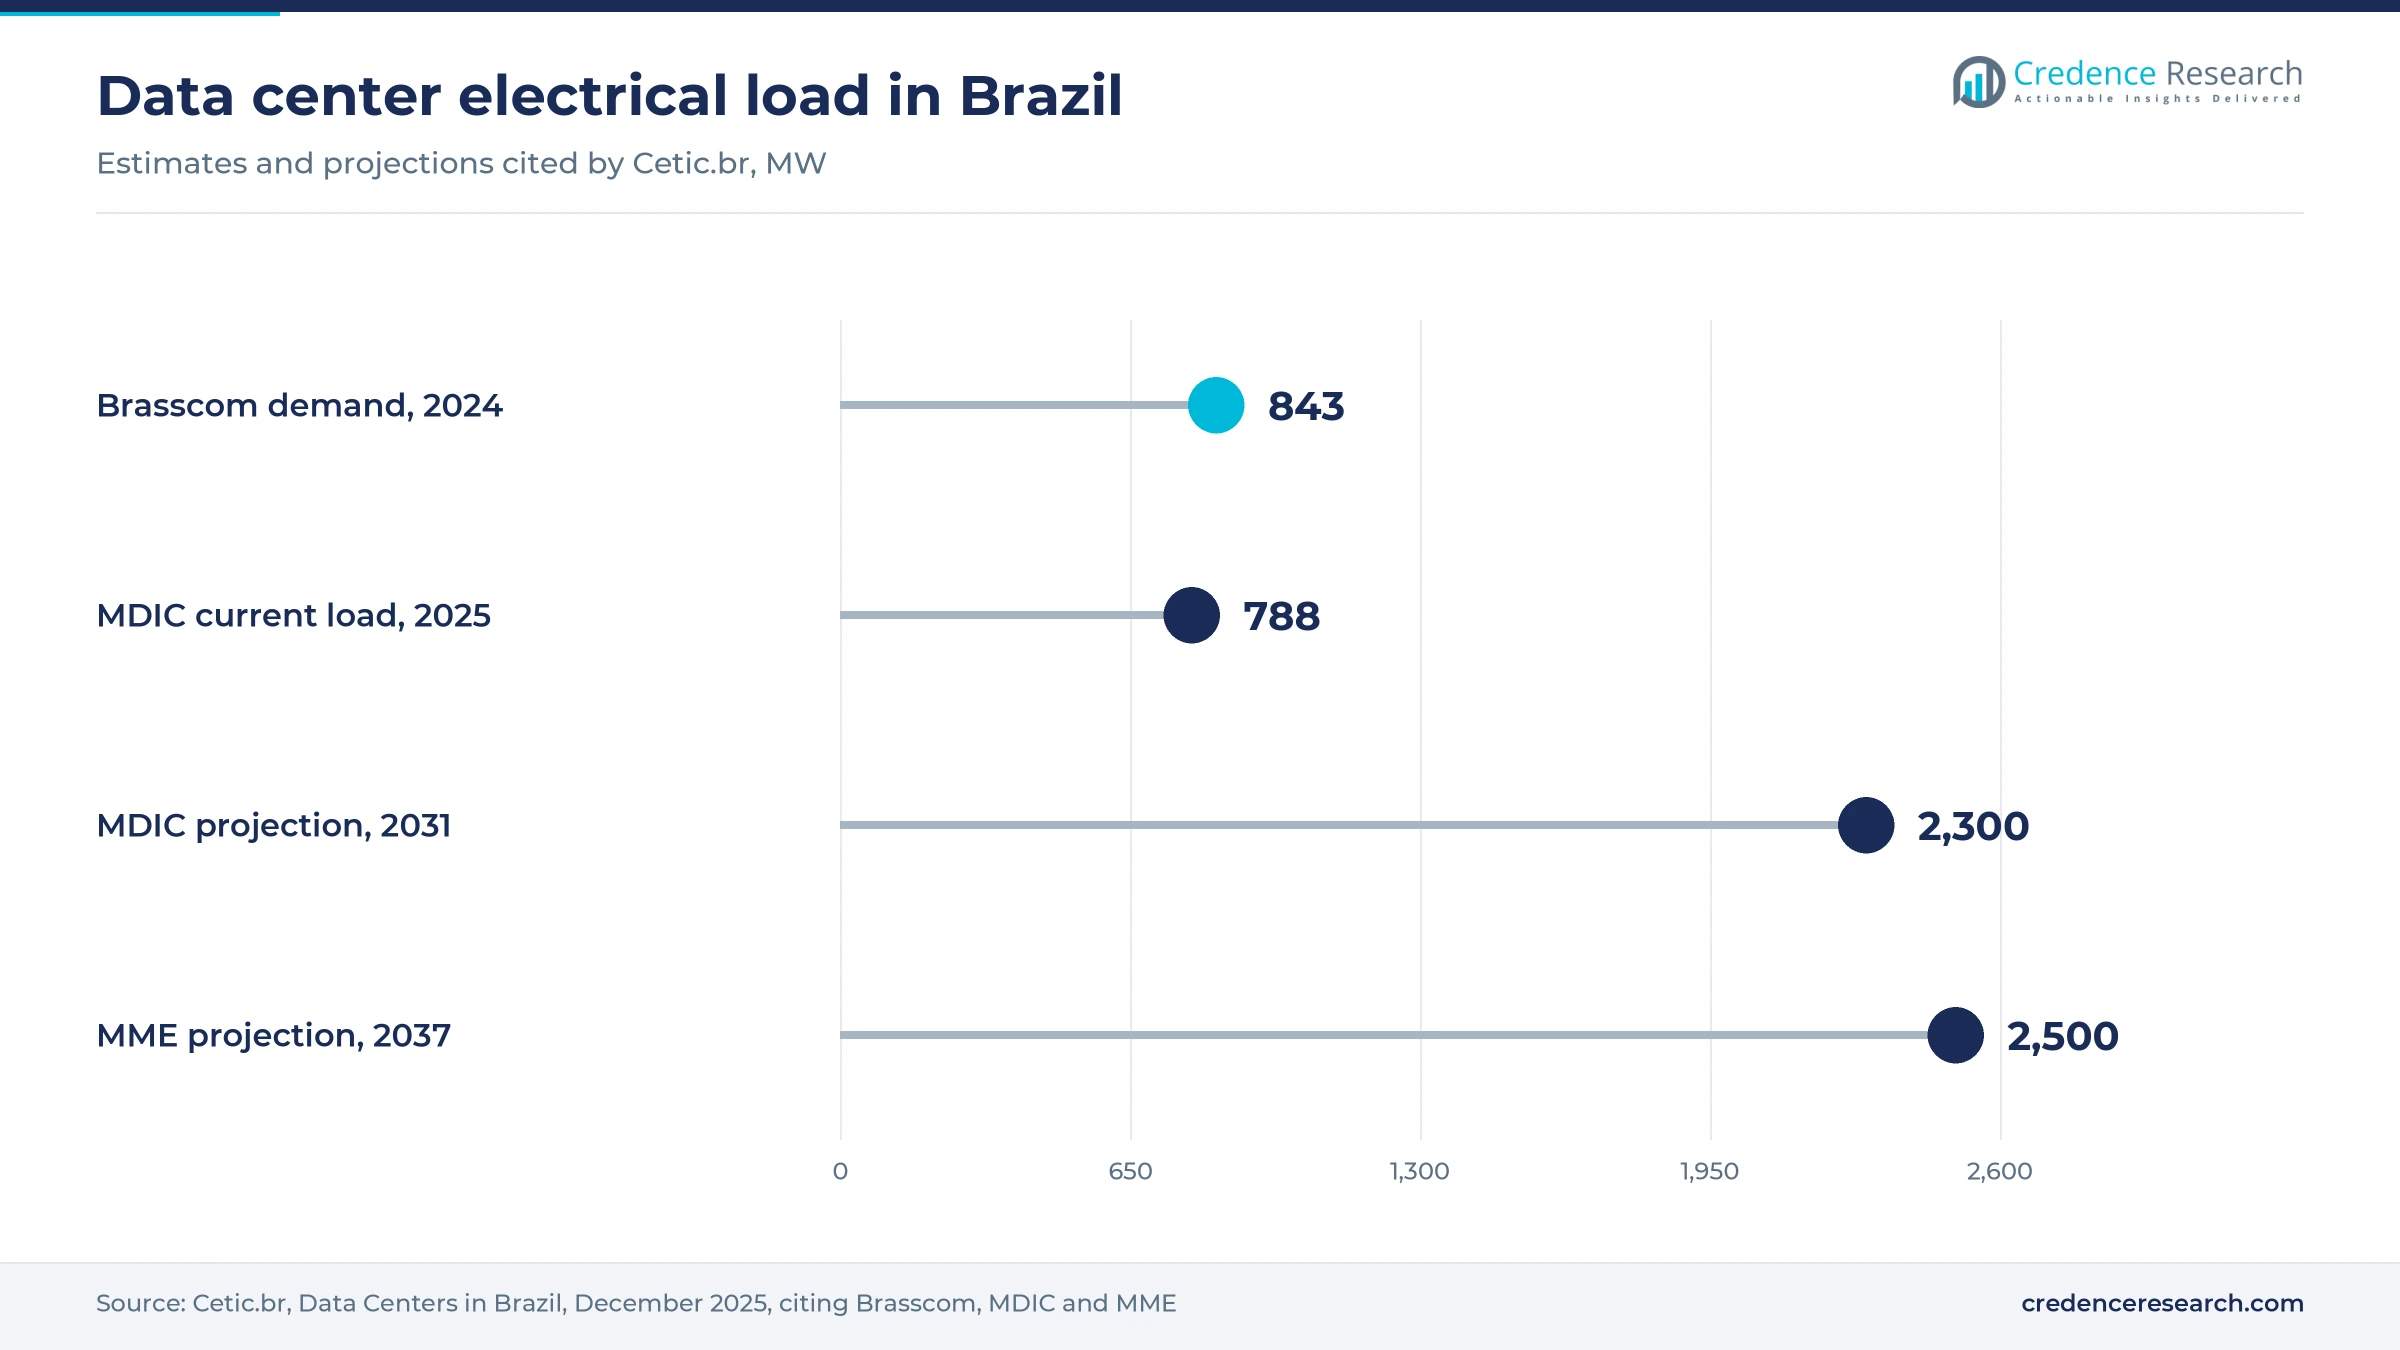
Credence Research expects conversion equipment value to reach USD 791.9 million by 2035 as pre-leased São Paulo halls, the Pecém campus and the first Scala phase move from approvals to energized load. Brasscom projects installed IT capacity rising from 481 MW in March 2024 to 1.6 GW by 2029. Northeast should keep the fastest pace, while São Paulo remains the largest source of value. DC-DC converters grow at 8.8% a year during 2026–2035 as AI racks spread, and the Northeast gains share from its 3.5% base in 2025. The main risks are grid queues and direct DC designs, while Redata regulation offers upside.
Grid access and AI hall timing set the range
The range to 2035 depends mainly on how many requested megawatts win grid access and on how quickly AI halls adopt high-voltage DC racks. Pre-leased São Paulo halls support every case, but transmission rounds decide how many new halls energize each year. Redata regulation adds upside if power equipment becomes eligible, while a weaker real would raise imported hardware prices and slow enterprise projects in every case.
| Scenario | CAGR, 2026–2035 | Value, 2035 | What has to hold |
|---|---|---|---|
| Downside | 5.0% | USD 640.7 million | Grid rounds allocate little new capacity and AI halls skip rack AC-DC stages early |
| Base | 7.47% | USD 791.9 million | Ascenty, Tecto, Microsoft and AWS complete announced São Paulo phases broadly on schedule |
| Upside | 10.0% | USD 974.0 million | Pecém and Scala first phases open on time and Redata covers power equipment |
Frequently Asked Questions
How big is the Brazil AC-DC power supply in data center market?
How much data center computing power capacity does Brazil have?
Which product type leads in Brazil?
What do data center UPS units cost in Brazil?
Which region leads demand for power conversion equipment?
How does the Redata law affect equipment buyers?
What are the main challenges for suppliers?
Who are the main companies in this market?
Table of Content
Chapter 1 Market Segmentation
- 1.1 Segmentation Framework
- 1.1.1 Product and Service Classification
- 1.1.2 Application and End-Use Classification
- 1.1.3 Technology and Solution Classification
- 1.1.4 Customer and Distribution Channel Classification
- 1.1.5 Geographic Segmentation
- 1.1.6 Market Segment Definitions and Boundaries
- 1.2 By Product Type
- 1.2.1 AC-DC Converter
- 1.2.2 UPS Systems
- 1.2.3 DC-DC Converter
- 1.3 By Power Rating
- 1.3.1 Less Than 500W
- 1.3.2 500W to 1000W
- 1.3.3 1000W to 10kW
- 1.3.4 10kW to 50kW
- 1.3.5 More Than 50kW
- 1.4 By End User
- 1.4.1 IT Industry
- 1.4.2 Telecommunication Industry
- 1.4.3 Government & Healthcare
- 1.4.4 Others
Chapter 2 Introduction
- 2.1 Report Objectives and Scope
- 2.2 Product Definition and Industry Terminology
- 2.3 Market Inclusions and Exclusions
- 2.4 Research Process
- 2.4.1 Primary Research and Expert Interviews
- 2.4.2 Secondary Research and Source Review
- 2.4.3 Top-Down and Bottom-Up Estimation
- 2.4.4 Data Triangulation and Verification
- 2.5 Market Size Measurement Basis
- 2.5.1 2025: USD 385.3 million → 2035: USD 791.9 million
- 2.6 Historical and Forecast Reference Periods
- 2.6.1 Historical Period: 2018-2025
- 2.6.2 Base Year: 2025
- 2.6.3 Forecast Period: 2025-2035
- 2.7 Research Assumptions and Limitations
Chapter 3 Executive Summary
- 3.1 Market Snapshot and Key Findings
- 3.2 Base-Year Market Size, 2025
- 3.3 Forecast Market Size, 2035
- 3.4 Revenue and Volume Growth Outlook
- 3.5 Key Demand and Supply Indicators
- 3.6 Leading Market Segments
- 3.7 Fastest-Growing Market Opportunities
- 3.8 Regional Performance Highlights
- 3.9 Technology and Industry Transformation
- 3.10 Competitive Landscape Summary
- 3.11 Analyst View and Strategic Implications
Chapter 4 Brazil AC-DC Power Supply in Data Center Market Trends and Developments
- 4.1 Historical Industry Development, 2018-2025
- 4.2 Recent Market Trends and Developments
- 4.3 Demand and Customer Behavior Trends
- 4.4 Technology and Product Innovation
- 4.5 Artificial Intelligence, Automation and Digitalization
- 4.6 Local Manufacturing and Supply Chain Realignment
- 4.7 Industry Partnerships, Mergers and Acquisitions
- 4.8 Sustainability and Circular Economy Developments
- 4.9 Government and Private Sector Investment Trends
- 4.10 Emerging Business Models and Commercialization
- 4.11 Industry Developments and Announcements
Chapter 5 Brazil AC-DC Power Supply in Data Center Market Production, Supply and Demand Analysis
- 5.1 Demand Trend and Consumption Analysis, 2018-2025
- 5.2 Demand Forecast, 2025-2035
- 5.3 Production and Output Trend, 2018-2025
- 5.4 Production and Output Forecast, 2025-2035
- 5.5 Installed Capacity and Capacity Utilization
- 5.6 Company-Wise Production Plants and Statistics
- 5.6.1 Installed Production Capacity
- 5.6.2 Actual Production
- 5.6.3 Planned Capacity and Expansion Targets
- 5.7 Supply Chain Structure and Procurement Trends
- 5.8 Supply-Demand Gap and Bottlenecks
- 5.9 Import Dependence and Sourcing Structure
- 5.10 Contract Manufacturing and Outsourcing
- 5.11 Regional Supply and Demand Concentration
Chapter 6 Brazil AC-DC Power Supply in Data Center Market Pricing Analysis
- 6.1 Pricing Structure and Measurement
- 6.2 Historical Pricing Trends, 2018-2025
- 6.3 Pricing Outlook, 2025-2035
- 6.4 Average Selling Price and Unit Economics
- 6.5 Pricing by Product and Market Segment
- 6.6 Geographic Pricing Differences
- 6.7 Key Input, Energy, Labor and Logistics Costs
- 6.8 Contract Pricing and Purchasing Models
- 6.9 Pricing Sensitivity and Competitive Positioning
- 6.10 Price, Margin and Profitability Implications
Chapter 7 Brazil AC-DC Power Supply in Data Center Market Dynamics
- 7.1 Market Growth Drivers
- 7.1.1 Demand-Side Drivers
- 7.1.2 Technology and Innovation Drivers
- 7.1.3 Infrastructure and Investment Drivers
- 7.1.4 Regulatory and Policy Drivers
- 7.2 Market Restraints
- 7.2.1 Cost and Affordability Constraints
- 7.2.2 Technology and Adoption Barriers
- 7.2.3 Supply Chain and Operational Constraints
- 7.3 Market Challenges
- 7.3.1 Competitive Pressure and Margin Erosion
- 7.3.2 Skills, Infrastructure and Implementation Gaps
- 7.4 Emerging Market Opportunities
- 7.5 Market Dynamics Impact and Time-Horizon Assessment
Chapter 8 Brazil AC-DC Power Supply in Data Center Value Chain Analysis
- 8.1 Industry Value Chain Overview
- 8.2 Upstream Suppliers and Critical Inputs
- 8.3 Technology and Component Providers
- 8.4 Manufacturing or Service Delivery
- 8.5 Distribution, Channel Partners and Integrators
- 8.6 Downstream Applications and End Users
- 8.7 Value Addition and Profit Pools
- 8.8 Vertical Integration and Outsourcing
- 8.9 Supplier Concentration and Risk
- 8.10 Supply Chain Localization and Resilience
Chapter 9 Brazil AC-DC Power Supply in Data Center Market Regulations and Policies
- 9.1 Relevant Laws, Standards and Compliance Frameworks
- 9.2 Product, Service, Safety and Quality Requirements
- 9.3 Government Policies, Incentives and Subsidies
- 9.4 Imports, Exports and Trade Barriers
- 9.5 Public Procurement and Local Content Requirements
- 9.6 Environmental and Sustainability Compliance
- 9.7 Upcoming Policy Changes and Market Implications
Chapter 10 Brazil AC-DC Power Supply in Data Center Market Hotspots and Opportunities
- 10.1 Market Opportunity Mapping and Growth Hotspots
- 10.2 High-Growth Applications and Customer Groups
- 10.3 Underserved Markets and White-Space Opportunities
- 10.4 Emerging Technology and Product Opportunities
- 10.5 New Capacity and Investment Hotspots
- 10.6 Market Entry and Expansion Opportunities
- 10.7 Distribution and Partnership Opportunities
- 10.8 Near-Term and Long-Term Commercial Potential
- 10.9 Opportunity Attractiveness and Execution Risks
Chapter 11 Brazil AC-DC Power Supply in Data Center Market Outlook, 2025-2035
- 11.1 Market Size and Analysis
- 11.1.1 Revenue (Market Measurement: 2025: USD 385.3 million → 2035: USD 791.9 million)
- 11.1.2 Market Volume and Quantity Sold
- 11.1.3 Historical Market Size, 2018-2025
- 11.1.4 Base-Year Market Size, 2025
- 11.2 Market Forecast, 2025-2035
- 11.2.1 Revenue Forecast to 2035
- 11.2.2 Volume Forecast to 2035
- 11.2.3 CAGR and Year-on-Year Growth
- 11.2.4 Incremental Revenue Opportunity
- 11.3 Forecast Assumptions and Scenario Analysis
- 11.3.1 Base-Case Forecast
- 11.3.2 Optimistic and Conservative Scenarios
- 11.3.3 Technology, Pricing and Policy Sensitivities
- 11.4 Market Attractiveness and Growth Outlook
Chapter 12 Brazil AC-DC Power Supply in Data Center Market Segmentation and Outlook
- 12.1 Segmentation Summary and Market Shares, 2025
- 12.2 Largest and Fastest-Growing Segments
- 12.3 By Product Type - Market Size and Forecast, 2025-2035
- 12.3.1 Segment Definition and Scope
- 12.3.2 Historical Market Size, 2018-2025
- 12.3.3 Revenue Forecast, 2025-2035
- 12.3.4 Volume Forecast, 2025-2035
- 12.3.5 Base-Year Market Share, 2025
- 12.3.6 Segment CAGR and Growth Drivers
- 12.3.7 Subsegment Market Size and Forecast
- 12.3.7.1 AC-DC Converter
- 12.3.7.2 UPS Systems
- 12.3.7.3 DC-DC Converter
- 12.3.8 Subsegment Pricing and Adoption Trends
- 12.3.9 Leading Suppliers and Competition
- 12.3.10 Regional Demand and Opportunities
- 12.4 By Power Rating - Market Size and Forecast, 2025-2035
- 12.4.1 Segment Definition and Scope
- 12.4.2 Historical Market Size, 2018-2025
- 12.4.3 Revenue Forecast, 2025-2035
- 12.4.4 Volume Forecast, 2025-2035
- 12.4.5 Base-Year Market Share, 2025
- 12.4.6 Segment CAGR and Growth Drivers
- 12.4.7 Subsegment Market Size and Forecast
- 12.4.7.1 Less Than 500W
- 12.4.7.2 500W to 1000W
- 12.4.7.3 1000W to 10kW
- 12.4.7.4 10kW to 50kW
- 12.4.7.5 More Than 50kW
- 12.4.8 Subsegment Pricing and Adoption Trends
- 12.4.9 Leading Suppliers and Competition
- 12.4.10 Regional Demand and Opportunities
- 12.5 By End User - Market Size and Forecast, 2025-2035
- 12.5.1 Segment Definition and Scope
- 12.5.2 Historical Market Size, 2018-2025
- 12.5.3 Revenue Forecast, 2025-2035
- 12.5.4 Volume Forecast, 2025-2035
- 12.5.5 Base-Year Market Share, 2025
- 12.5.6 Segment CAGR and Growth Drivers
- 12.5.7 Subsegment Market Size and Forecast
- 12.5.7.1 IT Industry
- 12.5.7.2 Telecommunication Industry
- 12.5.7.3 Government & Healthcare
- 12.5.7.4 Others
- 12.5.8 Subsegment Pricing and Adoption Trends
- 12.5.9 Leading Suppliers and Competition
- 12.5.10 Regional Demand and Opportunities
- 12.6 Segment Growth Comparison
- 12.7 Segment Attractiveness and Priority Matrix
Chapter 13 Brazil AC-DC Power Supply in Data Center End-Use and Application Market Outlook
- 13.1 End-Use Industry and Customer Demand Structure
- 13.2 Leading Applications and Customer Groups
- 13.3 End-Use Market Size, Share and Forecast
- 13.4 Major End-Use Industry Deep Dives
- 13.4.1 Customer Requirements and Use Cases
- 13.4.2 Demand and Replacement Cycles
- 13.4.3 Technical and Regulatory Considerations
- 13.4.4 Purchasing and Procurement Models
- 13.4.5 Leading Vendors and Distribution Channels
- 13.4.6 Forecast and Commercial Opportunities
- 13.5 Emerging Applications and Cross-Segment Demand
- 13.6 End-Use Industry Investment Priorities
Chapter 14 Brazil AC-DC Power Supply in Data Center Geographic Market Outlook, 2025-2035
- 14.1 Domestic Market Distribution and Demand Clusters
- 14.2 State- or Province-Wise Market Size and Forecast, 2025-2035
- 14.3 City and Metropolitan Market Outlook
- 14.4 Industrial, Manufacturing and Commercial Clusters
- 14.5 Geographic Concentration of Key End Users
- 14.6 Local Pricing and Purchasing Differences
- 14.7 Domestic Production Facilities and Capacity Map
- 14.8 Local Infrastructure and Project Pipeline
- 14.9 State-Level Policy and Incentive Differences
- 14.10 Subnational Investment Hotspots and Opportunities
- 14.11 Distribution and Logistics Networks
- 14.12 Domestic Competitive Footprint
Chapter 15 Brazil AC-DC Power Supply in Data Center Technology, Innovation and Sustainability Outlook
- 15.1 Technology Landscape and Maturity
- 15.2 Product, Process and Service Innovation
- 15.3 AI, Automation and Digital Tools in the Industry
- 15.4 Technology Adoption and Performance Benchmarking
- 15.5 Innovation Pipeline and R&D Investment
- 15.6 Patent and Intellectual Property Trends
- 15.7 Energy Efficiency and Resource Management
- 15.8 Sustainability, Recycling and Circularity
- 15.9 Technology Roadmap, 2025-2035
- 15.10 Risks of Obsolescence and Technology Substitution
Chapter 16 Brazil AC-DC Power Supply in Data Center Market Key Strategic Imperatives
- 16.1 Growth and Market Entry Priorities
- 16.2 High-Return Products and Segments
- 16.3 Pricing, Profitability and Cost Optimization
- 16.4 Technology Investment and Product Differentiation
- 16.5 Supply Chain Localization and Resilience
- 16.6 Distribution and Customer Acquisition
- 16.7 Partnership, Acquisition and Capacity Strategy
- 16.8 Regional Expansion Priorities
- 16.9 Short-, Medium- and Long-Term Actions
Chapter 17 Competition Outlook
- 17.1 Industry Competition Characteristics
- 17.2 Market Structure and Concentration
- 17.3 Market Share and Competitive Positioning, 2025
- 17.4 Company-Wise Revenue and Product Benchmarking
- 17.5 Production and Service Capacity Benchmarking
- 17.6 Technology, Pricing and Differentiation
- 17.7 Regional Footprint and Distribution Strength
- 17.8 Mergers, Acquisitions and Strategic Alliances
- 17.9 New Entrants and Competitive Threats
- 17.10 Porter's Five Forces and Industry Attractiveness
- 17.11 Competitive Outlook, 2025-2035
Chapter 18 Company Profiles
- 18.1 Company Coverage and Selection Criteria
- 18.2 Schneider Electric
- 18.2.1 Business Description
- 18.2.2 Company Ownership and Geographic Presence
- 18.2.3 Product and Service Portfolio
- 18.2.4 Manufacturing and Operating Footprint
- 18.2.5 Production Capacity and Expansion Plans
- 18.2.6 Financial Performance and Investment
- 18.2.7 Market Share and Competitive Position
- 18.2.8 Technology and Innovation Capabilities
- 18.2.9 Strategic Alliances or Partnerships
- 18.2.10 Recent Developments
- 18.2.11 Growth Strategy and Outlook
- 18.3 Vertiv
- 18.4 Eaton
- 18.5 Delta Electronics
- 18.6 ABB
- 18.7 Huawei
- 18.8 Legrand
- 18.9 Engetron
- 18.10 NHS
- 18.11 Advanced Energy
- 18.12 Other Relevant Market Participants
Note: Every listed company is profiled on the structure shown under the first company. The company list is preliminary and may change based on research findings, market developments, data availability and client requirements.
Chapter 19 Disclaimer
- 19.1 Research and Forecast Disclaimer
- 19.2 Data Source and Estimation Limitations
Note: The depth of individual sections depends on data availability for this market. Volume, capacity, trade and other unit-based metrics are included where applicable.

