Breast Implant Market Overview:
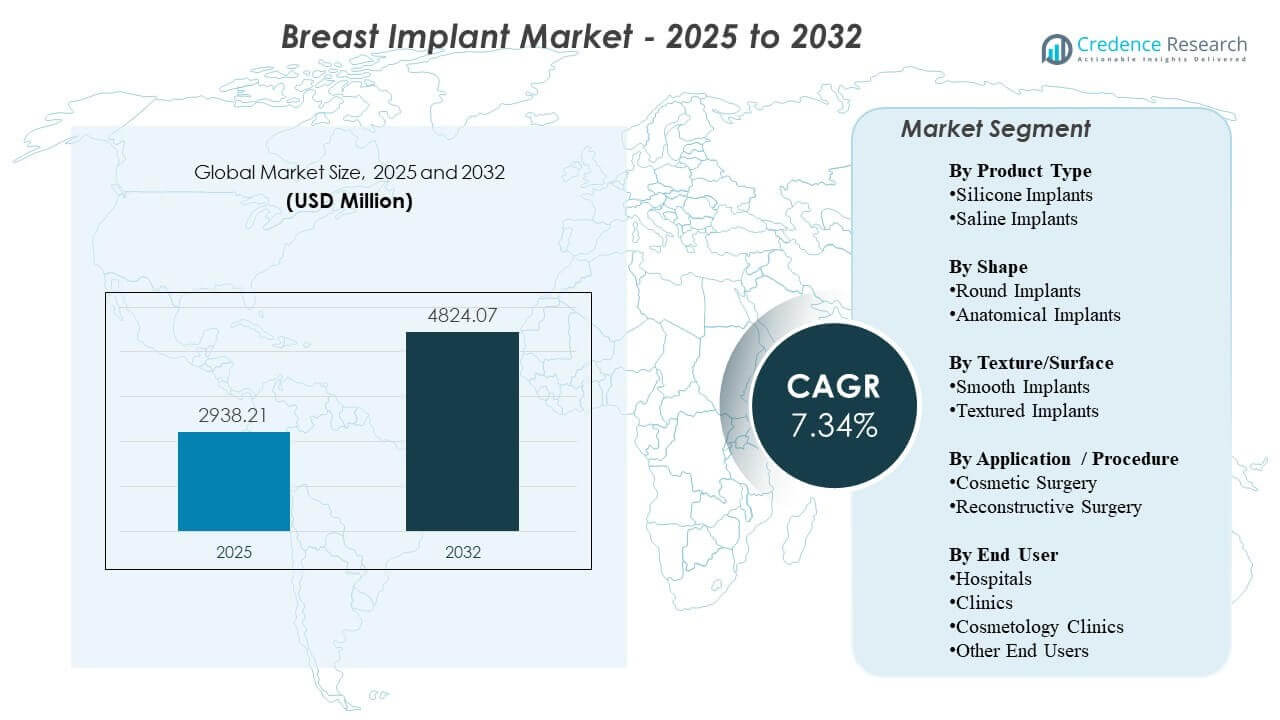
The global Breast Implant Market size was estimated at USD 2,938.21 million in 2025 and is expected to reach USD 4,824.07 million by 2032, growing at a CAGR of 7.34% from 2025 to 2032. Demand is primarily supported by sustained procedure volumes across elective augmentation and post-mastectomy reconstruction, alongside wider acceptance of aesthetic interventions and improving access to specialist surgical care. Ongoing product innovation in cohesive gel performance, implant design, and surgical technique refinement continues to reinforce patient and surgeon confidence, with North America and Europe remaining important revenue centers due to mature provider ecosystems and established care pathways.
| REPORT ATTRIBUTE |
DETAILS |
| Historical Period |
2020-2024 |
| Base Year |
2025 |
| Forecast Period |
2026-2032 |
| Breast Implants Market Size 2025 |
USD 2,938.21 million |
| Breast Implants Market, CAGR |
7.34% |
| Breast Implants Market Size 2032 |
USD 4,824.07 million |
Key Market Trends & Insights
- North America accounted for 35.9% share in 2025, supported by higher procedure volumes and established specialist infrastructure.
- Silicone implants accounted for ~86.2% share in 2025, reflecting strong preference for natural look-and-feel and broad surgeon familiarity.
- Round implants held ~83.3% share in 2025, driven by predictable aesthetics and wide suitability across patient profiles.
- Cosmetic surgery represented ~76.6% share in 2025, supported by elective demand and growing customization expectations in augmentation.
- Hospitals captured ~48.1% share in 2025, reflecting concentration of reconstructive cases and peri-operative capabilities.
Segment Analysis
Market segmentation indicates a structurally strong tilt toward established implant configurations and high-volume elective procedures. Silicone remains the dominant product category because it aligns closely with patient expectations around appearance and tactile outcomes, while round shapes continue to lead due to predictable results and broad availability across size and profile ranges. These dynamics are reinforced by surgeon comfort with standard protocols and a wide installed base of brands and product families supporting repeatable outcomes.
Across care settings, hospital systems remain central to demand due to their role in complex reconstruction pathways, multidisciplinary care, and post-operative monitoring capabilities. At the same time, procedure migration toward clinics and cosmetology-oriented providers continues in markets where elective surgery is increasingly normalized, scheduling convenience improves, and patient acquisition is supported by brand-led channels. Overall, competitive differentiation is increasingly shaped by portfolio depth, safety positioning, surgical education, and evidence generation.
Access crucial information at unmatched prices!
Request your sample report today & start making informed decisions powered by Credence Research Inc.!
Download Sample
By Product Type Insights
Silicone Implants accounted for the largest share of ~86.2% in 2025. This leadership is supported by patient preference for a more natural aesthetic outcome and reduced visible rippling relative to saline options in many anatomies. Surgeon familiarity and standardized implantation protocols also make silicone a default choice across high-volume augmentation practices. Continued innovation in cohesive gel formulations and shell design reinforces adoption by improving shape retention and perceived durability.
By Shape Insights
Round Implants accounted for the largest share of ~83.3% in 2025. Round profiles remain widely selected due to predictable upper-pole fullness and consistent aesthetic outcomes across diverse patient goals. Broader availability across manufacturers and a deep range of sizes and profiles support simpler pre-operative planning and inventory access for providers. In addition, the ease of use and reduced sensitivity to rotation compared with anatomical options sustains strong utilization in routine augmentation workflows.
By Texture/Surface Insights
Surface preference is increasingly influenced by safety perceptions, clinical guidelines, and country-specific regulatory considerations. Providers often prioritize implant selections that align with institutional protocols and patient counseling requirements, which can shape demand toward commonly adopted surface options within each market. Selection also remains procedure- and anatomy-dependent, particularly where surgeons optimize for positioning and capsular behavior based on individual risk profiles. As a result, surface mix can vary meaningfully by geography and practice type.
By Application / Procedure Insights
Cosmetic Surgery accounted for the largest share of ~76.6% in 2025. Cosmetic augmentation volumes typically exceed reconstruction volumes due to broader addressable demand and higher elective procedure throughput in specialist practices. Patient decision-making is increasingly shaped by aesthetic customization, surgeon recommendations, and improved access to consult pathways. Technique refinements and broader implant portfolios further support cosmetic demand by enabling more tailored outcomes aligned with body proportions and lifestyle expectations.
By End User Insights
Hospitals accounted for the largest share of ~48.1% in 2025. Hospitals lead due to their concentration of reconstructive procedures, access to operating room capacity, and ability to manage complex cases requiring coordinated peri-operative care. They also support standardized protocols for infection prevention, adverse event management, and follow-up, which is important for higher-acuity patients. Meanwhile, clinics and cosmetology clinics continue to expand elective volumes where streamlined scheduling, focused service lines, and patient acquisition capabilities increase throughput.
Breast Implants Market Drivers
Expanding elective aesthetic procedure volumes and normalization of cosmetic interventions
Aesthetic surgery demand continues to rise in many markets as cosmetic procedures become more socially accepted and supported by stronger provider marketing and consultation pathways. Greater availability of specialist clinics and improved scheduling access helps convert interest into procedures. Financing options and bundled service offerings can also reduce barriers for elective patients. This supports consistent baseline demand for augmentation procedures and repeat replacement cycles.
- For instance, Natrelle INSPIRA is described as the only smooth implant collection with 3 gummy gel levels and 5 projection options, and the brand states that each implant goes through a 12-day production process with multiple quality checks, supporting more customized augmentation planning for elective patients.
Post-mastectomy reconstruction pathways and multidisciplinary cancer care integration
Reconstructive procedures remain an important demand pillar where breast cancer incidence and treatment volumes are high and reconstruction is integrated into clinical pathways. Hospitals and specialized centers often drive this segment through coordinated surgical planning and structured follow-up. Improved surgical techniques and broader implant options support better outcome consistency and patient satisfaction. These factors collectively sustain steady utilization beyond purely elective settings.
Product innovation and portfolio expansion in gel performance and implant design
Advances in cohesive gel behavior, shell architecture, and sizing/profile breadth enable more tailored results that align with patient anatomy and aesthetic goals. Manufacturers also differentiate through education programs, surgical technique guidance, and post-market evidence building. Enhanced design choices support surgeon confidence and broaden candidate suitability. Innovation also supports premium positioning in segments where patient willingness to pay is higher.
- For instance, Establishment Labs states that Motiva has delivered nearly 4 million devices since 2010 in over 85 countries, while its portfolio is supported by over 200 patent applications in 20 patent families and more than 100 clinical and scientific studies, underscoring the scale and documented depth of its innovation platform.
Growth of specialist clinics and efficiency-driven delivery models
Provider expansion across clinics and cosmetology-oriented settings improves access and shortens time-to-procedure for elective patients. Operational efficiency, standardized workflows, and focused service lines can increase throughput and improve patient experience. This model also supports local market penetration where hospitals prioritize higher-acuity procedures. As a result, channel mix can diversify while overall procedure volumes rise.
Breast Implants Market Challenges
Regulatory scrutiny and ongoing safety considerations create operational and reputational complexity for manufacturers and providers. Shifting guidance, labeling expectations, and patient counseling requirements can influence product selection and slow adoption for certain implant characteristics. Providers may respond by tightening protocol adherence and emphasizing informed consent, which can lengthen the decision cycle and affect conversion rates. These factors can also increase the cost and effort required to sustain evidence generation and compliance.
- For instance, in 3-year data submitted to the FDA, Establishment Labs’ Motiva SmoothSilk implants showed a 0.5% Kaplan-Meier risk of Baker grade III/IV capsular contracture, a 0.6% risk of suspected or confirmed rupture, and a 6.1% reoperation rate in the primary augmentation cohort of 451 patients.
Litigation exposure, device perception risks, and variability in post-operative outcomes can influence demand and purchasing decisions. Providers must balance patient expectations with clear risk communication and follow-up planning, particularly in elective settings. Supply continuity and portfolio availability can also shape market dynamics when manufacturers undergo commercial transitions or focus changes. In addition, cost sensitivity in some regions may limit premium product penetration and affect ASP growth.
Breast Implants Market Trends and Opportunities
Personalization and outcome-driven planning are becoming more central, with patients increasingly expecting implant selection aligned to anatomy, lifestyle, and long-term aesthetic goals. This supports demand for broader product portfolios and more structured consultation workflows. Growth in specialist training and technique refinement also improves outcome consistency, which can support higher patient confidence and sustained procedure intent. Over time, practices that standardize patient education and follow-up may improve conversion and retention.
- For instance, Mentor states that its MemoryShape breast implants can be selected through consultation-based sizing tools such as the BodyLogic system and the MENTOR Volume Sizing System, while its multicenter core study enrolled 955 patients for 10 years of follow-up and found that 97% of patients said at six years that they would repeat the procedure.
Premiumization opportunities continue where patients value perceived quality, brand trust, and evidence-backed performance. Manufacturers that invest in surgeon education, real-world outcomes, and service support can strengthen positioning and expand share in high-value segments. Expansion into underpenetrated geographies through distributor networks and localized training can also unlock incremental volume. Additionally, evolving reconstruction access and pathway integration can raise utilization in hospital-led channels.
Regional Insights
North America (36.4% share, 2025)
North America remains the largest revenue region due to high procedure volumes, strong surgeon density, and a mature ecosystem of hospitals and specialist clinics. Demand is supported by established elective augmentation pathways and structured reconstruction protocols in major health systems. Provider familiarity with a broad range of implant portfolios supports steady utilization across patient profiles. Competitive intensity is high, with differentiation driven by portfolio depth, clinical education, and brand trust.
Europe (22.3% share, 2025)
Europe is shaped by heterogeneous country-level dynamics that influence procedure volumes, care settings, and product mix. Specialist networks and reconstruction pathways support steady baseline demand, while elective adoption varies with affordability and local practice patterns. Providers often emphasize protocol adherence and patient counseling, shaping implant selection and follow-up standards. Market performance is supported by stable clinical capacity and continued preference for predictable outcomes.
Asia Pacific (15.6% share, 2025)
Asia Pacific demand is expanding as elective procedure capacity increases in major urban centers and specialist clinic networks broaden access. Rising disposable incomes and higher willingness to spend on aesthetic outcomes support augmentation volumes across multiple countries. Provider expansion and training improve procedure availability beyond top-tier metros, supporting wider adoption. Product choice is influenced by brand positioning, provider confidence, and patient preference for customized results.
Latin America (14.2% share, 2025)
Latin America benefits from strong aesthetic procedure cultures and established demand centers that support high elective procedure intensity. Private clinics play a major role, with patient acquisition supported by reputation, referrals, and service convenience. Medical tourism contributes in select markets where specialist expertise and competitive pricing attract cross-border demand. Economic volatility can create fluctuations in elective spending, influencing procedure timing and product tier selection.
Middle East & Africa (11.5% share, 2025)
Middle East & Africa demand is more concentrated in private healthcare hubs and higher-income geographies where elective surgery infrastructure is well developed. Growth is supported by medical tourism, expanding private hospital capacity, and increasing specialization in cosmetic and reconstructive care. In parts of Africa, affordability and access constraints limit penetration and skew demand toward urban centers. Supplier partnerships and localized training influence adoption where specialist capacity is still developing.
Competitive Landscape
Competition is shaped by portfolio breadth, surgeon education, safety positioning, and the ability to support consistent outcomes across augmentation and reconstruction. Leading companies compete through differentiated implant design, long-term evidence building, and service models that strengthen surgeon confidence and patient trust. Channel strategy also matters, with firms optimizing coverage across hospitals, specialist clinics, and distributor networks. Brand equity and clinical support infrastructure remain critical differentiators in high-value markets.
AbbVie Inc. / Allergan Aesthetics emphasizes portfolio scale and brand-driven positioning supported by broad surgeon engagement and structured education initiatives. The company’s approach often centers on reinforcing product trust, enabling standardized technique adoption, and sustaining demand through strong practice support and patient-facing awareness. Portfolio depth across sizes and profiles helps address diverse patient anatomies and aesthetic goals. This positioning supports competitiveness in mature markets where provider preference and patient pull-through can meaningfully influence share.
The industry research and growth report includes detailed analyses of the competitive landscape of the market and information about key companies, including:
- AbbVie Inc. / Allergan Aesthetics
- Mentor Worldwide LLC / Johnson & Johnson Services, Inc.
- Sientra, Inc.
- Establishment Labs S.A.
- GC Aesthetics
- HansBiomed Co., Ltd.
- POLYTECH Health & Aesthetics GmbH
- Sebbin
- Silimed
- Bimini Health Tech
Qualitative and quantitative analysis of companies has been conducted to help clients understand the wider business environment as well as the strengths and weaknesses of key industry players. Data is qualitatively analyzed to categorize companies as pure play, category-focused, industry-focused, and diversified; it is quantitatively analyzed to categorize companies as dominant, leading, strong, tentative, and weak.
Shape Your Report to Specific Countries or Regions & Enjoy 30% Off!
Recent Developments
- In October 2025, Allergan Aesthetics, an AbbVie company, announced that Natrelle was awarded a supplier agreement from Vizient, connecting the breast implant brand to Vizient’s broad network of healthcare organizations across the United States.
- In March 2025, Establishment Labs S.A. announced a brand partnership with Meghan Trainor following her Motiva Implants procedure, supporting visibility for its breast aesthetics platform.
- In December 2024, Mentor Worldwide LLC, part of Johnson & Johnson MedTech, received U.S. FDA approval for MENTOR MemoryGel Enhance Breast Implants for primary and revision reconstruction surgery in post-mastectomy women.
Report Scope
| Report Attribute |
Details |
| Market size value in 2025 |
USD 2,938.21 million |
| Revenue forecast in 2032 |
USD 4,824.07 million |
| Growth rate (CAGR) |
7.34% (2025–2032) |
| Base year |
2025 |
| Forecast period |
2026–2032 |
| Quantitative units |
USD million |
| Segments covered |
By Product Type Outlook: Silicone Implants, Saline Implants;
By Shape Outlook: Round Implants, Anatomical Implants;
By Texture/Surface Outlook: Smooth Implants, Textured Implants;
By Application / Procedure Outlook: Cosmetic Surgery, Reconstructive Surgery;
By End User Outlook: Hospitals, Clinics, Cosmetology Clinics, Other End Users |
| Regional scope |
North America, Europe, Asia Pacific, Latin America, Middle East & Africa |
| Key companies profiled |
AbbVie Inc. / Allergan Aesthetics; Mentor Worldwide LLC / Johnson & Johnson Services, Inc.; Sientra, Inc.; Establishment Labs S.A.; GC Aesthetics; HansBiomed Co., Ltd.; POLYTECH Health & Aesthetics GmbH; Sebbin; Silimed; Bimini Health Tech |
| No. of Pages |
335 |
Segmentation
By Product Type
- Silicone Implants
- Saline Implants
By Shape
- Round Implants
- Anatomical Implants
By Texture/Surface
- Smooth Implants
- Textured Implants
By Application / Procedure
- Cosmetic Surgery
- Reconstructive Surgery
By End User
- Hospitals
- Clinics
- Cosmetology Clinics
- Other End Users
By Region
- North America
- Europe
- Germany
- France
- U.K.
- Italy
- Spain
- Rest of Europe
- Asia Pacific
- China
- Japan
- India
- South Korea
- South-east Asia
- Rest of Asia Pacific
- Latin America
- Brazil
- Argentina
- Rest of Latin America
- Middle East & Africa
- GCC Countries
- South Africa
- Rest of the Middle East and Africa


