Market overview
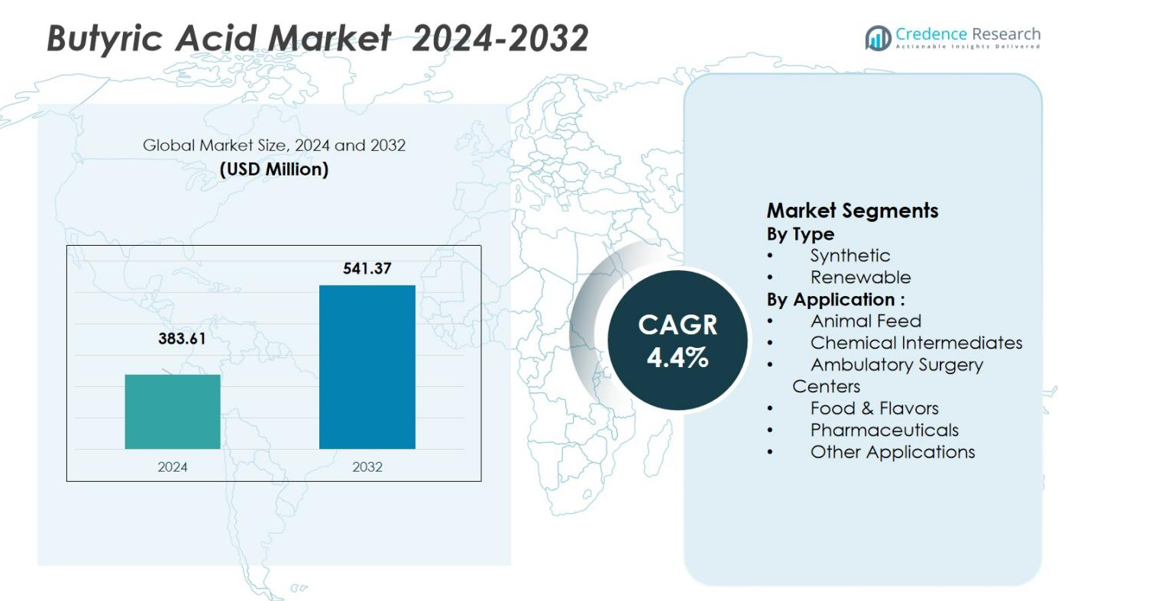
The Butyric Acid Market size was valued at USD 383.61 Million in 2024 and is anticipated to reach USD 541.37 Million by 2032, at a CAGR of 4.4% during the forecast period.
| REPORT ATTRIBUTE |
DETAILS |
| Historical Period |
2020-2023 |
| Base Year |
2024 |
| Forecast Period |
2025-2032 |
| Butyric Acid Market Size 2024 |
USD 383.61 Million |
| Butyric Acid Market, CAGR |
4.4% |
| Butyric Acid Market Size 2032 |
USD 541.37 Million |
The Butyric Acid Market is dominated by key players such as Eastman Chemical Company, Oxea GmbH, Perstorp Holding AB, and Kemin Industries Inc., who are major contributors to the market’s growth. These companies leverage their established production capabilities, diverse application portfolios, and strong geographic presence to maintain a significant market share. The Asia Pacific region holds the largest share of the market, accounting for 38.77% in 2024, driven by robust demand in animal feed and growing pharmaceutical applications. Europe follows with a notable share of 27%, supported by stringent regulations promoting bio-based products. North America, with 22% market share, contributes significantly through its strong pharmaceutical and food industries. Other regions, including Latin America and the Middle East & Africa, offer growth potential as infrastructure development and agricultural practices improve.
Market Insights
- The Butyric Acid Market size was valued at USD 383.61 Million in 2024 and is anticipated to reach USD 541.37 Million by 2032, growing at a CAGR of 4.4%.
- The rising demand for high-quality animal feed is the primary driver, with butyric acid being widely used in poultry, swine, and ruminant industries to promote gut health.
- Growing consumer preference for eco-friendly, bio-based products is pushing the market toward renewable butyric acid, leading to increased adoption in various industries.
- Increasing pharmaceutical applications, particularly in treating digestive disorders and gut-health, represent a significant trend, creating further opportunities in this sector.
- Asia Pacific holds the largest market share of 38.77%, followed by Europe at 27% and North America at 22%. The market is expanding in Latin America and the Middle East due to rising livestock production and regulatory alignment.
Access crucial information at unmatched prices!
Request your sample report today & start making informed decisions powered by Credence Research Inc.!
Download Sample
Market Segmentation Analysis:
By Type
The Butyric Acid market is segmented into synthetic and renewable types, with the synthetic segment holding the dominant market share of 72.3% in 2024. The synthetic form is widely used due to its cost-effectiveness and scalability in industrial applications. It is primarily utilized in the production of animal feed, food flavors, and pharmaceuticals. The growing demand for cost-efficient manufacturing processes and the established production techniques for synthetic butyric acid are key drivers for this segment’s dominance. However, the renewable segment is expected to witness significant growth, driven by increasing environmental awareness and sustainability trends, with a projected market share of 27.7% in 2024.
- For instance, OQ Chemicals produces synthetic butyric acid at large scale in its Oberhausen facility, Germany, for use in food flavoring agents and animal feed additives.
By Application
In terms of application, the animal feed segment leads the market, accounting for 44.9% of the total share in 2024. The growing need for high-quality livestock nutrition and the increasing use of butyric acid in enhancing animal gut health are driving the demand in this segment. Animal feed is a critical use of butyric acid, especially in poultry, swine, and ruminant industries, where it is employed to improve digestion and growth. Following animal feed, the chemical intermediates segment holds the second-largest share, contributing 22.6%, driven by the use of butyric acid in producing various chemicals and fragrances.
- For instance, Evonik Industries has integrated butyric acid derivatives such as sodium butyrate in its animal nutrition line to improve gut integrity and feed efficiency in poultry.
Key Growth Drivers
Rising Demand in Animal Feed Industry
The increasing demand for high-quality animal feed is one of the key drivers of growth in the Butyric Acid Market. As livestock farming expands globally, the need for nutritional additives that improve digestion, gut health, and overall growth in animals has surged. Butyric acid, known for its ability to promote gut health and boost feed efficiency, is being widely incorporated into poultry, swine, and ruminant diets. This growing focus on optimizing animal health and enhancing productivity is fueling the demand for butyric acid, making it a vital ingredient in modern animal feed formulations.
- For instance, ButyMAX, a micro-encapsulated calcium butyric acid that provides stable and targeted release in animal diets, optimizing physiological effects while requiring lower inclusion rates for cost efficiency.
Shifting Preference Toward Renewable Sources
The rising global focus on sustainability and eco-friendly practices is driving the demand for renewable butyric acid. With increasing concerns over climate change and environmental degradation, industries are seeking alternatives to petrochemical-based products. Renewable butyric acid, derived from bio-based feedstocks, offers a greener option and aligns with the growing preference for sustainable products. As governments and companies set stricter environmental regulations, the shift toward renewable butyric acid is gaining momentum, propelling the market’s expansion and opening new avenues for growth.
Expanding Pharmaceutical and Food & Flavor Applications
The growing use of butyric acid in pharmaceuticals and food applications is another significant growth driver. In pharmaceuticals, butyric acid’s potential as an anti-inflammatory agent, as well as its ability to treat digestive disorders, has led to increased research and applications in drug formulations. Similarly, in the food industry, butyric acid is being utilized as a flavor enhancer and preservative. These expanding applications in both sectors are driving market growth, as consumers seek healthier alternatives in food and a rising need for therapeutic drugs continues to shape pharmaceutical demand.
- For instance, Nestlé Health Science has explored butyrate-based compounds to support intestinal health in medical nutrition products. In the food industry, butyric acid is valued as a natural flavor enhancer and preservative
Key Trends & Opportunities
Focus on Eco-friendly Production Methods
There is an increasing trend toward eco-friendly production methods in the Butyric Acid Market, which offers significant opportunities for market players. Manufacturers are investing in green technologies to produce butyric acid from renewable biomass instead of traditional petrochemical sources. This shift not only supports sustainability efforts but also helps meet the growing consumer demand for natural, biodegradable products. As environmental concerns take center stage across industries, companies focusing on environmentally friendly production processes are poised to capitalize on this opportunity and attract eco-conscious consumers.
- For instance, Full Circle Biotechnology secured funding to build a 7,000-ton facility aimed at producing low-carbon feed ingredients with butyric acid, emphasizing the shift towards renewable raw materials and reduced carbon footprints in production processes.
Technological Advancements in Butyric Acid Production
Technological advancements in the production of butyric acid are unlocking new growth opportunities for the market. Innovations such as fermentation technology, which uses microorganisms to produce butyric acid from organic waste, are making the process more efficient and cost-effective. These advancements help reduce production costs, increase scalability, and provide more sustainable alternatives. As these technologies evolve, they enable companies to meet growing demand while ensuring lower environmental impact. The adoption of such advancements is likely to create new market entrants and disrupt traditional production models, driving competition and growth.
- For instance, Cargill developed a bio-based fermentation platform to produce organic acids from corn-based feedstocks, reducing reliance on petrochemical inputs.
Key Challenges
High Production Costs
One of the primary challenges facing the Butyric Acid Market is the high cost of production, particularly for renewable butyric acid. The production of bio-based butyric acid involves complex processes and high raw material costs, which make it more expensive than its synthetic counterpart. As the renewable segment grows, companies are faced with the challenge of optimizing production processes to reduce costs while maintaining product quality. The relatively high costs associated with renewable production may hinder the widespread adoption of eco-friendly butyric acid, limiting its potential market share.
Regulatory Challenges and Market Entry Barriers
Regulatory hurdles and market entry barriers pose significant challenges for companies operating in the Butyric Acid Market. In many regions, especially Europe and North America, stringent regulations regarding production standards, sustainability practices, and safety requirements must be adhered to. These regulations can create delays in product development, increase compliance costs, and limit the ability to enter new markets. Additionally, the high level of capital investment required to establish production facilities and the technical expertise needed to meet regulatory standards may deter new players from entering the market, limiting overall competition.
Regional Analysis
Asia Pacific
The Asia Pacific region held a commanding share of 38.77% of the global Butyric Acid market in 2024. This dominance stems from the region’s expansive livestock and animal‐feed sectors, notably in China and India, where rising protein consumption and improved agricultural practices are driving growth. Feed additive adoption is higher as producers seek alternatives to antibiotics and aim to improve growth efficiency, directly boosting demand for butyric acid. Additionally, the expanding food flavouring and pharmaceutical end‐markets in the region further elevate Asia Pacific’s central role in the overall market, accounting for 38.77% of the global share.
Europe
In Europe, the butyric acid market features moderate growth with a shifting landscape driven by stringent environmental and chemical regulations. While precise regional share data are less commonly disclosed, Europe holds a notable position with a share of 27% of the global market. The regulatory impetus toward bio‐based and sustainable chemical production places pressure on producers and encourages the adoption of renewable butyric acid. Growth is further supported by established food & flavour and pharmaceutical industries seeking high‐quality, compliant additives, maintaining Europe’s strategic role in the market.
North America
The North American region presents a stable demand environment for butyric acid, supported by well‐developed food processing, animal nutrition, and pharmaceutical sectors. The U.S. and Canada exhibit robust inclusion of specialty additives and active interest in gut‐health and antibiotic‐free feed formulations, reinforcing butyric acid’s relevance. North America contributes significantly to global revenue, accounting for 22% of the market. Market expansion is underpinned by research investment, regulatory clarity, and rising demand for clean‐label additives, which together sustain steady growth across the region.
Latin America
Latin America holds a smaller but emerging share of the global butyric acid market, accounting for 6.4% in 2024. The market in this region is driven by growth in livestock production, food processing, and expanding agricultural value chains. Countries like Brazil and Mexico are increasing feed additive usage as export‐oriented poultry and beef operations demand higher efficiency and quality. The region offers significant growth potential, particularly as infrastructure improves and multinational feed‐additive firms expand their presence, which supports an optimistic market outlook.
Middle East & Africa
The Middle East & Africa region represents a nascent but growing market for butyric acid, with an estimated market share of 5.5% in 2024. Demand is spurred by initiatives to enhance domestic livestock productivity and food security, prompting the adoption of feed additives like butyric acid. While current market share remains low relative to other regions, the future trajectory is promising. Investment in agricultural infrastructure, animal‐nutrition programs, and chemical manufacturing capacity supports incremental growth, indicating potential for market expansion in the coming years.
Market Segmentations:
By Type
By Application :
- Animal Feed
- Chemical Intermediates
- Ambulatory Surgery Centers
- Food & Flavors
- Pharmaceuticals
- Other Applications
By Geography
- North America
- Europe
- Germany
- France
- U.K.
- Italy
- Spain
- Rest of Europe
- Asia Pacific
- China
- Japan
- India
- South Korea
- South-east Asia
- Rest of Asia Pacific
- Latin America
- Brazil
- Argentina
- Rest of Latin America
- Middle East & Africa
- GCC Countries
- South Africa
- Rest of the Middle East and Africa
Competitive Landscape
Key players such as Eastman Chemical Company, Oxea GmbH, Perstorp Holding AB and Kemin Industries Inc. dominate the global butyric acid market. These leading firms leverage vertically integrated production, broad application portfolios (animal feed, pharmaceutical, flavor & fragrance), and geographic reach to secure high market share. They continue to invest in advanced production technologies such as micro‑encapsulation for feed additives and precision fermentation for bio‑based supply to differentiate and mitigate raw material volatility. Meanwhile, smaller specialised players and new entrants are gaining ground by focusing on niche segments (e.g., high‑purity pharmaceutical grade, low‑odor derivatives) or renewable feedstocks, intensifying competitive pressure. Overall, the high concentration of capacity among incumbents, combined with capacity expansions, product innovation and strategic alliances, ensures that competition remains fierce while barriers to entry stay relatively high.
Shape Your Report to Specific Countries or Regions & Enjoy 30% Off!
Key Player Analysis
- Kemin Industries Inc.
- Oxea GmbH
- Palital Feed Additives B.V.
- Dow Inc.
- Blue Marble Biomaterials
- Hefei TNJ Chemical Industry Co., Ltd.
- Innova Global
- Perstorp Holding AB
- Eastman Chemical Company
- Sisco Research Laboratories Pvt. Ltd.
Recent Developments
- In April 2022, Perstorp Holding AB introduced a new line of bio‑based butyric acid products targeting the dietary supplement and animal feed markets.
- In March 2023, Eastman Chemical Company launched its bio‑based butyric acid product “BioButyrate™”, targeted at the food & flavour market.
- In March 2023, OQ Chemicals announced a capacity expansion for its carboxylic acids including butyric acid at its Oberhausen, Germany facility to support rising global demand in food, feed, and pharmaceuticals.
Report Coverage
The research report offers an in-depth analysis based on Type, Application and Geography. It details leading market players, providing an overview of their business, product offerings, investments, revenue streams, and key applications. Additionally, the report includes insights into the competitive environment, SWOT analysis, current market trends, as well as the primary drivers and constraints. Furthermore, it discusses various factors that have driven market expansion in recent years. The report also explores market dynamics, regulatory scenarios, and technological advancements that are shaping the industry. It assesses the impact of external factors and global economic changes on market growth. Lastly, it provides strategic recommendations for new entrants and established companies to navigate the complexities of the market.
Future Outlook
- The market for butyric acid will continue to expand as demand in the animal feed sector grows, driven by increasing livestock production and antibiotic‑free nutrition practices.
- Adoption of bio‑based and renewable production routes will accelerate, prompted by sustainability mandates and corporate decarbonisation goals.
- Growing consumer preference for clean‑label and natural ingredients will boost use of butyric acid in food, flavour and preservative applications.
- Technological advancements such as improved fermentation, micro‑encapsulation and continuous bioreactor systems will reduce manufacturing costs and widen profitability.
- The pharmaceutical and nutraceutical sectors will increasingly adopt butyric acid derivatives, leveraging gut‑health and anti‑inflammatory trends.
- Asia‑Pacific will lead regional growth thanks to large animal feed demand, expanding food processing industries and rising chemical manufacturing capacity.
- Capacity expansions, particularly in emerging markets, will intensify competition and lead to consolidation among producers.
- Supply‑chain resilience and raw‑material cost volatility (especially petro‑based feedstocks) will remain key operational challenges for manufacturers.
- Stricter regulatory frameworks especially in Europe and North America will favour producers with robust compliance, but may hinder smaller entrants.
- Emergent applications in personal care, dietary supplements and specialty chemicals will open new revenue streams beyond traditional feed and flavour segments.


