Market Overview
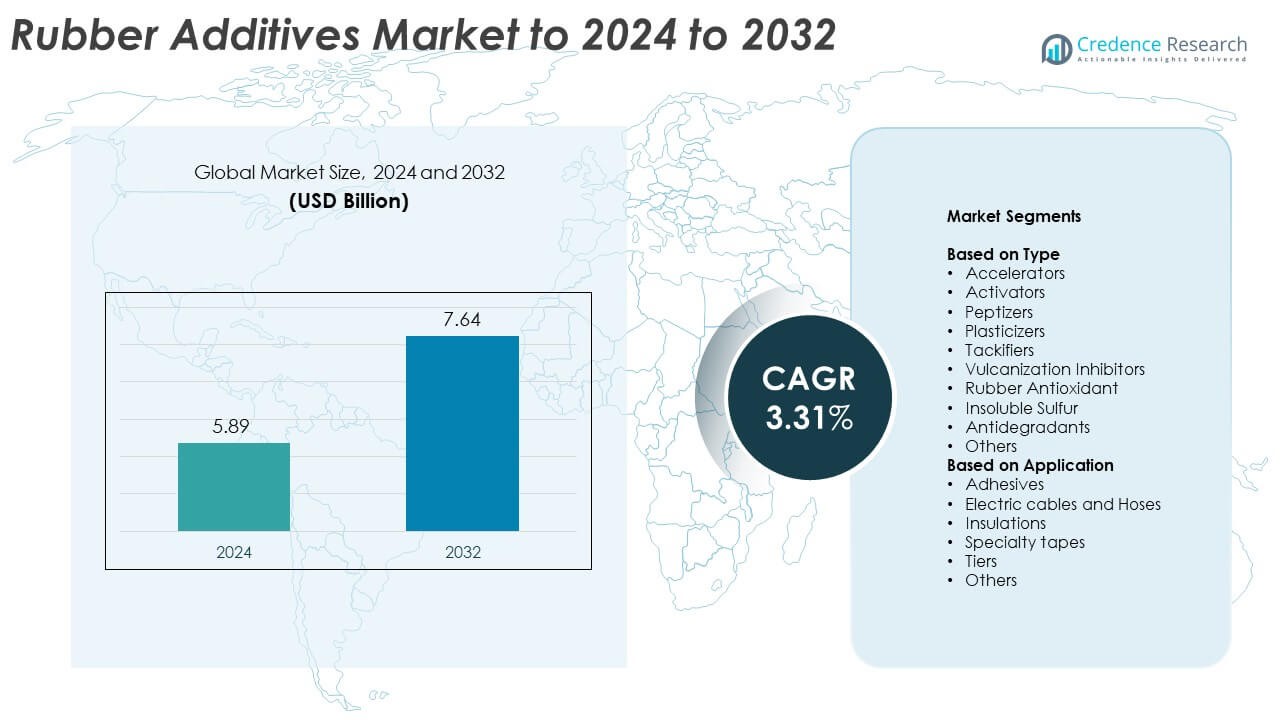
The Rubber Additives market size was valued at USD 5.89 billion in 2024 and is anticipated to reach USD 7.64 billion by 2032, at a CAGR of 3.31% during the forecast period.
| REPORT ATTRIBUTE |
DETAILS |
| Historical Period |
2020-2023 |
| Base Year |
2024 |
| Forecast Period |
2025-2032 |
| Rubber Additives Market Size 2024 |
USD 5.89 Billion |
| Rubber Additives Market, CAGR |
3.31% |
| Rubber Additives Market Size 2032 |
USD 7.64 Billion |
The rubber additives market is led by major companies such as BASF SE, Lanxess AG, Eastman Chemical Company, Arkema S.A., Evonik, Sumitomo Chemical, and Sinopec Corporation. These players dominate through advanced R&D, strong global supply chains, and innovation in eco-friendly additive formulations. The competitive environment focuses on sustainable, high-performance accelerators, antioxidants, and plasticizers to meet rising demand from automotive and industrial sectors. Asia Pacific emerged as the leading region with a 41% market share in 2024, driven by large-scale tire production and industrial growth, followed by North America with 28% and Europe with 24%.
Access crucial information at unmatched prices!
Request your sample report today & start making informed decisions powered by Credence Research Inc.!
Download Sample
Market Insights
- The rubber additives market was valued at USD 5.89 billion in 2024 and is projected to reach USD 7.64 billion by 2032, growing at a CAGR of 3.31%.
- Rising demand for high-performance tires and expanding automotive production are driving market growth globally.
- The market is witnessing a shift toward eco-friendly, low-toxicity, and bio-based additives, supported by stricter environmental regulations.
- Leading companies focus on R&D, sustainability, and digital manufacturing, with accelerators holding the largest segment share of 27% in 2024.
- Asia Pacific led the market with a 41% share in 2024, followed by North America at 28% and Europe at 24%, driven by strong tire and industrial rubber demand across major economies.
Market Segmentation Analysis:
By Type
Accelerators dominated the rubber additives market with a 27% share in 2024. Their dominance is driven by increasing use in tire manufacturing to improve vulcanization speed and mechanical strength. Demand is further supported by rising vehicle production and performance tire adoption. For instance, Lanxess produces over 150,000 metric tons of rubber accelerators annually, supplying major tire manufacturers worldwide. Continuous innovation in nitrosamine-free accelerator formulations enhances both environmental compliance and curing efficiency.
- For instance, NOCIL announced in March 2024 that it is expanding its rubber chemicals capacity at its Dahej plant by 20%, building upon its existing capacity of 115,000 tpa. This expansion was expected to bring its total rubber chemicals capacity to 138,000 tpa, including accelerators.
By Application
Tires held the largest market share of 46% in 2024, making them the dominant application segment. The segment’s growth is driven by strong demand for high-performance, fuel-efficient tires in passenger and commercial vehicles. Rubber additives improve flexibility, heat resistance, and wear life, extending tire durability. For instance, Bridgestone integrated advanced antioxidant and antidegradant formulations into its tire production, achieving over 15% higher tread life and improved thermal stability across multiple product lines.
- For instance, Bridgestone announced its MASTERCORE VRDU with 26% longer tire life versus VRLS.
Key Growth Drivers
Rising Demand for High-Performance Tires
The growing adoption of high-performance and fuel-efficient tires is a major driver of the rubber additives market. Tire manufacturers rely on specialized accelerators, antioxidants, and plasticizers to enhance elasticity, grip, and heat resistance. The shift toward electric and hybrid vehicles further increases demand for low-rolling-resistance tires, boosting additive consumption. Expanding global automotive production and the need for longer tire life continue to strengthen the market outlook for rubber additives.
- For instance, Evonik states ULTRASIL® with Si 363™ can cut rolling resistance by up to 35% and shorten wet-braking distance by ~18 m at 80 km/h.
Expansion in Construction and Industrial Applications
The rapid growth of the construction and industrial sectors supports strong demand for rubber additives used in hoses, cables, seals, and gaskets. These additives improve resistance to heat, abrasion, and weathering, ensuring longer service life. Industrial infrastructure development across emerging economies has intensified the use of durable rubber components in heavy machinery. The increased focus on workplace safety and reliability also drives additive adoption in critical sealing and insulation applications.
- For instance, Cabot is adding 15,000 t/yr of conductive carbon additive capacity at its existing facility in Pampa, Texas, with the project expected to begin operation at the end of 2025 to support the electric vehicle lithium-ion battery market.
Shift Toward Eco-Friendly and Low-Toxicity Additives
Growing environmental concerns and strict emission regulations drive the shift toward sustainable rubber additives. Manufacturers are developing non-toxic, low-VOC, and bio-based solutions to replace conventional additives. The automotive and manufacturing industries increasingly prefer green formulations that comply with REACH and EPA standards. This shift toward sustainability enhances both regulatory compliance and market competitiveness while attracting environmentally conscious consumers.
Key Trends & Opportunities
Integration of Smart Manufacturing and Automation
Advances in automation and digital production systems present strong opportunities for additive manufacturers. Smart factories enable precise dosage control and consistent compound mixing, improving rubber quality and performance. Automation also reduces production waste and increases operational efficiency. Companies adopting Industry 4.0 tools, such as process monitoring sensors and AI-driven control systems, gain an edge through consistent quality and reduced cycle times.
- For instance, LANXESS’ Antwerp unit’s abatement cuts ~500 t/year of N₂O, improving process sustainability.
Innovation in Specialty Additives for EV Applications
The growing electric vehicle market offers opportunities for specialized rubber additives designed for high-voltage cable insulation and low-noise tires. These additives enhance heat resistance, conductivity control, and elasticity. The demand for lightweight materials in EV components drives innovation in polymer compatibility and performance modifiers. Manufacturers investing in EV-specific formulations are expanding their presence in advanced mobility solutions.
- For instance, WACKER ELASTOSIL® R 531/60 forms a ceramic, insulating layer at 800–1,000 °C for EV busbars
Key Challenges
Volatility in Raw Material Prices
Fluctuating prices of petrochemical-based raw materials remain a critical challenge for rubber additive producers. Costs of key inputs such as sulfur, zinc oxide, and synthetic chemicals directly affect profit margins. The dependence on crude oil derivatives makes manufacturers vulnerable to supply disruptions and geopolitical factors. This volatility increases operational uncertainty and limits pricing flexibility in competitive markets.
Stringent Environmental Regulations and Compliance Costs
Increasing environmental regulations across major economies impose strict limits on chemical use in rubber production. Compliance with standards such as REACH and RoHS requires continuous R&D investment and reformulation of additive compositions. Smaller manufacturers face higher compliance costs, reducing their profitability and competitiveness. The transition toward safer, eco-friendly alternatives also demands significant testing and certification efforts.
Regional Analysis
North America
North America accounted for 28% of the global rubber additives market share in 2024. The region benefits from a strong automotive base, advanced processing technologies, and increasing adoption of sustainable additives. The United States leads due to its high tire production and focus on performance-enhancing formulations. Demand growth is further supported by the expansion of electric vehicle manufacturing and the use of specialized additives in hoses, seals, and insulation applications across industrial sectors. Regulatory focus on safety and eco-friendly materials strengthens product innovation in this region.
Europe
Europe held a 24% share of the global rubber additives market in 2024. The region’s growth is supported by a mature automotive sector and stringent environmental regulations. Manufacturers focus on non-toxic, low-emission additive formulations to comply with REACH standards. Germany, France, and Italy drive demand through high tire production and industrial rubber applications. Ongoing innovation in bio-based and recyclable materials enhances market stability. Investments in energy-efficient processing technologies and sustainable raw materials further strengthen Europe’s competitive position.
Asia Pacific
Asia Pacific dominated the global rubber additives market with a 41% share in 2024. The region’s leadership is driven by large-scale automotive and industrial production in China, Japan, India, and South Korea. Rising vehicle ownership, infrastructure expansion, and export-driven manufacturing strongly support additive consumption. Regional producers benefit from cost-effective raw materials and favorable government initiatives for industrial growth. Rapid adoption of high-performance and eco-friendly additives positions Asia Pacific as the fastest-growing regional market.
Latin America
Latin America accounted for 9% of the global rubber additives market share in 2024. The region’s growth is led by Brazil and Mexico, supported by expanding automotive and construction industries. Increasing tire production and industrial rubber demand drive additive consumption. Economic reforms and infrastructure investments further enhance market prospects. However, limited technological advancement and dependence on imports for specialized additives constrain regional expansion compared to Asia Pacific and Europe.
Middle East & Africa
The Middle East & Africa held a 6% share of the global rubber additives market in 2024. Growth is supported by industrial diversification, oil and gas sector expansion, and infrastructure development projects. GCC countries are investing in localized rubber production to reduce import dependence. The rising use of additives in cables, seals, and industrial hoses strengthens market demand. However, limited manufacturing capacity and fluctuating raw material costs continue to restrict stronger market penetration in the region.
Market Segmentations:
By Type
- Accelerators
- Activators
- Peptizers
- Plasticizers
- Tackifiers
- Vulcanization Inhibitors
- Rubber Antioxidant
- Insoluble Sulfur
- Antidegradants
- Others
By Application
- Adhesives
- Electric cables and Hoses
- Insulations
- Specialty tapes
- Tiers
- Others
By Geography
- North America
- Europe
- Germany
- France
- U.K.
- Italy
- Spain
- Rest of Europe
- Asia Pacific
- China
- Japan
- India
- South Korea
- South-east Asia
- Rest of Asia Pacific
- Latin America
- Brazil
- Argentina
- Rest of Latin America
- Middle East & Africa
- GCC Countries
- South Africa
- Rest of the Middle East and Africa
Competitive Landscape
The global rubber additives market is characterized by strong competition among leading companies such as BASF SE, Lanxess AG, Eastman Chemical Company, Arkema S.A., Evonik, Sumitomo Chemical, Sinopec Corporation, China Petrochemical Corporation, NOCIL Limited, Behn Meyer Group, Emery Oleochemicals, Toray Industries, Inc., Huatai Chemical (Shandong Yanggu Huatai Chemical Co., Ltd), and Birch Chemicals. These companies compete through diversified product portfolios, innovation in eco-friendly formulations, and integrated supply networks. The market is shaped by ongoing R&D in high-performance additives that improve durability, flexibility, and processing efficiency. Producers focus on sustainable, low-toxicity, and bio-based solutions to meet environmental standards. Strategic partnerships with tire manufacturers, capacity expansions across Asia, and digital manufacturing initiatives enhance operational efficiency. Leading participants also pursue acquisitions and technological collaborations to strengthen global reach, ensure supply stability, and maintain competitiveness across automotive, industrial, and infrastructure applications.
Shape Your Report to Specific Countries or Regions & Enjoy 30% Off!
Key Player Analysis
- BASF SE
- Lanxess AG
- Eastman Chemical Company
- Arkema S.A.
- Evonik
- Sumitomo Chemical
- Sinopec Corporation
- China Petrochemical Corporation
- NOCIL Limited
- Behn Meyer Group
- Emery Oleochemicals
- Toray Industries, Inc.
- Huatai Chemical (Shandong Yanggu Huatai Chemical Co., Ltd)
- Birch Chemicals
Recent Developments
- In 2025, LANXESS Launched Vulkanox HS Scopeblue, a rubber additive for longer-lasting and more sustainable tires.
- In 2024, Huatai Chemical (Shandong Yanggu Huatai Chemical Co., Ltd.) announced plans to establish a new rubber additives production base in Thailand
- In 2022, Evonik announced the launch POLYVEST eCO, a new line of sustainable liquid polybutadienes for use as liquid rubber additives in tire manufacture.
Report Coverage
The research report offers an in-depth analysis based on Type, Application and Geography. It details leading market players, providing an overview of their business, product offerings, investments, revenue streams, and key applications. Additionally, the report includes insights into the competitive environment, SWOT analysis, current market trends, as well as the primary drivers and constraints. Furthermore, it discusses various factors that have driven market expansion in recent years. The report also explores market dynamics, regulatory scenarios, and technological advancements that are shaping the industry. It assesses the impact of external factors and global economic changes on market growth. Lastly, it provides strategic recommendations for new entrants and established companies to navigate the complexities of the market.
Future Outlook
- The rubber additives market will continue expanding with rising tire production worldwide.
- Growing electric vehicle adoption will increase demand for high-performance, heat-resistant additives.
- Manufacturers will focus on developing sustainable, bio-based additive formulations.
- Automation and digital control in rubber processing will enhance additive efficiency.
- Asia Pacific will remain the largest regional market due to industrial growth and cost advantages.
- Environmental regulations will push producers toward non-toxic and low-VOC additives.
- Innovation in high-durability additives will support longer product lifecycles in industrial uses.
- Demand for conductive rubber materials will grow with the expansion of smart and connected devices.
- Strategic collaborations between additive suppliers and tire manufacturers will drive product development.
- Continuous R&D investment will shape the next generation of eco-compliant and performance-driven additives.


