
Market Overview:
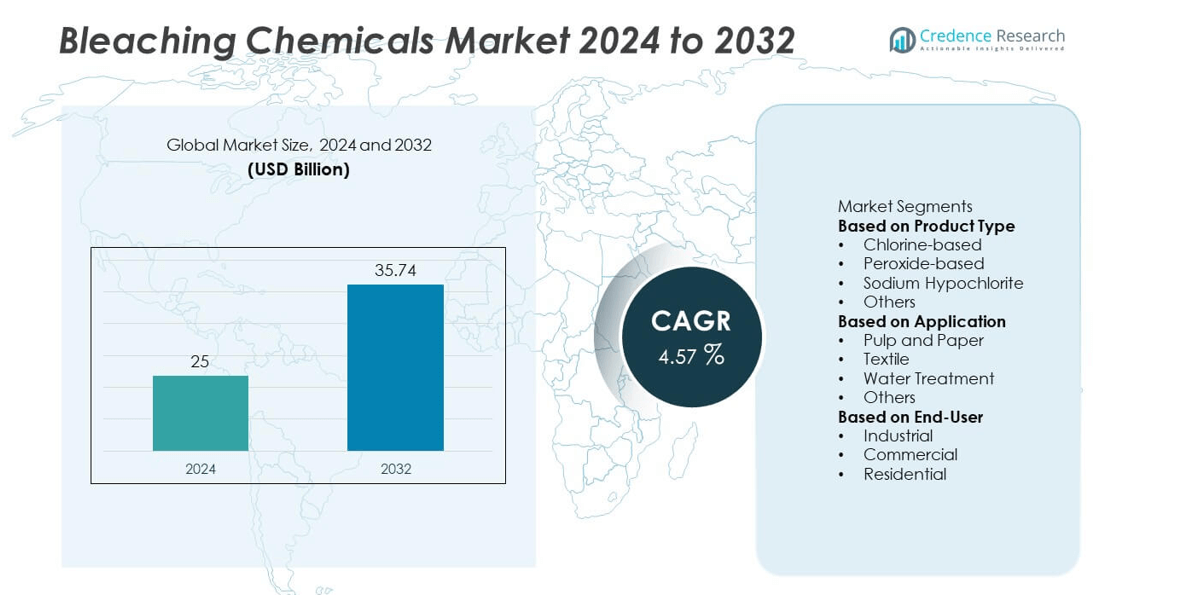
The Bleaching Chemicals market was valued at USD 25 billion in 2024 and is projected to reach USD 35.74 billion by 2032, growing at a CAGR of 4.57% during the forecast period.
| REPORT ATTRIBUTE | DETAILS |
|---|---|
| Historical Period | 2020-2023 |
| Base Year | 2024 |
| Forecast Period | 2025-2032 |
| Bleaching Chemicals Market Size 2024 | USD 25 billion |
| Bleaching Chemicals Market, CAGR | 4.57% |
| Bleaching Chemicals Market Size 2032 | USD 35.74 billion |
The bleaching chemicals market is led by key players such as Ashland Global Holdings Inc., Evonik Industries AG, Akzo Nobel N.V., Ecolab Inc., Aditya Birla Chemicals, Kemira Oyj, Arkema Group, Clariant AG, The Dow Chemical Company, and Solvay S.A. These companies maintain a strong global presence through product innovation, sustainability initiatives, and long-term supply agreements with industrial users. They focus on developing eco-friendly and high-performance bleaching agents to meet tightening environmental standards. Asia Pacific emerged as the leading region with a 36.4% share in 2024, driven by expanding paper, textile, and water treatment industries. Rapid industrialization and government investments in sustainable chemical production continue to strengthen the region’s dominance.
Market Insights
- The bleaching chemicals market was valued at USD 25 billion in 2024 and is projected to reach USD 35.74 billion by 2032, registering a CAGR of 4.57% during the forecast period.
- Rising demand from the pulp and paper, textile, and water treatment industries is driving market expansion, supported by industrialization and growing hygiene awareness.
- The market is witnessing a shift toward eco-friendly and chlorine-free bleaching agents, with hydrogen peroxide and oxygen-based solutions gaining preference.
- Key players such as Akzo Nobel N.V., Evonik Industries AG, The Dow Chemical Company, and Kemira Oyj are focusing on innovation, mergers, and sustainable product development to strengthen competitiveness.
- Asia Pacific dominated the market with a 36.4% share in 2024, followed by North America at 27.3%, driven by strong industrial activity and adoption of green bleaching technologies across key end-use sectors.
Market Segmentation Analysis:
By Product Type
The chlorine-based segment dominated the bleaching chemicals market with a 41.6% share in 2024. Its strong position is driven by widespread use in pulp and paper manufacturing, textile processing, and water disinfection. Chlorine compounds, including sodium hypochlorite and chlorine dioxide, are preferred for their high oxidizing capacity and cost efficiency. Despite environmental concerns, their effectiveness in large-scale bleaching operations sustains demand. Growing industrial applications in developing economies continue to reinforce the dominance of chlorine-based chemicals, supported by ongoing technological advancements in safer and more controlled chlorine usage.
- For instance, Kemira Oyj invested approximately €50 million in a new sodium chlorate production line at its Joutseno facility in Finland. The expansion, completed in 2017, used Kemira's proprietary in-house technology and significantly increased the site's capacity. The new line was built to meet the growing demand for bleaching chemicals driven by pulp mill expansions in the Nordics.
By Application
The pulp and paper segment held the largest share of 37.8% in 2024, owing to its extensive use of bleaching agents for lignin removal and brightness enhancement. The global rise in packaging material and printing paper production drives consumption across paper mills. Hydrogen peroxide and chlorine dioxide are widely used to achieve high whiteness levels while meeting environmental regulations. Increasing demand for eco-friendly, high-quality paper products, combined with modernization in paper processing plants, further strengthens this segment’s leadership in the bleaching chemicals market.
- For instance, Evonik Industries plans to increase hydrogen peroxide capacity at its Antwerp, Belgium, site to meet the increasing demand, particularly from the pulp and paper industry. Additionally, the company is collaborating on a regional project in Antwerp to use recycled wastewater for its operations, which will eliminate the need for over 2 million cubic meters of drinking water annually and support sustainable practices.
By End-User
The industrial segment accounted for a 58.5% share in 2024, emerging as the leading end-user category. Industries such as textiles, pulp and paper, and wastewater treatment rely heavily on bleaching chemicals for large-scale operations. Expanding industrial output in emerging economies and rising investment in water purification facilities are key growth drivers. The increasing shift toward sustainable bleaching solutions and continuous process automation enhances efficiency and safety. Growing demand from chemical manufacturing and sanitation industries continues to support the segment’s leading position globally.
Key Growth Drivers
Rising Demand from Pulp and Paper Industry
The growing global production of paper and packaging materials is a major driver for the bleaching chemicals market. Bleaching agents such as chlorine dioxide and hydrogen peroxide are widely used to improve paper brightness and remove impurities. Increasing demand for high-quality, recyclable, and eco-friendly paper products further strengthens market growth. Modernization in pulp processing and the shift toward elemental chlorine-free (ECF) bleaching enhance process efficiency while meeting environmental standards.
- For instance, International Paper has made significant investments in its Riverdale mill in Selma, Alabama, to produce high-quality containerboard while meeting modern environmental standards
Expanding Textile Manufacturing and Processing
Rapid expansion of the textile industry, particularly in Asia Pacific, is fueling the demand for bleaching chemicals. These agents are essential for fabric whitening, stain removal, and preparation for dyeing. Hydrogen peroxide remains a preferred choice due to its strong bleaching performance and reduced environmental impact. Rising global apparel production and growing demand for clean, bright fabrics support continued chemical adoption in textile processing facilities worldwide.
- For instance, Archroma offers innovative peroxide-based bleaching systems that can reduce water consumption in textile processing. Studies have shown that optimized one-bath cotton bleaching processes can achieve a high whiteness index of 139.5, alongside significant reductions in water usage, chemical use, and energy consumption compared to conventional methods.
Increasing Water Treatment Activities
The expansion of industrial and municipal water treatment facilities drives significant demand for bleaching chemicals. Chlorine-based agents are extensively used for disinfection, odor control, and removal of organic contaminants. Growing urbanization, stricter water quality regulations, and heightened awareness about sanitation are boosting consumption. The integration of advanced treatment technologies and sustainable chlorine management practices further promotes product use across various regions.
Key Trends & Opportunities
Shift Toward Eco-Friendly and Green Bleaching Agents
Environmental concerns are pushing the industry toward eco-friendly alternatives such as hydrogen peroxide and ozone-based solutions. These agents offer effective bleaching with minimal toxic residue, aligning with global sustainability goals. Regulatory frameworks favoring green chemistry encourage producers to innovate low-impact formulations. This transition creates opportunities for chemical manufacturers to develop biodegradable and energy-efficient bleaching products that reduce wastewater contamination.
- For instance, Solvay is partnering with Sapio at its Rosignano facility to build a green hydrogen plant to supply its peroxides production. The new plant will produce 756 tons of green hydrogen annually, powered by a 9.5 MW photovoltaic installation, and is projected to reduce CO2 emissions from the site's peroxides-related operations by 15%.
Technological Advancements in Bleaching Processes
Continuous innovation in process optimization is transforming the bleaching chemicals landscape. Advanced control systems and automated dosing technologies enhance precision, safety, and resource efficiency. Adoption of oxygen-based and non-chlorine bleaching processes in pulp and textile industries supports compliance with environmental standards. Integration of digital monitoring and closed-loop systems also reduces chemical waste, improving profitability and sustainability for manufacturers.
- For instance, Andritz provides advanced bleaching technologies for pulp mills that include real-time process monitoring and control to minimize chemical and energy consumption. The company's technologies are proven to achieve uniform pulp quality, which reduces variations in kappa number, significantly improving operational consistency and environmental performance.
Key Challenges
Environmental and Health Concerns
Stringent environmental regulations related to chlorine emissions and toxic byproducts pose a challenge for manufacturers. Prolonged exposure to certain chlorine compounds can harm workers and ecosystems. Compliance with discharge standards increases operational costs and limits the use of traditional agents. Companies are under pressure to develop alternative solutions that maintain performance while minimizing ecological risks and ensuring worker safety.
Fluctuating Raw Material Prices
Volatility in raw material prices, particularly for chlorine and caustic soda, affects production costs and market stability. Supply chain disruptions and varying energy costs further influence pricing structures. Manufacturers face challenges in maintaining profitability while meeting quality and regulatory standards. Developing efficient production methods and securing long-term supply agreements are becoming critical to sustain competitiveness in the global bleaching chemicals market.
Regional Analysis
North America
North America held a 27.3% share in 2024, driven by strong demand from the paper, textile, and water treatment industries. The United States remains the leading market due to well-established pulp and paper manufacturing and high environmental compliance standards. The growing focus on wastewater management and hygiene product production is further boosting consumption. Technological advancements in chlorine dioxide and hydrogen peroxide-based bleaching processes also support regional growth. The adoption of eco-friendly formulations aligns with sustainability goals, strengthening North America’s position in the global bleaching chemicals market.
Europe
Europe accounted for a 25.1% share in 2024, supported by stringent environmental regulations and advancements in green bleaching technologies. Countries such as Germany, Finland, and Sweden lead in sustainable pulp and paper manufacturing, relying on peroxide and oxygen-based bleaching agents. The textile industry’s shift toward environmentally safe processes continues to encourage chemical innovation. Rising water treatment activities across industrial sectors also contribute to steady demand. The region’s strong focus on circular economy principles and low-emission manufacturing enhances its role in shaping future bleaching chemical trends.
Asia Pacific
Asia Pacific dominated the bleaching chemicals market with a 36.4% share in 2024, fueled by rapid industrialization and expanding paper and textile industries. China and India drive major consumption through large-scale production and export-oriented manufacturing. The rise of packaging and hygiene product demand further stimulates growth. Governments are promoting sustainable bleaching alternatives to reduce pollution and improve energy efficiency. Increasing investments in industrial wastewater treatment and the shift toward hydrogen peroxide-based processes support long-term market expansion across the region’s emerging economies.
Middle East & Africa
The Middle East & Africa region captured a 6.5% share in 2024, led by expanding industrial water treatment and chemical processing sectors. Growing infrastructure projects and increased textile production in countries like Saudi Arabia, the UAE, and South Africa drive market growth. Water scarcity challenges are prompting governments to adopt advanced disinfection and bleaching technologies. Although adoption remains moderate, the trend toward eco-friendly solutions and industrial modernization initiatives is creating new opportunities for bleaching chemical suppliers across the region.
Latin America
Latin America represented a 4.7% share in 2024, supported by growing demand from pulp and paper, textile, and water treatment industries. Brazil, Mexico, and Chile lead the market, driven by increasing investment in industrial infrastructure and manufacturing activities. The region is witnessing a gradual shift toward sustainable bleaching agents to meet global export standards. Expanding paper packaging production and government-backed environmental initiatives are fostering market development. Although regulatory frameworks are still evolving, rising awareness of sustainable chemical usage supports steady long-term growth across Latin America.
Market Segmentations:
By Product Type
- Chlorine-based
- Peroxide-based
- Sodium Hypochlorite
- Others
By Application
- Pulp and Paper
- Textile
- Water Treatment
- Others
By End-User
- Industrial
- Commercial
- Residential
By Geography
- North America
- U.S.
- Canada
- Mexico
- Europe
- Germany
- France
- U.K.
- Italy
- Spain
- Rest of Europe
- Asia Pacific
- China
- Japan
- India
- South Korea
- South-east Asia
- Rest of Asia Pacific
- Latin America
- Brazil
- Argentina
- Rest of Latin America
- Middle East & Africa
- GCC Countries
- South Africa
- Rest of the Middle East and Africa
Competitive Landscape
The competitive landscape of the bleaching chemicals market features leading players such as Ashland Global Holdings Inc., Evonik Industries AG, Akzo Nobel N.V., Ecolab Inc., Aditya Birla Chemicals, Kemira Oyj, Arkema Group, Clariant AG, The Dow Chemical Company, and Solvay S.A. These companies compete through technological innovation, capacity expansion, and the development of eco-friendly bleaching solutions. Major players focus on improving product efficiency, safety, and sustainability by adopting green chemistry and low-emission manufacturing processes. Strategic mergers, acquisitions, and collaborations help strengthen global supply chains and broaden application portfolios. Continuous R&D investments in hydrogen peroxide and chlorine-free technologies enhance market competitiveness. Rising environmental regulations and the shift toward sustainable bleaching methods are pushing companies to innovate while maintaining cost efficiency and product performance across diverse industrial applications.
Key Player Analysis
- Ashland Global Holdings Inc.
- Evonik Industries AG
- Akzo Nobel N.V.
- Ecolab Inc.
- Aditya Birla Chemicals
- Kemira Oyj
- Arkema Group
- Clariant AG
- The Dow Chemical Company
- Solvay S.A.
Recent Developments
- In March 2025, Kemira also announced a joint‐venture with International Flavors & Fragrances Inc. (IFF) to build a biobased-materials plant (capable of supplying fibre/bleaching chemical markets) in Finland.
- In January 2025, Evonik Industries AG established a joint venture with Fuhua Tongda Chemicals Company in Leshan, China to produce specialty hydrogen peroxide grades for solar panels, semiconductors and food packaging (bleaching/oxidative agent relevance).
- In 2024, Evonik signed an agreement to supply its “Way to GO₂” certified carbon-neutral hydrogen peroxide to Steinbeis Papier for recycled-paper bleaching applications
Report Coverage
The research report offers an in-depth analysis based on Product Type, Application, End-User and Geography. It details leading market players, providing an overview of their business, product offerings, investments, revenue streams, and key applications. Additionally, the report includes insights into the competitive environment, SWOT analysis, current market trends, as well as the primary drivers and constraints. Furthermore, it discusses various factors that have driven market expansion in recent years. The report also explores market dynamics, regulatory scenarios, and technological advancements that are shaping the industry. It assesses the impact of external factors and global economic changes on market growth. Lastly, it provides strategic recommendations for new entrants and established companies to navigate the complexities of the market.
Future Outlook
- The market will grow steadily with increased industrial demand from pulp, textile, and water treatment sectors.
- Hydrogen peroxide and other green bleaching agents will gain traction due to stricter environmental standards.
- Manufacturers will invest more in chlorine-free and low-emission bleaching technologies to meet regulatory norms.
- Digital process optimization and automation will enhance operational efficiency and product consistency.
- Demand from the paper packaging and hygiene sectors will boost long-term consumption.
- Strategic partnerships between global and regional players will expand distribution networks.
- Energy-efficient production methods will become a key focus to reduce operational costs.
- Asia Pacific will remain the leading region, driven by industrial growth and manufacturing expansion.
- Europe will strengthen its role through sustainable chemical innovation and regulatory compliance.
- Adoption of eco-certified and biodegradable bleaching solutions will shape the market’s future direction.

Request a Free Sample
Fill in your details and we'll send you a free sample report.
- Sample data tables & charts
- Research methodology
Need a Custom Version of This Report?
Tailor the scope, geography, or segments to your exact requirements.
- Custom geography or segment scope
- Direct access to our analyst team
Frequently Asked Questions
What is the current market size for the Bleaching Chemicals market, and what is its projected size in 2032?
At what Compound Annual Growth Rate is the Bleaching Chemicals market projected to grow between 2025 and 2032?
Which Bleaching Chemicals market segment held the largest share in 2024?
What are the primary factors fueling the growth of the Bleaching Chemicals market?
Who are the leading companies in the Bleaching Chemicals market?
Table of Content
Chapter 1 Market Segmentation
- 1.1 Segmentation Framework
- 1.1.1 Product and Service Classification
- 1.1.2 Application and End-Use Classification
- 1.1.3 Technology and Solution Classification
- 1.1.4 Customer and Distribution Channel Classification
- 1.1.5 Geographic Segmentation
- 1.1.6 Market Segment Definitions and Boundaries
Chapter 2 Introduction
- 2.1 Report Objectives and Scope
- 2.2 Product Definition and Industry Terminology
- 2.3 Market Inclusions and Exclusions
- 2.4 Research Process
- 2.4.1 Primary Research and Expert Interviews
- 2.4.2 Secondary Research and Source Review
- 2.4.3 Top-Down and Bottom-Up Estimation
- 2.4.4 Data Triangulation and Verification
- 2.5 Market Size Measurement Basis
- 2.5.1 2024: USD 25 billion → 2032: USD 35.74 billion
- 2.6 Historical and Forecast Reference Periods
- 2.6.1 Base Year: 2024
- 2.6.2 Forecast Period: 2024-2032
- 2.7 Research Assumptions and Limitations
Chapter 3 Executive Summary
- 3.1 Market Snapshot and Key Findings
- 3.2 Base-Year Market Size, 2024
- 3.3 Forecast Market Size, 2032
- 3.4 Revenue and Volume Growth Outlook
- 3.5 Key Demand and Supply Indicators
- 3.6 Leading Market Segments
- 3.7 Fastest-Growing Market Opportunities
- 3.8 Regional Performance Highlights
- 3.9 Technology and Industry Transformation
- 3.10 Competitive Landscape Summary
- 3.11 Analyst View and Strategic Implications
Chapter 4 Global Bleaching Chemicals Market Trends and Developments
- 4.1 Historical Industry Development
- 4.2 Recent Market Trends and Developments
- 4.3 Demand and Customer Behavior Trends
- 4.4 Technology and Product Innovation
- 4.5 Artificial Intelligence, Automation and Digitalization
- 4.6 Local Manufacturing and Supply Chain Realignment
- 4.7 Industry Partnerships, Mergers and Acquisitions
- 4.8 Sustainability and Circular Economy Developments
- 4.9 Government and Private Sector Investment Trends
- 4.10 Emerging Business Models and Commercialization
- 4.11 Industry Developments and Announcements
Chapter 5 Global Bleaching Chemicals Market Production, Supply and Demand Analysis
- 5.1 Demand Trend and Consumption Analysis
- 5.2 Demand Forecast, 2024-2032
- 5.3 Production and Output Trend
- 5.4 Production and Output Forecast, 2024-2032
- 5.5 Installed Capacity and Capacity Utilization
- 5.6 Company-Wise Production Plants and Statistics
- 5.6.1 Installed Production Capacity
- 5.6.2 Actual Production
- 5.6.3 Planned Capacity and Expansion Targets
- 5.7 Supply Chain Structure and Procurement Trends
- 5.8 Supply-Demand Gap and Bottlenecks
- 5.9 Import Dependence and Sourcing Structure
- 5.10 Contract Manufacturing and Outsourcing
- 5.11 Regional Supply and Demand Concentration
Chapter 6 Global Bleaching Chemicals Market Pricing Analysis
- 6.1 Pricing Structure and Measurement
- 6.2 Historical Pricing Trends
- 6.3 Pricing Outlook, 2024-2032
- 6.4 Average Selling Price and Unit Economics
- 6.5 Pricing by Product and Market Segment
- 6.6 Geographic Pricing Differences
- 6.7 Key Input, Energy, Labor and Logistics Costs
- 6.8 Contract Pricing and Purchasing Models
- 6.9 Pricing Sensitivity and Competitive Positioning
- 6.10 Price, Margin and Profitability Implications
Chapter 7 Global Bleaching Chemicals Market Dynamics
- 7.1 Market Growth Drivers
- 7.1.1 Demand-Side Drivers
- 7.1.2 Technology and Innovation Drivers
- 7.1.3 Infrastructure and Investment Drivers
- 7.1.4 Regulatory and Policy Drivers
- 7.2 Market Restraints
- 7.2.1 Cost and Affordability Constraints
- 7.2.2 Technology and Adoption Barriers
- 7.2.3 Supply Chain and Operational Constraints
- 7.3 Market Challenges
- 7.3.1 Competitive Pressure and Margin Erosion
- 7.3.2 Skills, Infrastructure and Implementation Gaps
- 7.4 Emerging Market Opportunities
- 7.5 Market Dynamics Impact and Time-Horizon Assessment
Chapter 8 Global Bleaching Chemicals Value Chain Analysis
- 8.1 Industry Value Chain Overview
- 8.2 Upstream Suppliers and Critical Inputs
- 8.3 Technology and Component Providers
- 8.4 Manufacturing or Service Delivery
- 8.5 Distribution, Channel Partners and Integrators
- 8.6 Downstream Applications and End Users
- 8.7 Value Addition and Profit Pools
- 8.8 Vertical Integration and Outsourcing
- 8.9 Supplier Concentration and Risk
- 8.10 Supply Chain Localization and Resilience
Chapter 9 Global Bleaching Chemicals Market Regulations and Policies
- 9.1 Relevant Laws, Standards and Compliance Frameworks
- 9.2 Product, Service, Safety and Quality Requirements
- 9.3 Government Policies, Incentives and Subsidies
- 9.4 Imports, Exports and Trade Barriers
- 9.5 Public Procurement and Local Content Requirements
- 9.6 Environmental and Sustainability Compliance
- 9.7 Upcoming Policy Changes and Market Implications
Chapter 10 Global Bleaching Chemicals Market Hotspots and Opportunities
- 10.1 Market Opportunity Mapping and Growth Hotspots
- 10.2 High-Growth Applications and Customer Groups
- 10.3 Underserved Markets and White-Space Opportunities
- 10.4 Emerging Technology and Product Opportunities
- 10.5 New Capacity and Investment Hotspots
- 10.6 Market Entry and Expansion Opportunities
- 10.7 Distribution and Partnership Opportunities
- 10.8 Near-Term and Long-Term Commercial Potential
- 10.9 Opportunity Attractiveness and Execution Risks
Chapter 11 Global Bleaching Chemicals Market Outlook, 2024-2032
- 11.1 Market Size and Analysis
- 11.1.1 Revenue (Market Measurement: 2024: USD 25 billion → 2032: USD 35.74 billion)
- 11.1.2 Market Volume and Quantity Sold
- 11.1.3 Historical Market Size
- 11.1.4 Base-Year Market Size, 2024
- 11.2 Market Forecast, 2024-2032
- 11.2.1 Revenue Forecast to 2032
- 11.2.2 Volume Forecast to 2032
- 11.2.3 CAGR and Year-on-Year Growth
- 11.2.4 Incremental Revenue Opportunity
- 11.3 Forecast Assumptions and Scenario Analysis
- 11.3.1 Base-Case Forecast
- 11.3.2 Optimistic and Conservative Scenarios
- 11.3.3 Technology, Pricing and Policy Sensitivities
- 11.4 Market Attractiveness and Growth Outlook
Chapter 12 Global Bleaching Chemicals Market Segmentation and Outlook
- 12.1 Segmentation Summary and Market Shares, 2024
- 12.2 Largest and Fastest-Growing Segments
- 12.3 Segment Growth Comparison
- 12.4 Segment Attractiveness and Priority Matrix
Chapter 13 Global Bleaching Chemicals Geographic Market Outlook, 2024-2032
- 13.1 Regional Market Size and Share, 2024
- 13.2 Regional Market Forecast, 2024-2032
- 13.3 Regional Pricing, Production and Demand Differences
- 13.4 North America
- 13.4.1 United States
- 13.4.2 Canada
- 13.4.3 Mexico
- 13.5 Europe
- 13.5.1 Germany
- 13.5.2 France
- 13.5.3 Italy
- 13.5.4 United Kingdom
- 13.5.5 Spain
- 13.5.6 Poland
- 13.5.7 Russia
- 13.5.8 Netherlands
- 13.5.9 Belgium
- 13.5.10 Sweden
- 13.5.11 Denmark
- 13.5.12 Norway
- 13.5.13 Rest of Europe
- 13.6 Asia Pacific
- 13.6.1 China
- 13.6.2 India
- 13.6.3 Japan
- 13.6.4 South Korea
- 13.6.5 Thailand
- 13.6.6 Indonesia
- 13.6.7 Vietnam
- 13.6.8 Malaysia
- 13.6.9 Australia
- 13.6.10 Rest of Asia Pacific
- 13.7 Latin America
- 13.7.1 Brazil
- 13.7.2 Argentina
- 13.7.3 Colombia
- 13.7.4 Chile
- 13.7.5 Rest of Latin America
- 13.8 Middle East
- 13.8.1 Saudi Arabia
- 13.8.2 United Arab Emirates
- 13.8.3 Turkey
- 13.8.4 Israel
- 13.8.5 Iran
- 13.8.6 Rest of the Middle East
- 13.9 Africa
- 13.9.1 South Africa
- 13.9.2 Egypt
- 13.9.3 Nigeria
- 13.9.4 Morocco
- 13.9.5 Rest of Africa
- 13.10 Regional Investment, Policy and Supply Chain Differences
- 13.11 Regional Competitive Landscape
- 13.12 Geographic Growth Hotspots
Chapter 14 Global Bleaching Chemicals Technology, Innovation and Sustainability Outlook
- 14.1 Technology Landscape and Maturity
- 14.2 Product, Process and Service Innovation
- 14.3 AI, Automation and Digital Tools in the Industry
- 14.4 Technology Adoption and Performance Benchmarking
- 14.5 Innovation Pipeline and R&D Investment
- 14.6 Patent and Intellectual Property Trends
- 14.7 Energy Efficiency and Resource Management
- 14.8 Sustainability, Recycling and Circularity
- 14.9 Technology Roadmap, 2024-2032
- 14.10 Risks of Obsolescence and Technology Substitution
Chapter 15 Global Bleaching Chemicals Market Key Strategic Imperatives
- 15.1 Growth and Market Entry Priorities
- 15.2 High-Return Products and Segments
- 15.3 Pricing, Profitability and Cost Optimization
- 15.4 Technology Investment and Product Differentiation
- 15.5 Supply Chain Localization and Resilience
- 15.6 Distribution and Customer Acquisition
- 15.7 Partnership, Acquisition and Capacity Strategy
- 15.8 Regional Expansion Priorities
- 15.9 Short-, Medium- and Long-Term Actions
Chapter 16 Competition Outlook
- 16.1 Industry Competition Characteristics
- 16.2 Market Structure and Concentration
- 16.3 Market Share and Competitive Positioning, 2024
- 16.4 Company-Wise Revenue and Product Benchmarking
- 16.5 Production and Service Capacity Benchmarking
- 16.6 Technology, Pricing and Differentiation
- 16.7 Regional Footprint and Distribution Strength
- 16.8 Mergers, Acquisitions and Strategic Alliances
- 16.9 New Entrants and Competitive Threats
- 16.10 Porter's Five Forces and Industry Attractiveness
- 16.11 Competitive Outlook, 2024-2032
Chapter 17 Company Profiles
- 17.1 Company Coverage and Selection Criteria
- 17.2 Leading Market Participants – Standard Profile Structure
- 17.2.1 Business Description
- 17.2.2 Company Ownership and Geographic Presence
- 17.2.3 Product and Service Portfolio
- 17.2.4 Manufacturing and Operating Footprint
- 17.2.5 Production Capacity and Expansion Plans
- 17.2.6 Financial Performance and Investment
- 17.2.7 Market Share and Competitive Position
- 17.2.8 Technology and Innovation Capabilities
- 17.2.9 Strategic Alliances or Partnerships
- 17.2.10 Recent Developments
- 17.2.11 Growth Strategy and Outlook
- 17.3 Other Relevant Market Participants
Note: Every listed company is profiled on the structure shown under the first company. The company list is preliminary and may change based on research findings, market developments, data availability and client requirements.
Chapter 18 Disclaimer
- 18.1 Research and Forecast Disclaimer
- 18.2 Data Source and Estimation Limitations
Note: The depth of individual sections depends on data availability for this market. Volume, capacity, trade and other unit-based metrics are included where applicable.

