
Canada physical security shifts to cloud and trusted vendors
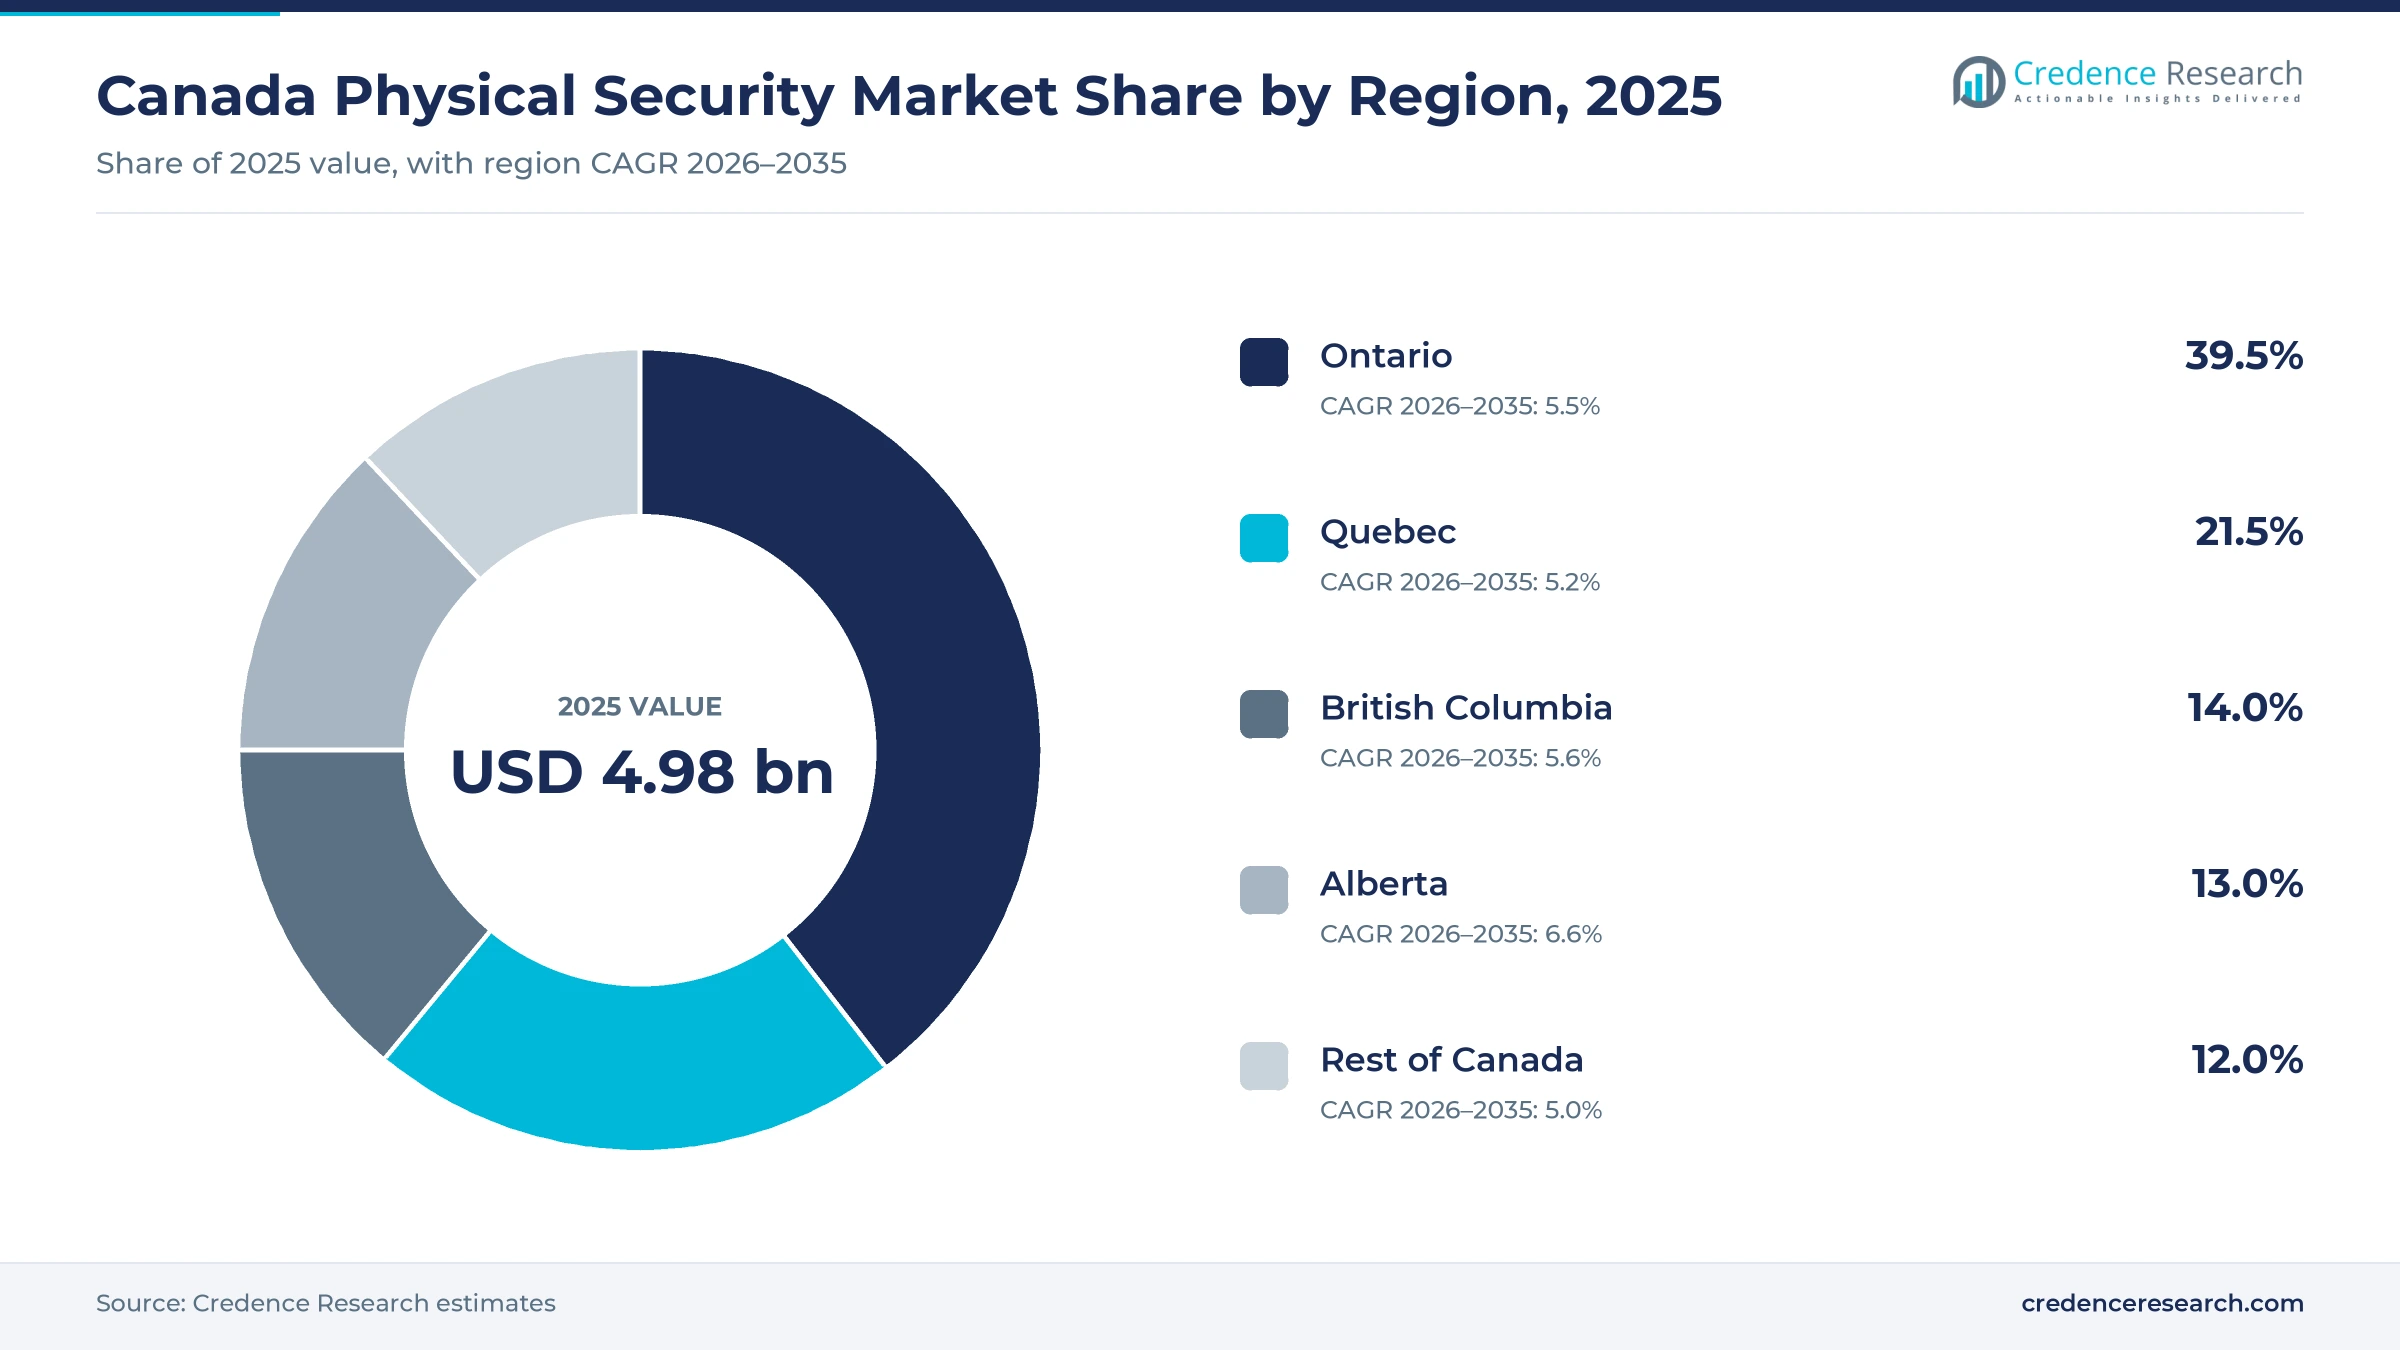
The Canada physical security market was valued at USD 4.98 billion in 2025 and is projected to increase from USD 5.26 billion in 2026 to USD 8.56 billion by 2035, registering a CAGR of 5.57% during 2026–2035. Demand comes from retailers responding to rising shoplifting, federal and provincial agencies upgrading defense, transit and community sites, and operators of new data center campuses that need layered perimeter, entry and video protection. Ontario held the largest regional share, 39.5% in 2025, because it is home to 16.2 million of the country’s 41.6 million residents and to the federal capital, Ottawa. Alberta is the fastest-growing region at 6.6% a year, as it keeps gaining residents from other provinces and hosts a 1 GW server campus now under construction. Buying is also shifting toward cloud-managed platforms, because hosted video and door access cut on-site servers and the maintenance visits they require.
Cameras, door systems, detection and integration define the category
The estimate covers video surveillance cameras, recorders, video management software, analytics and hosted video services, electronic access control readers, controllers, credentials and software, intrusion and perimeter detection with alarm monitoring, visitor management and other security platforms, and the consulting, system integration, maintenance and support services that keep these systems running. It counts purchases by public agencies, businesses, institutions and households, valued at the prices those buyers pay.
The estimate excludes manned guarding, cash logistics, fire alarm and suppression systems, cybersecurity software and mechanical locks sold without electronic control. Most commercial projects move from manufacturers through distributors to systems integrators, while households buy monitored packages from telecom carriers and alarm dealers on multi-year contracts.

Canada Physical Security Market Insights
- The Canada physical security market was valued at USD 4.98 billion in 2025 and is projected to reach USD 8.56 billion by 2035, registering a CAGR of 5.57% during 2026–2035.
- Ontario held a 39.5% share of 2025 value, because it has 16.2 million residents and hosts the federal capital, Ottawa, with its departments and agencies.
- Video surveillance led with a 48.0% share of 2025 value, because cameras, recorders and video software are installed at almost every protected site.
- Police reported 208,941 shoplifting incidents of $5,000 or under in 2025, up 11% from 2024, so retailers keep adding cameras and analytics.
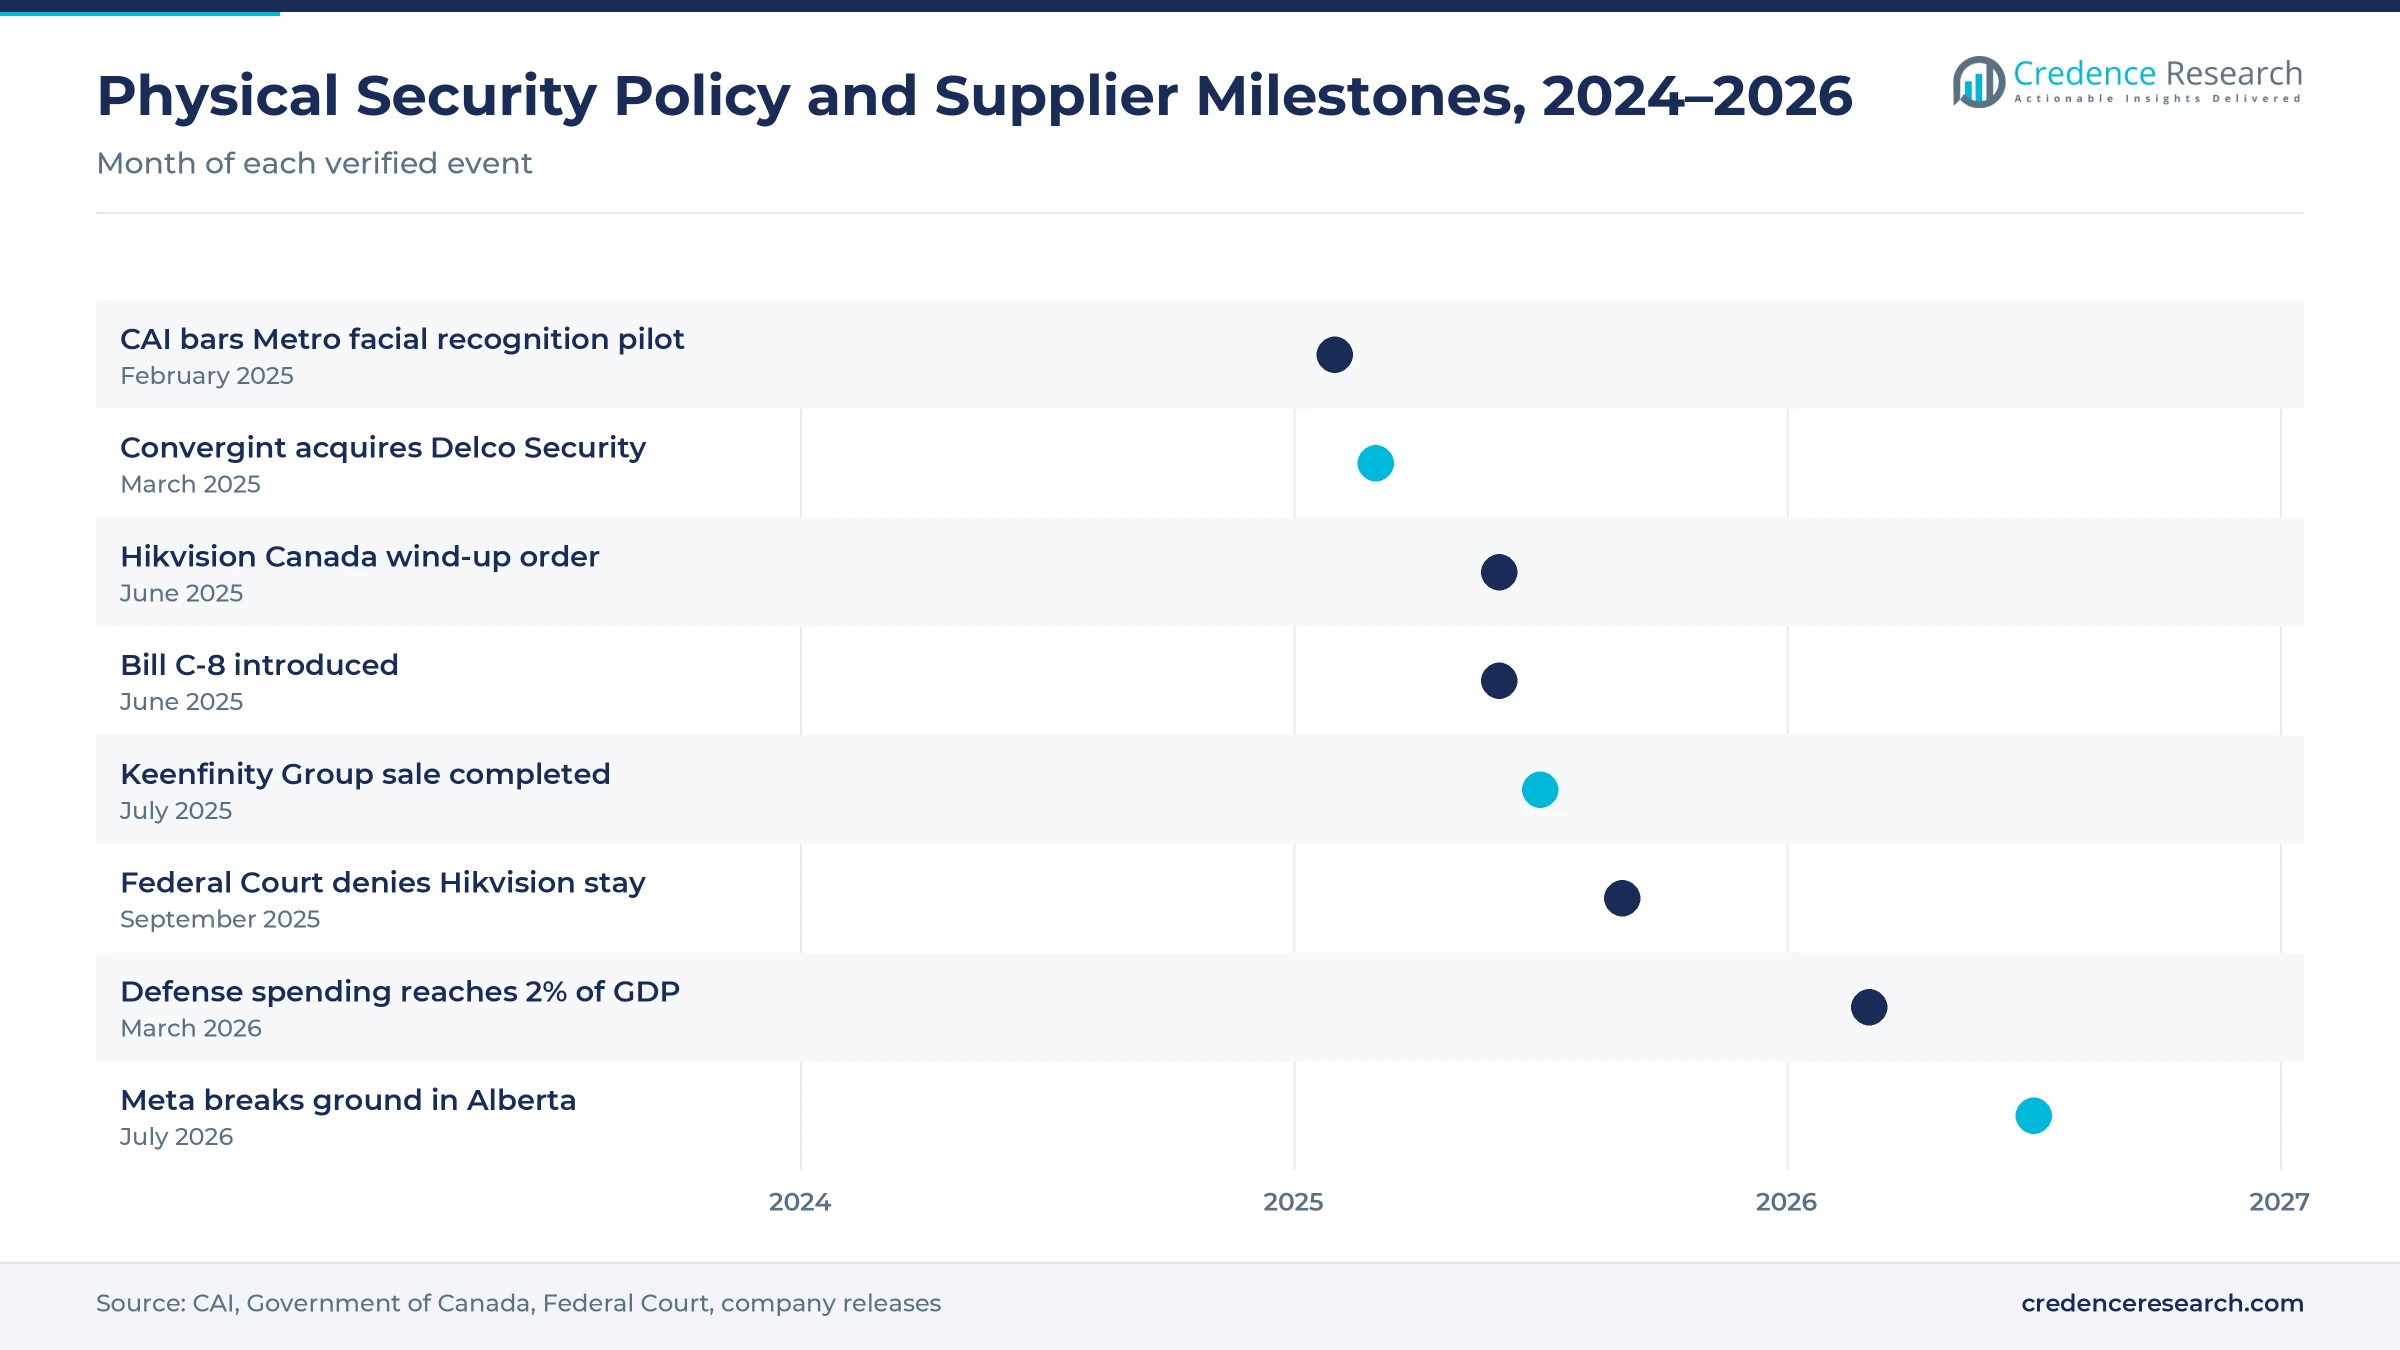
- The Federal Court denied Hikvision a stay on Sept. 16, 2025, so the order to wind up its Canadian business stands while the case continues.
Video leads while cloud door access grows fastest
Why do cameras lead while door access grows fastest?
Based on component, the market is categorized into video surveillance, access control, monitoring and detection, other solutions and services. Video Surveillance led with a 48.0% share of 2025 value, because cameras are installed at almost every protected site and enterprise models carry high unit prices, such as the Axis P3265-LVE outdoor dome that Deploy Depot lists at C$1,184.99. Buyers also move recorded footage into cloud-hosted video surveillance to cut on-site storage. Access Control grows fastest at 6.8% a year, as cloud door systems turn one-time hardware sales into recurring per-door licenses, which Kisi lists at USD 600 to USD 1,600 a year.
Why does government lead while IT and telecom grow fastest?
Based on end use, the market is categorized into government and defense, retail and commercial, BFSI, healthcare and life sciences, IT and telecom, and others. Government and Defense led with a 25.0% share of 2025 value, because federal departments other than National Defence counted more than C$14 billion of 2025–26 spending toward the defense total. IT and Telecom grows fastest at 7.1% a year, because server campuses such as the Alberta site specify perimeter, mantrap and biometric entry before tenants arrive. Campus operators buy layered protection for server halls before construction ends.
Why do large enterprises lead while smaller firms grow faster?
Based on organization size, the market is categorized into large enterprises and small and medium enterprises. Large Enterprises led with a 64.0% share of 2025 value, because campus-scale projects in corrections, hospitals, universities, utilities and government combine video, access and intrusion systems, and Delco Security alone delivered more than 600 such projects across the country over a decade, according to Convergint. Small and Medium Enterprises grow fastest at 6.1% a year, as monitored packages bundle equipment into a monthly fee, with TELUS plans for professionally monitored video starting at C$52 a month on a five-year term, according to Reviews.org.
| Segment Group | Leading Sub-segment | Share, 2025 | Fastest-growing Sub-segment | CAGR, 2026–2035 |
|---|---|---|---|---|
| By Component | Video Surveillance | 48.0% | Access Control | 6.8% |
| By End Use | Government and Defense | 25.0% | IT and Telecom | 7.1% |
| By Organization Size | Large Enterprises | 64.0% | Small and Medium Enterprises | 6.1% |
Hardware lists high while recurring fees win the margin
Pricing splits between one-time hardware and installation and recurring software, cloud and monitoring fees. Enterprise cameras list above C$1,000 each, and integrators add labor, cabling, licenses and programming that often match the hardware cost. Cloud door systems move spending to per-door subscriptions, which Kisi says bring the average first-year cost to about USD 3,850 per door. Residential carriers fold equipment into multi-year monthly contracts, which lowers the entry price but locks in churn risk. Suppliers that own the software and the monitoring contract keep the highest margins, while hardware resellers compete mainly on price.
| Offer | Typical price or fee | Basis |
|---|---|---|
| Axis P3265-LVE outdoor dome camera | C$1,184.99 per camera | Deploy Depot listing, November 2026 |
| Cloud door access license | USD 600–1,600 per door a year | Kisi pricing guide, 2026 |
| Cloud access control, first year | About USD 3,850 per door | Kisi pricing guide, 2026 |
| TELUS Secure + Video monitored plan | C$52–57 a month | Reviews.org, December 2023 |
| TELUS Control + Video monitored plan | C$59–67 a month | Reviews.org, December 2023 |
Request a Free Sample
Fill in your details and we'll send you a free sample report.
- Sample data tables & charts
- Research methodology
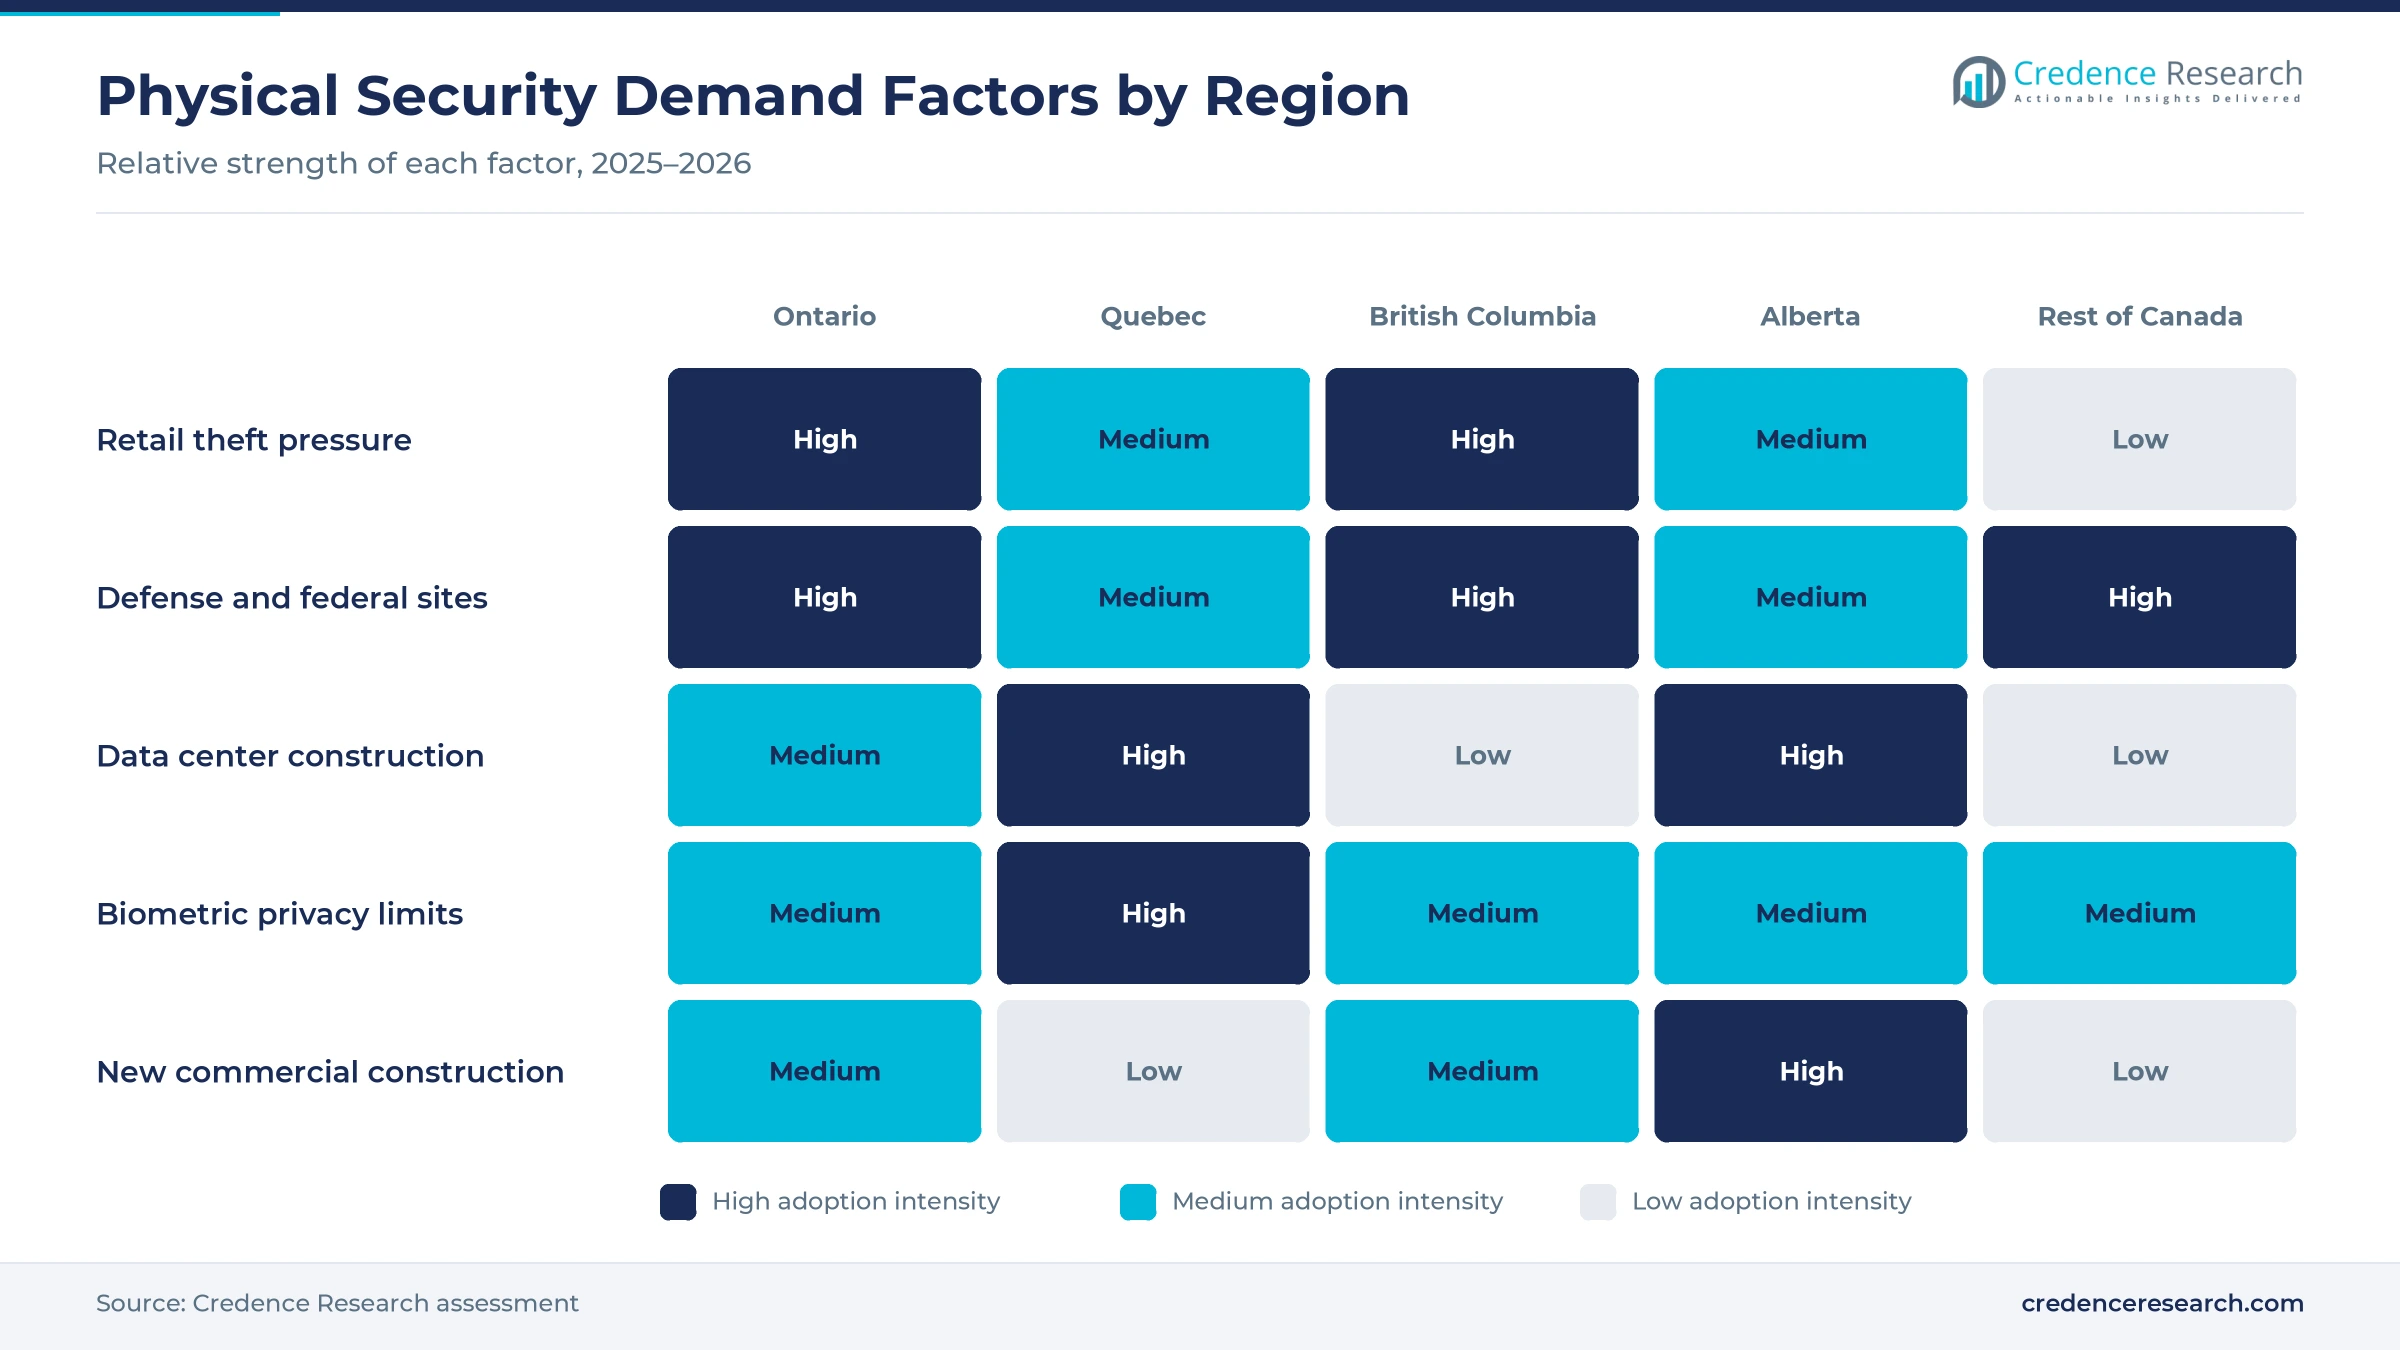
Retail theft, defense budgets and data centers lift demand
How does rising shoplifting push retailers toward cameras?
Retail theft is the clearest crime trend that still moves security budgets, because store losses rise even as most other offenses fall. Police reported 208,941 shoplifting incidents of $5,000 or under in 2025, a rate of 502 per 100,000 residents and up 11% from 2024, according to Statistics Canada. The rate has risen five years in a row and by 79% since 2015. The Retail Council of Canada put retail theft losses above C$9 billion a year in October 2025, a figure that justifies analytics cameras, electronic article surveillance links and remote monitoring at the store level. Retailers with large-format grocery and pharmacy stores face the highest exposure, so they buy first when loss rates climb.
Why do defense and federal budgets widen secure-site spending?
Federal spending is the steadiest source of large physical security orders, because every new base, jetty, depot and research site needs perimeter detection, access control and video before it can operate. Canada reached the NATO benchmark of 2% of GDP in fiscal 2025–26 with more than C$63 billion of defense investment, according to the Department of National Defence. The same backgrounder lists about C$59 billion of defense infrastructure over 10 years and a path toward 5% of GDP by 2035. Public Safety Canada also funds security upgrades at community gathering spaces through a program that pays up to C$1.5 million per project. Integrators holding facility security clearances gain most from this pipeline.
How do new server campuses create large perimeter projects?
Data center construction adds some of the largest single security projects in the country, because each campus needs fencing, vehicle barriers, mantraps, biometric entry and dense camera coverage before tenants move in. Meta broke ground in July 2026 on a 1 GW campus in Sturgeon County, Alberta, an investment of more than C$13 billion that will need about 3,000 construction workers at peak, according to Meta. Institutional building permits also rose by C$1.9 billion in 2025, according to Statistics Canada. These hyperscale campuses buy from integrators that can certify layered entry systems, and that work favors integrators with data hall references.
Why does the Hikvision order open a camera replacement cycle?
The federal order against Hikvision forces the largest brand switch the camera installed base has seen, because buyers must plan for equipment that no longer has a local seller or support. The government ordered Hikvision Canada to wind up its business on June 27, 2025, after a national security review under the Investment Canada Act. The Federal Court denied a stay on Sept. 16, 2025, finding that national security risks outweighed the company’s commercial harm. Municipal, school and retail owners with older recorders now budget for replacements, which shifts replacement orders to brands that remain eligible for public tenders and keep Canadian support.
Cloud platforms and data residency reshape buying
How are integrators shifting video and access to the cloud?
Integrators are shifting customers from on-site servers toward cloud-managed platforms to cut maintenance visits, creating openings for subscription video, access and intrusion services across multi-site owners. Genetec added intrusion management to Security Center SaaS in February 2025, and in June 2025 it let customers connect cameras, door controllers and intrusion panels that are not cloud-ready through Genetec appliances, which avoids replacing working hardware. Motorola Solutions announced Alta SOS for Avigilon Alta on March 31, 2025, so a site can share floor plans, camera feeds and door access with 911 dispatchers during an emergency. These releases favor suppliers that sell cloud-managed door access, where per-door subscriptions replace one-time controller sales.
Why are data residency and vendor trust rising in tenders?
Public buyers are shifting toward suppliers that keep data in the country and show a clean ownership chain, because security reviews now reach camera hardware. Genetec began hosting its Cloudrunner vehicle investigation platform on Microsoft Azure in Canada in July 2025, according to Security Sales and Integration. Bill C-8 received royal assent in June 2026, and its Telecommunications Act amendments let the government order telecom providers to stop using products that pose security risks, according to Gowling WLG. The 2025 exclusion of a major camera brand shows how quickly a supplier can lose access, and Keenfinity Group, with about 4,300 employees and owned by Triton since July 1, 2025, shows that ownership changes reach familiar brands, so tenders now ask who owns the manufacturer.
Community spaces and schools open a funded retrofit niche
Places of worship, community centers and schools offer a funded retrofit opening, because grant programs now cover cameras, lighting, access hardware and alarm systems that small operators could not afford alone. Police reported 4,882 hate crimes in 2024, the sixth annual increase and 169% more than in 2018, according to Statistics Canada. The Canada Community Security Program has funded more than 770 projects and pays up to 70% of project costs, according to Public Safety Canada. Ontario also set aside C$30 million for school safety in its March 2024 budget, including cameras and vape detectors, according to Global News. Dealers that prepare grant paperwork for these buyers can win steady small projects.
Defense bases and Arctic sites create a secure-site opening
Military bases, ports and northern radar sites offer the largest new perimeter opening, because NORAD modernization and Arctic plans add remote facilities that need intrusion detection, access control and long-range video. The Department of National Defence lists C$87.4 billion over 20 years for NORAD modernization, and describes a C$32 billion Arctic sovereignty and infrastructure plan as part of that modernization. Its projects include C$1.1 billion for Esquimalt jetties in British Columbia and C$1.2 billion to modernize power and municipal service infrastructure at CFB Halifax Dockyard and Stadacona. Integrators with cleared staff, cold-weather installation experience and Canadian supply chains stand to win these contracts.
Privacy rulings, a softer build cycle and vendor exit costs
How do Quebec biometric rulings limit facial recognition?
Quebec privacy law sets the strictest limits on biometric security in the country, which slows facial recognition projects. The Commission d’accès à l’information barred Metro Inc. from a facial recognition pilot against shoplifting on Feb. 18, 2025, because the grocer could not obtain express consent from each visitor. On Sept. 4, 2024, it ordered Transcontinental Printing to stop using facial recognition at facility entrances. Retailers and employers that planned biometric entry face redesigns toward cards and mobile credentials.
Why does a softer building cycle slow new installations?
New construction drives much of the integration work, so a slower building cycle cuts the flow of new projects. Non-residential building permits fell by C$739.8 million to C$52.9 billion in constant dollars in 2025, the first annual decline since 2020, according to Statistics Canada. Industrial permits dropped by C$3.4 billion to C$9.4 billion after a record 2024. Integrators that depend on new warehouses and plants in Quebec and Ontario are most exposed, while retrofit and service contracts soften the gap.
How does the Hikvision exit raise costs for installed sites?
The wind-up order required Hikvision Canada to cancel sales orders, end marketing and after-sales support and terminate employees and contractors within 120 days, according to Norton Rose Fulbright. Owners with large fleets of its recorders must budget for early replacement or accept unpatched devices. Small dealers that built their business on the brand face retraining, new distributor terms and margin pressure. The Federal Court case continues as a specially managed proceeding, so owners still plan budgets without a ruling on the merits.
Why does falling burglary weaken residential alarm urgency?
Falling household crime weakens the urgency that once sold home alarm contracts. Police-reported breaking and entering fell 11% to 264 incidents per 100,000 residents in 2025, the third straight annual decline, while motor vehicle theft fell 16% to 201 per 100,000, according to Statistics Canada data reported by CP24. Alarm dealers and carriers selling residential monitoring face slower sign-ups and more price-driven churn, which pushes them toward video, smart home and insurance-linked bundles.
Ontario leads on scale while Alberta grows fastest
The Canada physical security market is split into Ontario, Quebec, British Columbia, Alberta and the rest of the country. Zone shares and growth rates are Credence Research estimates based on population, building permits, defense and data center projects and the location of major suppliers.
| Region | Value, 2025 (USD billion) | Share, 2025 | CAGR, 2026–2035 |
|---|---|---|---|
| Ontario | 1.97 | 39.5% | 5.5% |
| Quebec | 1.07 | 21.5% | 5.2% |
| British Columbia | 0.70 | 14.0% | 5.6% |
| Alberta | 0.65 | 13.0% | 6.6% |
| Rest of Canada | 0.60 | 12.0% | 5.0% |
Why does Ontario hold the largest share?
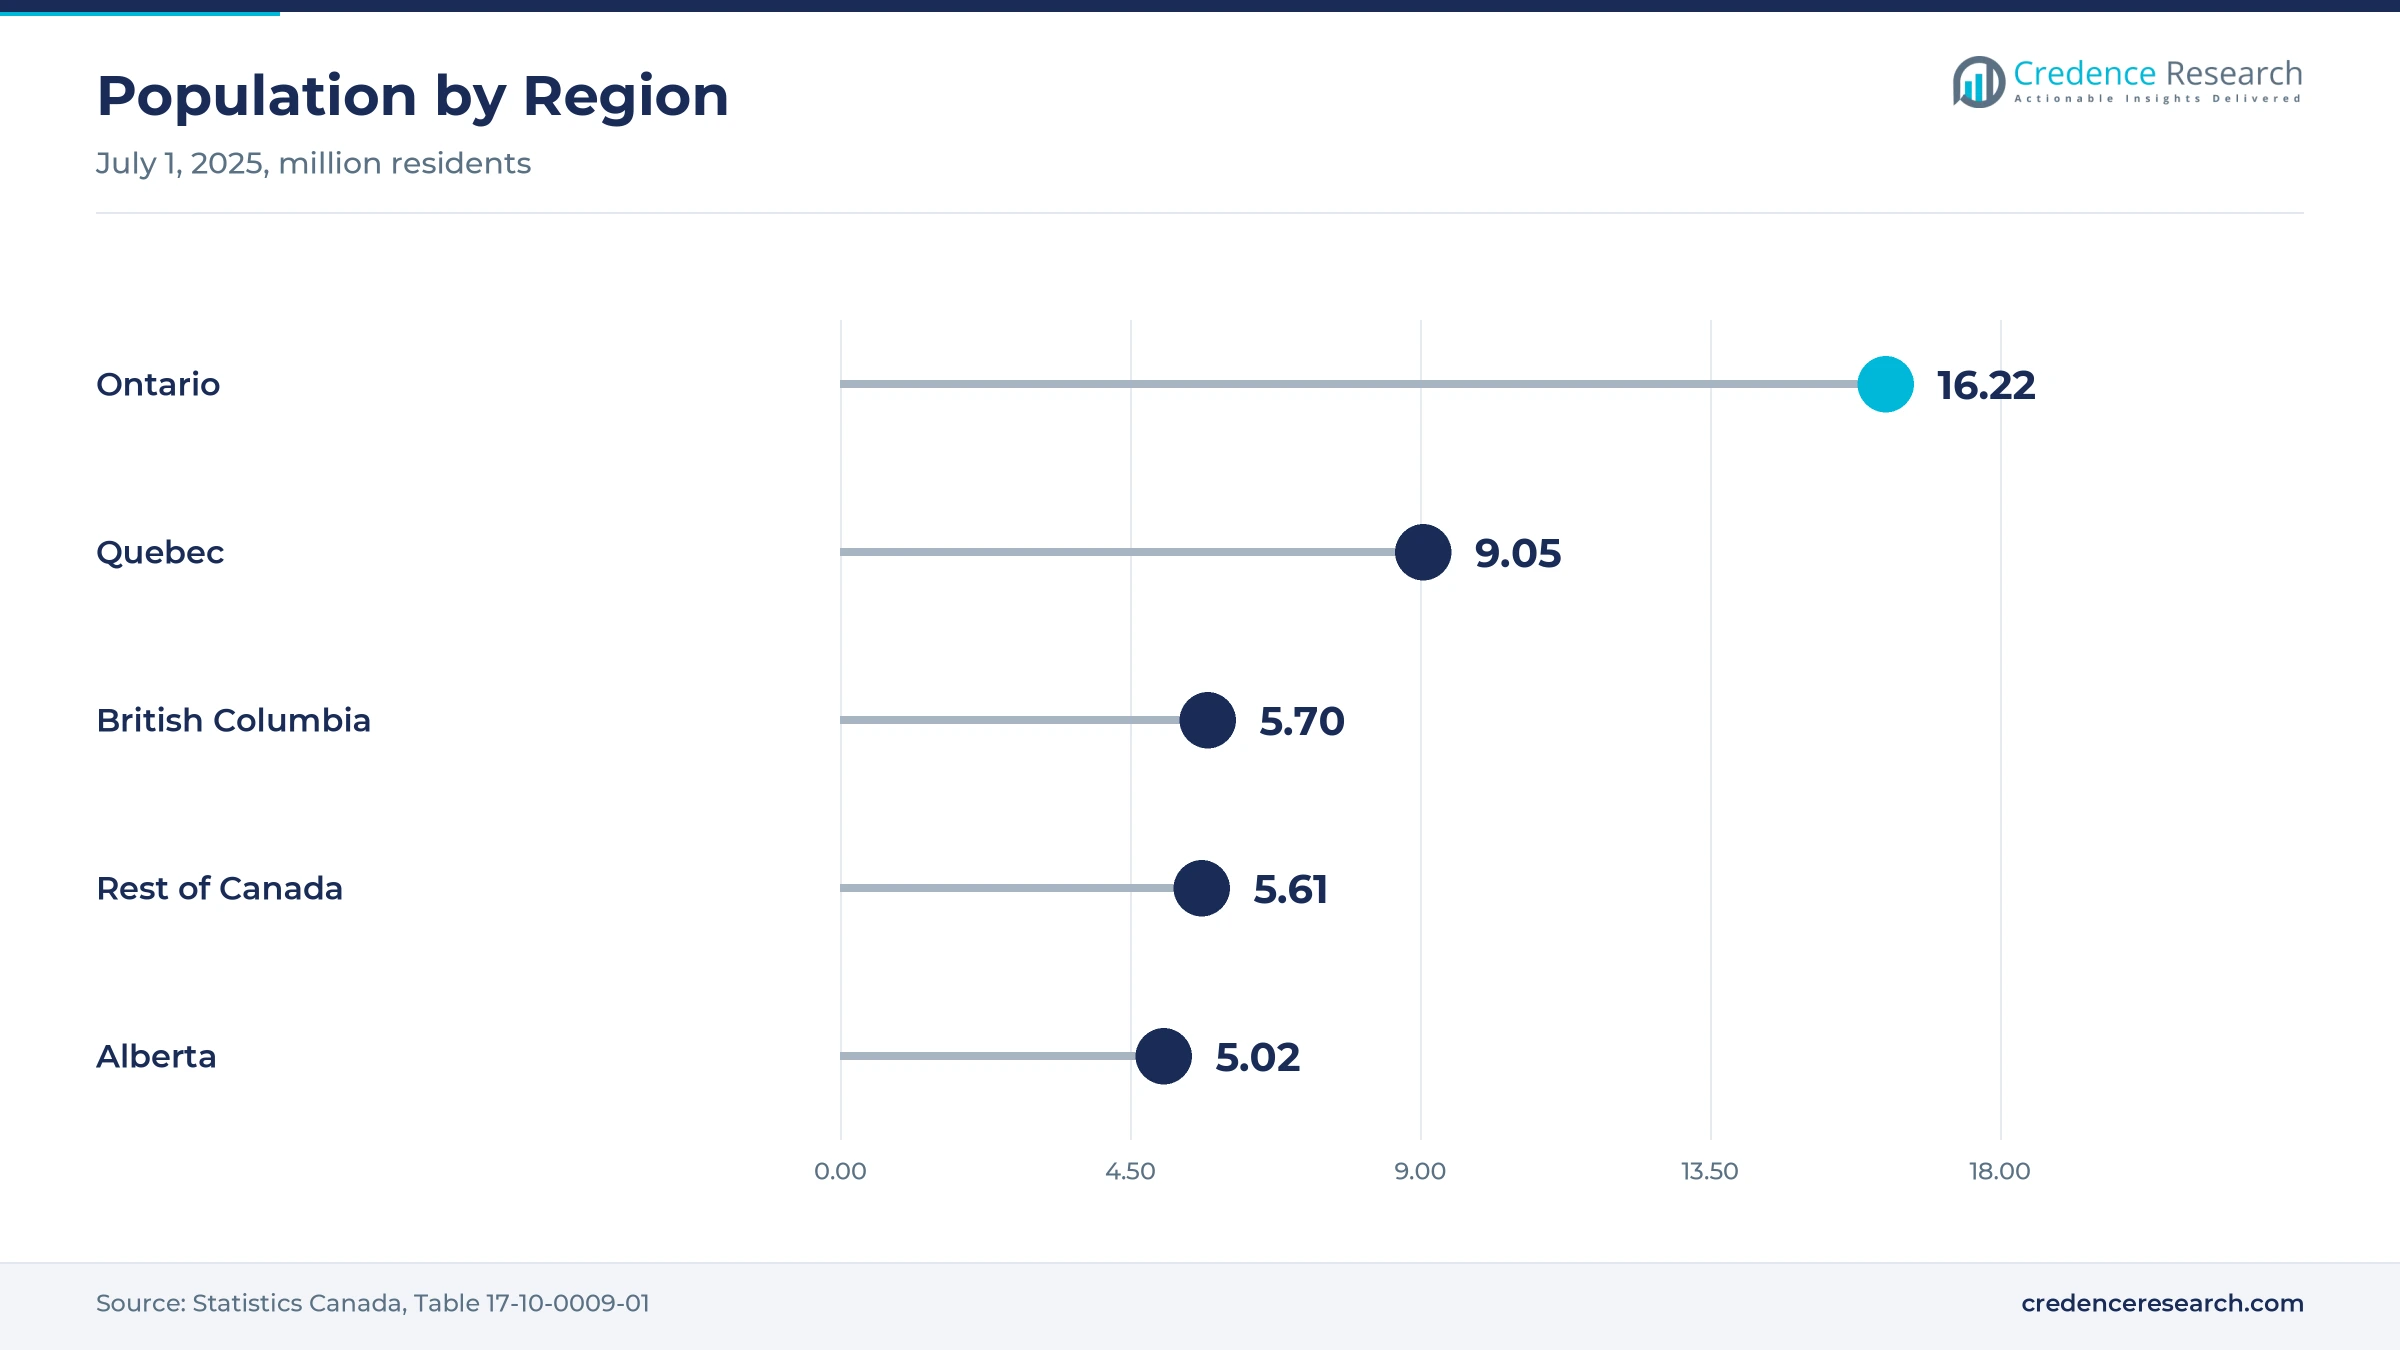
Ontario held a 39.5% share of 2025 value and grows at 5.5% a year, because it had 16.22 million residents on July 1, 2025, the largest provincial population, according to Statistics Canada. It also holds the federal capital, where departments and agencies run many of the most heavily secured buildings in the country. Growth is held back by a C$1.5 billion fall in non-residential permits in 2025 and by net losses of residents to other provinces for 15 straight quarters to mid-2025. Retrofit, replacement and monitoring contracts keep the province ahead of every other zone.
How does a home-grown software base shape Quebec?
Quebec held 21.5% of 2025 value and grows at 5.2% a year, with 9.05 million residents in July 2025. Montreal is home to Genetec, which expanded its headquarters campus to 395,000 square feet in July 2025 and employs more than 2,150 people worldwide. Quebec law also requires any organization to declare a biometric database to the privacy regulator at least 60 days before it starts operating, which steers projects toward card and mobile credentials. Non-residential permits fell by C$2.1 billion in 2025, the largest provincial drop.
Why is British Columbia a supplier and retail theft hub?
British Columbia held 14.0% of 2025 value and grows at 5.6% a year, with 5.70 million residents. Vancouver hosts Avigilon, now part of Motorola Solutions, and Paladin Technologies, which Bosch agreed to buy in July 2023 to expand its building services business. Institutional permits rose 68.0% in 2025, and RCMP in Richmond said supermarket theft had doubled in early 2026 from a year earlier, according to CP24. The Esquimalt jetty project adds secure-site work on Vancouver Island.
Why does Alberta grow fastest?
Alberta held 13.0% of 2025 value and grows fastest at 6.6% a year, because it led all provinces in net interprovincial migration for 12 straight quarters to mid-2025 and reached 5.02 million residents. Institutional permits rose 104.7% in 2025, the largest increase on record for the province. Meta’s 1 GW Sturgeon County campus near Edmonton, noted above, will need perimeter, entry and video systems at a scale few Canadian sites have required. Oil sands, pipeline and utility sites add steady critical-infrastructure demand.
How do bases and small cities shape the rest of Canada?
The rest of Canada held 12.0% of 2025 value and grows at 5.0% a year, covering Manitoba, Saskatchewan, the Atlantic provinces and the territories with about 5.6 million residents. Demand rests on public buildings, health networks, ports and military sites, including the C$1.2 billion of power and municipal infrastructure work at CFB Halifax listed by the Department of National Defence. Smaller cities rely on regional dealers and national integrators, and public data on security spending by province are thin, so this zone estimate is the least certain.
A vendor ban, integrator deals and campuses since 2025
| Development | Status and market relevance |
|---|---|
| In March 2025, Convergint acquired Delco Security, a master systems integrator that has delivered more than 600 projects across Canada. | Completed acquisition that widens Convergint’s national integration coverage |
| In June 2025, the federal government ordered Hikvision Canada to wind up its business and barred federal departments from its products. | Government order in force, with the stay request denied by the Federal Court in September 2025 |
| In July 2025, Triton completed its purchase of the Bosch security and communications product business, now Keenfinity Group. | Completed transaction, with Bosch keeping its building services integration arm |
| In July 2025, Genetec began hosting Cloudrunner in Canada on Microsoft Azure and expanded its Montreal headquarters. | Service launch and completed office expansion |
| In July 2026, Meta broke ground on a 1 GW data center campus in Sturgeon County, Alberta. | Construction started, with more than C$13 billion planned |
Analytics, cloud bridges and phone credentials reshape sites
- Video analytics with natural-language search lets operators find events across hundreds of cameras by describing them in plain words, so a retail loss team or campus control room can review an incident in minutes rather than hours.
- Cloud bridge appliances connect existing cameras, door controllers and intrusion panels to hosted platforms, so owners can move to subscriptions without ripping out hardware that still works.
- Mobile and card credentials replace facial templates where Quebec rules restrict biometrics, giving employers and retailers a compliant way to control entry at doors and turnstiles.
- Perimeter sensors and radar extend intrusion detection systems to fences, yards and remote sites, which suits bases, utilities and server campuses.
Need a Custom Version of This Report?
Tailor the scope, geography, or segments to your exact requirements.
- Custom geography or segment scope
- Direct access to our analyst team
Platform owners and national integrators set the pace
Competition centers on software platforms and national integration capacity rather than on hardware alone. Genetec, based in Montreal, supplies video, access and license plate software and now hosts Cloudrunner in Canada. Motorola Solutions sells Avigilon cameras, Unity software and Alta cloud services, and Axis Communications competes on network cameras. Keenfinity Group took over the former Bosch product range in July 2025, while Bosch keeps Paladin Technologies as a national integrator. Convergint added Delco Security in 2025, and Securitas Technology runs branches from Victoria to Ottawa. Johnson Controls, Honeywell, Siemens and Schneider Electric sell access and building security platforms, and TELUS sells residential and small business monitoring after buying ADT Canada in 2019. Suppliers that combine software with service contracts hold the strongest positions.
How is the supply side organized?
The supply side has three layers that rarely compete head-on. Platform and device makers such as Genetec, Motorola Solutions with Avigilon, Axis Communications, Keenfinity Group, Honeywell and Johnson Controls design cameras, controllers and software and sell through distributors. National integrators such as Paladin Technologies, Convergint and Securitas Technology design and install multi-site systems and hold service contracts. Carriers and dealers such as TELUS serve households and small businesses with monitored packages. Entry barriers are highest in government and defense work, where security clearances and supplier vetting apply, and margins sit with software licenses and recurring monitoring.
Which suppliers do Canadian buyers shortlist?
| Company | Type | Role in the market |
|---|---|---|
| Johnson Controls International | Full-line supplier | Access control, video and intrusion platforms with integration and service |
| Honeywell International Inc. | Full-line supplier | Commercial access control, video and building security software |
| Motorola Solutions (Avigilon) | Platform and device maker | Avigilon cameras, Unity software and Alta cloud video and access |
| Genetec | Software platform owner | Security Center, Security Center SaaS and Cloudrunner from its Montreal base |
| Axis Communications (Canon) | Device maker | Network cameras, door controllers and audio devices sold through distributors |
| Robert Bosch GmbH (Paladin Technologies) | National integrator | Design, installation and service of security systems through Paladin |
| Keenfinity Group | Device maker | Former Bosch video, access and intrusion products, owned by Triton since 2025 |
| Securitas Technology (Securitas AB) | Integrator and monitoring provider | Electronic security installation and monitoring from branches across Canada |
| Convergint | National integrator | Systems integration for corrections, health, education and government sites |
| TELUS (SmartHome Security) | Residential and small business provider | Monitored alarm and video packages on multi-year contracts |
| Siemens AG (Smart Infrastructure) | Building technology supplier | Building security and access platforms within smart building projects |
| Schneider Electric | Building technology supplier | EcoStruxure Security Expert access control within building management |
Why supplier trust now weighs as much as price
Credence Research's view is that Canadian physical security spending will grow steadily rather than sharply, because replacement and recurring services now matter more than new construction. The 2025 exclusion of a major camera brand has made supplier trust a buying criterion in public and regulated tenders, which favors Canadian software owners and established Western device makers. Defense, data center and retail theft budgets add large projects, while Quebec privacy rules and a softer building cycle limit some segments. Integrators that pair cloud platforms with cleared staff and monitoring contracts should gain share by 2035, while hardware-only resellers face the steepest price pressure.
Component build-up and public data anchor the estimate
The report uses 2025 as the base year on a calendar basis, and market values come from the Credence Research model. The earlier estimate was brought forward to 2025 at its own growth rate and cross-checked with a build-up of video, access control, detection and service values and a top-down share of global spending. Segment splits and zone shares are Credence Research estimates from public data. Sources used are official statistics, agency and court documents, company releases, retailer listings and trade press, and no interviews or surveys were used.
Replacement, defense and cloud access carry growth
The Canada physical security market is expected to reach USD 8.56 billion by 2035, registering a 5.57% CAGR during 2026–2035, as camera replacement, defense sites and data center campuses lift spending. Growth should be strongest in access control, IT and telecom buyers and Alberta, because these areas gain most from cloud subscriptions, new server campuses and population growth. Privacy limits on biometrics, slower non-residential construction and uneven federal project timing could slow some years. Suppliers that keep data in the country and sell recurring services should hold the strongest positions.
What decides the range of outcomes to 2035?
The base case assumes defense and data center projects proceed on schedule, retail theft stays high and non-residential construction recovers slowly from 2025. The downside case follows delayed federal projects, a longer construction slowdown and tighter privacy limits on video analytics. The upside case needs faster replacement of excluded cameras, a quicker move to cloud door access in small businesses and more hyperscale campuses in Alberta and Quebec.
| Scenario | CAGR, 2026–2035 | Value, 2035 | What has to hold |
|---|---|---|---|
| Downside | 4.3% | USD 7.66 billion | Federal projects slip and non-residential construction stays weak through 2028 |
| Base | 5.57% | USD 8.56 billion | Defense, data center and retail projects proceed at the pace announced |
| Upside | 6.8% | USD 9.48 billion | Camera replacement, cloud access adoption and new campuses all run faster |
Frequently Asked Questions
How big is the Canada physical security market?
Which region leads physical security spending in Canada?
How fast is access control growing in Canada?
What is driving demand for security cameras in Canada?
What do security services include in this market?
Why was Hikvision banned in Canada?
How are schools and community sites funding security upgrades?
How much does a business security system cost in Canada?
Table of Content
Chapter 1 Market Segmentation
- 1.1 Segmentation Framework
- 1.1.1 Product and Service Classification
- 1.1.2 Application and End-Use Classification
- 1.1.3 Technology and Solution Classification
- 1.1.4 Customer and Distribution Channel Classification
- 1.1.5 Geographic Segmentation
- 1.1.6 Market Segment Definitions and Boundaries
- 1.2 By Component
- 1.2.1 Video Surveillance
- 1.2.2 Services
- 1.2.3 Access Control
- 1.2.4 Monitoring and Detection
- 1.2.5 Other Solutions
- 1.3 By End Use
- 1.3.1 Government and Defense
- 1.3.2 Others
- 1.3.3 Retail and Commercial
- 1.3.4 BFSI
- 1.3.5 Healthcare and Life Sciences
- 1.3.6 IT and Telecom
- 1.4 By Organization Size
- 1.4.1 Large Enterprises
- 1.4.2 Small and Medium Enterprises
Chapter 2 Introduction
- 2.1 Report Objectives and Scope
- 2.2 Product Definition and Industry Terminology
- 2.3 Market Inclusions and Exclusions
- 2.4 Research Process
- 2.4.1 Primary Research and Expert Interviews
- 2.4.2 Secondary Research and Source Review
- 2.4.3 Top-Down and Bottom-Up Estimation
- 2.4.4 Data Triangulation and Verification
- 2.5 Market Size Measurement Basis
- 2.5.1 2025: USD 4.98 billion → 2035: USD 8.56 billion
- 2.6 Historical and Forecast Reference Periods
- 2.6.1 Historical Period: 2018-2025
- 2.6.2 Base Year: 2025
- 2.6.3 Forecast Period: 2025-2035
- 2.7 Research Assumptions and Limitations
Chapter 3 Executive Summary
- 3.1 Market Snapshot and Key Findings
- 3.2 Base-Year Market Size, 2025
- 3.3 Forecast Market Size, 2035
- 3.4 Revenue and Volume Growth Outlook
- 3.5 Key Demand and Supply Indicators
- 3.6 Leading Market Segments
- 3.7 Fastest-Growing Market Opportunities
- 3.8 Regional Performance Highlights
- 3.9 Technology and Industry Transformation
- 3.10 Competitive Landscape Summary
- 3.11 Analyst View and Strategic Implications
Chapter 4 Canada Physical Security Market Trends and Developments
- 4.1 Historical Industry Development, 2018-2025
- 4.2 Recent Market Trends and Developments
- 4.3 Demand and Customer Behavior Trends
- 4.4 Technology and Product Innovation
- 4.5 Artificial Intelligence, Automation and Digitalization
- 4.6 Local Manufacturing and Supply Chain Realignment
- 4.7 Industry Partnerships, Mergers and Acquisitions
- 4.8 Sustainability and Circular Economy Developments
- 4.9 Government and Private Sector Investment Trends
- 4.10 Emerging Business Models and Commercialization
- 4.11 Industry Developments and Announcements
Chapter 5 Canada Physical Security Market Production, Supply and Demand Analysis
- 5.1 Demand Trend and Consumption Analysis, 2018-2025
- 5.2 Demand Forecast, 2025-2035
- 5.3 Production and Output Trend, 2018-2025
- 5.4 Production and Output Forecast, 2025-2035
- 5.5 Installed Capacity and Capacity Utilization
- 5.6 Company-Wise Production Plants and Statistics
- 5.6.1 Installed Production Capacity
- 5.6.2 Actual Production
- 5.6.3 Planned Capacity and Expansion Targets
- 5.7 Supply Chain Structure and Procurement Trends
- 5.8 Supply-Demand Gap and Bottlenecks
- 5.9 Import Dependence and Sourcing Structure
- 5.10 Contract Manufacturing and Outsourcing
- 5.11 Regional Supply and Demand Concentration
Chapter 6 Canada Physical Security Market Pricing Analysis
- 6.1 Pricing Structure and Measurement
- 6.2 Historical Pricing Trends, 2018-2025
- 6.3 Pricing Outlook, 2025-2035
- 6.4 Average Selling Price and Unit Economics
- 6.5 Pricing by Product and Market Segment
- 6.6 Geographic Pricing Differences
- 6.7 Key Input, Energy, Labor and Logistics Costs
- 6.8 Contract Pricing and Purchasing Models
- 6.9 Pricing Sensitivity and Competitive Positioning
- 6.10 Price, Margin and Profitability Implications
Chapter 7 Canada Physical Security Market Dynamics
- 7.1 Market Growth Drivers
- 7.1.1 Demand-Side Drivers
- 7.1.2 Technology and Innovation Drivers
- 7.1.3 Infrastructure and Investment Drivers
- 7.1.4 Regulatory and Policy Drivers
- 7.2 Market Restraints
- 7.2.1 Cost and Affordability Constraints
- 7.2.2 Technology and Adoption Barriers
- 7.2.3 Supply Chain and Operational Constraints
- 7.3 Market Challenges
- 7.3.1 Competitive Pressure and Margin Erosion
- 7.3.2 Skills, Infrastructure and Implementation Gaps
- 7.4 Emerging Market Opportunities
- 7.5 Market Dynamics Impact and Time-Horizon Assessment
Chapter 8 Canada Physical Security Value Chain Analysis
- 8.1 Industry Value Chain Overview
- 8.2 Upstream Suppliers and Critical Inputs
- 8.3 Technology and Component Providers
- 8.4 Manufacturing or Service Delivery
- 8.5 Distribution, Channel Partners and Integrators
- 8.6 Downstream Applications and End Users
- 8.7 Value Addition and Profit Pools
- 8.8 Vertical Integration and Outsourcing
- 8.9 Supplier Concentration and Risk
- 8.10 Supply Chain Localization and Resilience
Chapter 9 Canada Physical Security Market Regulations and Policies
- 9.1 Relevant Laws, Standards and Compliance Frameworks
- 9.2 Product, Service, Safety and Quality Requirements
- 9.3 Government Policies, Incentives and Subsidies
- 9.4 Imports, Exports and Trade Barriers
- 9.5 Public Procurement and Local Content Requirements
- 9.6 Environmental and Sustainability Compliance
- 9.7 Data Protection, AI and Cybersecurity Compliance
- 9.8 Upcoming Policy Changes and Market Implications
Chapter 10 Canada Physical Security Market Hotspots and Opportunities
- 10.1 Market Opportunity Mapping and Growth Hotspots
- 10.2 High-Growth Applications and Customer Groups
- 10.3 Underserved Markets and White-Space Opportunities
- 10.4 Emerging Technology and Product Opportunities
- 10.5 New Capacity and Investment Hotspots
- 10.6 Market Entry and Expansion Opportunities
- 10.7 Distribution and Partnership Opportunities
- 10.8 Near-Term and Long-Term Commercial Potential
- 10.9 Opportunity Attractiveness and Execution Risks
Chapter 11 Canada Physical Security Market Outlook, 2025-2035
- 11.1 Market Size and Analysis
- 11.1.1 Revenue (Market Measurement: 2025: USD 4.98 billion → 2035: USD 8.56 billion)
- 11.1.2 Market Volume and Quantity Sold
- 11.1.3 Historical Market Size, 2018-2025
- 11.1.4 Base-Year Market Size, 2025
- 11.2 Market Forecast, 2025-2035
- 11.2.1 Revenue Forecast to 2035
- 11.2.2 Volume Forecast to 2035
- 11.2.3 CAGR and Year-on-Year Growth
- 11.2.4 Incremental Revenue Opportunity
- 11.3 Forecast Assumptions and Scenario Analysis
- 11.3.1 Base-Case Forecast
- 11.3.2 Optimistic and Conservative Scenarios
- 11.3.3 Technology, Pricing and Policy Sensitivities
- 11.4 Market Attractiveness and Growth Outlook
Chapter 12 Canada Physical Security Market Segmentation and Outlook
- 12.1 Segmentation Summary and Market Shares, 2025
- 12.2 Largest and Fastest-Growing Segments
- 12.3 By Component - Market Size and Forecast, 2025-2035
- 12.3.1 Segment Definition and Scope
- 12.3.2 Historical Market Size, 2018-2025
- 12.3.3 Revenue Forecast, 2025-2035
- 12.3.4 Volume Forecast, 2025-2035
- 12.3.5 Base-Year Market Share, 2025
- 12.3.6 Segment CAGR and Growth Drivers
- 12.3.7 Subsegment Market Size and Forecast
- 12.3.7.1 Video Surveillance
- 12.3.7.2 Services
- 12.3.7.3 Access Control
- 12.3.7.4 Monitoring and Detection
- 12.3.7.5 Other Solutions
- 12.3.8 Subsegment Pricing and Adoption Trends
- 12.3.9 Leading Suppliers and Competition
- 12.3.10 Regional Demand and Opportunities
- 12.4 By End Use - Market Size and Forecast, 2025-2035
- 12.4.1 Segment Definition and Scope
- 12.4.2 Historical Market Size, 2018-2025
- 12.4.3 Revenue Forecast, 2025-2035
- 12.4.4 Volume Forecast, 2025-2035
- 12.4.5 Base-Year Market Share, 2025
- 12.4.6 Segment CAGR and Growth Drivers
- 12.4.7 Subsegment Market Size and Forecast
- 12.4.7.1 Government and Defense
- 12.4.7.2 Others
- 12.4.7.3 Retail and Commercial
- 12.4.7.4 BFSI
- 12.4.7.5 Healthcare and Life Sciences
- 12.4.7.6 IT and Telecom
- 12.4.8 Subsegment Pricing and Adoption Trends
- 12.4.9 Leading Suppliers and Competition
- 12.4.10 Regional Demand and Opportunities
- 12.5 By Organization Size - Market Size and Forecast, 2025-2035
- 12.5.1 Segment Definition and Scope
- 12.5.2 Historical Market Size, 2018-2025
- 12.5.3 Revenue Forecast, 2025-2035
- 12.5.4 Volume Forecast, 2025-2035
- 12.5.5 Base-Year Market Share, 2025
- 12.5.6 Segment CAGR and Growth Drivers
- 12.5.7 Subsegment Market Size and Forecast
- 12.5.7.1 Large Enterprises
- 12.5.7.2 Small and Medium Enterprises
- 12.5.8 Subsegment Pricing and Adoption Trends
- 12.5.9 Leading Suppliers and Competition
- 12.5.10 Regional Demand and Opportunities
- 12.6 Segment Growth Comparison
- 12.7 Segment Attractiveness and Priority Matrix
Chapter 13 Canada Physical Security End-Use and Application Market Outlook
- 13.1 End-Use Industry and Customer Demand Structure
- 13.2 Leading Applications and Customer Groups
- 13.3 End-Use Market Size, Share and Forecast
- 13.4 Major End-Use Industry Deep Dives
- 13.4.1 Customer Requirements and Use Cases
- 13.4.2 Demand and Replacement Cycles
- 13.4.3 Technical and Regulatory Considerations
- 13.4.4 Purchasing and Procurement Models
- 13.4.5 Leading Vendors and Distribution Channels
- 13.4.6 Forecast and Commercial Opportunities
- 13.5 Emerging Applications and Cross-Segment Demand
- 13.6 End-Use Industry Investment Priorities
Chapter 14 Canada Physical Security Geographic Market Outlook, 2025-2035
- 14.1 Domestic Market Distribution and Demand Clusters
- 14.2 State- or Province-Wise Market Size and Forecast, 2025-2035
- 14.3 City and Metropolitan Market Outlook
- 14.4 Industrial, Manufacturing and Commercial Clusters
- 14.5 Geographic Concentration of Key End Users
- 14.6 Local Pricing and Purchasing Differences
- 14.7 Domestic Production Facilities and Capacity Map
- 14.8 Local Infrastructure and Project Pipeline
- 14.9 State-Level Policy and Incentive Differences
- 14.10 Subnational Investment Hotspots and Opportunities
- 14.11 Distribution and Logistics Networks
- 14.12 Domestic Competitive Footprint
Chapter 15 Canada Physical Security Technology, Innovation and Sustainability Outlook
- 15.1 Technology Landscape and Maturity
- 15.2 Product, Process and Service Innovation
- 15.3 AI, Automation and Digital Tools in the Industry
- 15.4 Technology Adoption and Performance Benchmarking
- 15.5 Innovation Pipeline and R&D Investment
- 15.6 Patent and Intellectual Property Trends
- 15.7 Energy Efficiency and Resource Management
- 15.8 Sustainability, Recycling and Circularity
- 15.9 Technology Roadmap, 2025-2035
- 15.10 Risks of Obsolescence and Technology Substitution
Chapter 16 Canada Physical Security Market Key Strategic Imperatives
- 16.1 Growth and Market Entry Priorities
- 16.2 High-Return Products and Segments
- 16.3 Pricing, Profitability and Cost Optimization
- 16.4 Technology Investment and Product Differentiation
- 16.5 Supply Chain Localization and Resilience
- 16.6 Distribution and Customer Acquisition
- 16.7 Partnership, Acquisition and Capacity Strategy
- 16.8 Regional Expansion Priorities
- 16.9 Short-, Medium- and Long-Term Actions
Chapter 17 Competition Outlook
- 17.1 Industry Competition Characteristics
- 17.2 Market Structure and Concentration
- 17.3 Market Share and Competitive Positioning, 2025
- 17.4 Company-Wise Revenue and Product Benchmarking
- 17.5 Production and Service Capacity Benchmarking
- 17.6 Technology, Pricing and Differentiation
- 17.7 Regional Footprint and Distribution Strength
- 17.8 Mergers, Acquisitions and Strategic Alliances
- 17.9 New Entrants and Competitive Threats
- 17.10 Porter's Five Forces and Industry Attractiveness
- 17.11 Competitive Outlook, 2025-2035
Chapter 18 Company Profiles
- 18.1 Company Coverage and Selection Criteria
- 18.2 Johnson Controls International
- 18.2.1 Business Description
- 18.2.2 Company Ownership and Geographic Presence
- 18.2.3 Product and Service Portfolio
- 18.2.4 Manufacturing and Operating Footprint
- 18.2.5 Production Capacity and Expansion Plans
- 18.2.6 Financial Performance and Investment
- 18.2.7 Market Share and Competitive Position
- 18.2.8 Technology and Innovation Capabilities
- 18.2.9 Strategic Alliances or Partnerships
- 18.2.10 Recent Developments
- 18.2.11 Growth Strategy and Outlook
- 18.3 Honeywell International Inc.
- 18.4 Motorola Solutions (Avigilon)
- 18.5 Genetec
- 18.6 Axis Communications (Canon)
- 18.7 Robert Bosch GmbH (Paladin Technologies)
- 18.8 Keenfinity Group
- 18.9 Securitas Technology (Securitas AB)
- 18.10 Convergint
- 18.11 TELUS (SmartHome Security)
- 18.12 Siemens AG (Smart Infrastructure)
- 18.13 Schneider Electric
- 18.14 Other Relevant Market Participants
Note: Every listed company is profiled on the structure shown under the first company. The company list is preliminary and may change based on research findings, market developments, data availability and client requirements.
Chapter 19 Disclaimer
- 19.1 Research and Forecast Disclaimer
- 19.2 Data Source and Estimation Limitations
Note: The depth of individual sections depends on data availability for this market. Volume, capacity, trade and other unit-based metrics are included where applicable.

