
Market Overview
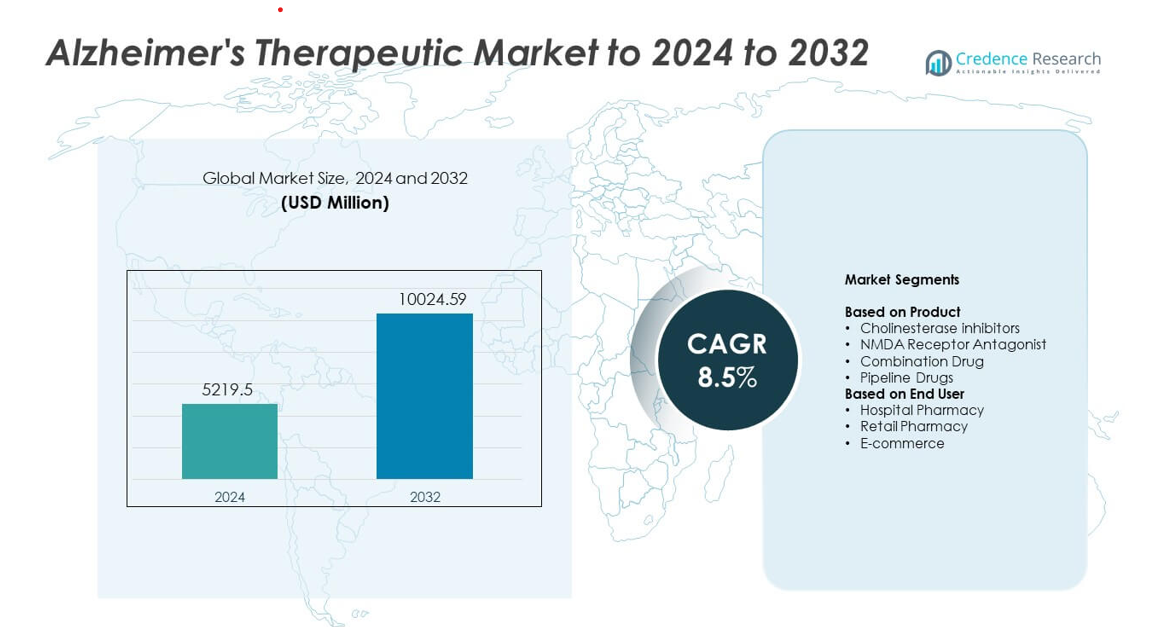
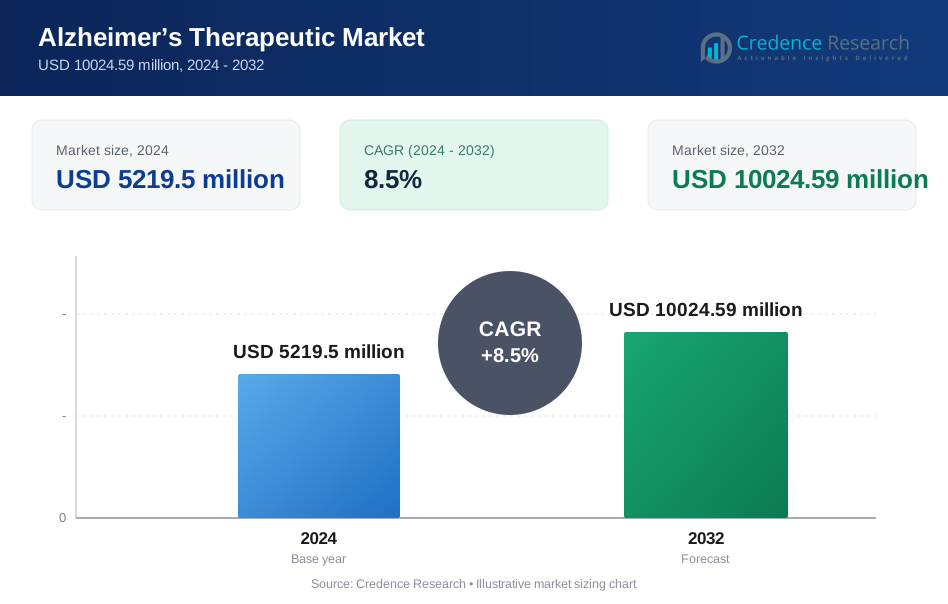
Alzheimer’s Therapeutic Market size was valued at USD 5219.5 million in 2024 and is anticipated to reach USD 10024.59 million by 2032, at a CAGR of 8.5% during the forecast period.
| REPORT ATTRIBUTE | DETAILS |
|---|---|
| Historical Period | 2020-2023 |
| Base Year | 2024 |
| Forecast Period | 2025-2032 |
| Alzheimer's Therapeutic Market Size 2024 | USD 5219.5 million |
| Alzheimer's Therapeutic Market, CAGR | 8.5% |
| Alzheimer's Therapeutic Market Size 2032 | USD 10024.59 million |
The Alzheimer’s Therapeutic Market is shaped by top players that include Johnson & Johnson Services, Inc., Novartis AG, AC Immune, TauRx Pharmaceuticals Ltd., F. Hoffmann La Roche Ltd., AbbVie Inc., Daiichi Sankyo Company, Limited, Biogen, Eisai Co., Ltd., H. Lundbeck A/S, and Adamas Pharmaceuticals, Inc. These companies advance the market through strong pipelines, biomarker-driven therapies, and wider adoption of disease-modifying drugs. North America led the market in 2024 with a 41% share due to early diagnosis rates, broad reimbursement coverage, and rapid uptake of advanced treatments. Europe followed with stable growth supported by robust healthcare systems and expanding therapeutic access.
Market Insights
- The Alzheimer’s Therapeutic Market reached USD 5219.5 million in 2024 and will rise to USD 10024.59 million by 2032 at a CAGR of 8.5%.
- Rising disease prevalence and growing adoption of disease-modifying therapies drive strong demand, supported by higher diagnosis rates and wider clinical acceptance of advanced treatment options.
- Key trends include expansion of biomarker-based treatment, growth of digital monitoring tools, and increasing focus on multi-pathway therapy approaches to improve long-term outcomes.
- Competitive activity intensifies as major companies strengthen pipelines, advance monoclonal antibody programs, and expand global access through regulatory approvals and strategic partnerships.
- North America led the market with 41% share in 2024, followed by Europe at 29%, while Asia Pacific showed fastest growth with 21%; cholinesterase inhibitors held the top segment share at about 46%.
Market Segmentation Analysis:
By Product
Cholinesterase inhibitors held the dominant share in 2024 with about 46% of the Alzheimer’s Therapeutic Market. Strong demand came from their established role in managing cognitive decline across mild to moderate stages. Wider clinical adoption and broad insurance support helped this group maintain leadership. NMDA receptor antagonists saw steady uptake due to benefits in moderate to severe symptoms. Combination drugs gained traction as physicians sought multi-pathway approaches. Pipeline drugs continued to expand as new monoclonal antibodies and disease-modifying candidates advanced through late-stage trials.
- For instance, Eisai confirmed in the CLARITY-AD Phase III trial (Nov 2022) that lecanemab reduced amyloid plaque levels by a mean of 55.48 centiloids over 18 months, based on PET-scan quantification involving 1,795 participants.
By End User
Hospital pharmacy dominated the market in 2024 with nearly 48% share. Hospitals led due to higher diagnosis rates, specialist access, and rapid initiation of therapy for moderate to severe cases. Strong prescribing control and structured treatment plans supported higher utilization. Retail pharmacies showed stable growth as mild cases and chronic prescriptions increased in community settings. E-commerce expanded at a faster pace due to rising demand for home delivery, digital prescription renewals, and improved patient adherence tools.
- For instance, in its 2023 Annual Report, CVS Health reported that its PBM segment, CVS Caremark, processed approximately 2.3 billion pharmacy claims on a 30-day equivalent basis in 2023
Key Growth Drivers
Rising prevalence of Alzheimer’s disease
Global Alzheimer’s cases continue to rise due to growing aging populations and longer life expectancy. Higher diagnosis rates push demand for early medical intervention and long-term therapy. Healthcare systems expand screening programs, which boosts treatment volumes across hospitals and clinics. Drug makers respond with wider product availability and improved formulations that support better symptom control. This rising patient pool remains the most influential driver for market expansion.
- For instance, the World Health Organization stated in 2023 that global Alzheimer’s cases reached approximately 55 million, with projections increasing by nearly 10 million new dementia cases every year.
Advances in disease-modifying therapies
New research in monoclonal antibodies and amyloid-targeting drugs strengthens the pipeline for disease-modifying treatment. Recent approvals and late-stage trials build strong confidence in next-generation therapies. These drugs offer deeper clinical value by slowing progression rather than only treating symptoms. Strong investment from global pharma companies accelerates innovation and regulatory momentum. This progress creates a major growth driver for long-term market expansion.
- For instance, Biogen's EMERGE Phase III trial (Study 302) analysis reported that aducanumab lowered amyloid plaque levels by approximately 60.8 centiloids in the high-dose groups over an 18-month treatment period, validated through PET imaging.
Growing healthcare spending and supportive policies
Governments and insurers increase funding for neurodegenerative care due to growing social and economic burden. Supportive reimbursement programs help improve access to premium therapies. Hospitals adopt structured care pathways to enhance treatment outcomes, which lifts prescription demand. Public health agencies promote awareness and early detection campaigns. These combined actions make this driver one of the strongest forces shaping market growth.
Key Trends & Opportunities
Shift toward precision and biomarker-based treatment
Therapy development moves toward targeted mechanisms that rely on biomarkers and digital diagnostics. Rising use of PET scans and blood-based tests improves patient selection for advanced therapies. Precision approaches increase treatment success rates and create new opportunities for personalized care models. Pharma companies invest in advanced trial designs to better match drug profiles with patient biology. This trend reshapes future therapeutic strategies.
- For instance, C2N Diagnostics reported in 2021 that its original PrecivityAD blood test had a limit of detection (LoD) for plasma Aβ42 at 2 pg/mL and was linear up to 254 pg/mL, while the required Total Allowable Error (TAE) for Aβ42 measurement was defined as 4 pg/mL (or 20%, whichever was greater).
Expansion of combination and multi-pathway therapy approaches
Researchers explore combinations that target several pathways such as amyloid, tau, and inflammation. These approaches aim to provide stronger clinical impact by addressing multiple disease mechanisms. Combination regimens attract interest from clinicians treating moderate to severe stages. Partnerships between biotech firms grow as companies co-develop novel dual-action therapies. This trend creates new opportunities for broad portfolio expansion.
- For instance, in the pivotal TRAILBLAZER-ALZ 2 Phase III study, Eli Lilly reported in 2023 that donanemab treatment slowed clinical decline by 35% in the primary analysis population (participants with low/medium tau) on the Integrated Alzheimer's Disease Rating Scale (iADRS) compared to placebo over 76 weeks.
Growing adoption of digital tools for disease management
Digital health platforms help track symptoms, support medication adherence, and assist caregivers. Remote monitoring tools allow clinicians to adjust therapy plans with greater accuracy. AI-based algorithms improve early detection and long-term management. These tools create opportunities for integrated treatment ecosystems that pair medication with real-time support. Adoption grows rapidly across home care and hospital settings.
Key Challenges
High treatment costs and limited global accessibility
The growing use of advanced biologics increases overall therapy expenses. Many regions still face limited reimbursement coverage for high-value treatments. Pricing barriers reduce adoption in low-income and middle-income countries. Patients often face delays in therapy initiation due to affordability gaps. This challenge remains a major barrier to equitable and widespread treatment access.
Complexity of disease biology and slow drug development success
Alzheimer’s remains difficult to treat due to its multifactorial nature and slow progression. Many clinical trials fail to show meaningful outcomes, which delays new product launches. High research costs and strict regulatory scrutiny add further strain on development timelines. Drug makers face difficulty predicting patient response due to varied disease patterns. This scientific complexity remains a major challenge for market advancement.
Regional Analysis
North America
North America held the largest share in 2024 with about 41% of the Alzheimer’s Therapeutic Market. Strong access to advanced treatments and early adoption of disease-modifying drugs supported its leadership. High diagnosis rates, widespread biomarker testing, and extensive reimbursement coverage helped expand therapy uptake. Major pharmaceutical companies advanced clinical trials, which further strengthened regional growth. Rising awareness programs, caregiver support systems, and structured hospital networks improved long-term treatment continuity. These factors kept North America the primary center for both innovation and commercial demand.
Europe
Europe accounted for nearly 29% share in 2024. Strong public healthcare frameworks and broad access to cognitive assessment tools supported high treatment penetration. Countries with aging populations showed faster growth as early screening improved case identification. Regulatory backing for innovative therapies increased interest in newly approved drugs. Hospital systems maintained structured care pathways that encouraged long-term medicine adherence. Pharmaceutical partnerships in key markets such as Germany, France, and the U.K. strengthened the region’s research and commercial expansion.
Asia Pacific
Asia Pacific held about 21% share in 2024 and showed the fastest growth potential. Rising geriatric populations across China, Japan, and South Korea increased diagnosis volumes. Governments expanded memory clinics and public programs to improve early detection. Growing medical insurance coverage helped broaden access to commonly prescribed therapies. Regional research institutions advanced biomarker and neuroimaging studies, which supported adoption of advanced treatments. Improving healthcare infrastructure and a strong focus on training specialists further boosted market development.
Latin America
Latin America captured close to 6% share in 2024. Treatment uptake increased as awareness campaigns improved understanding of neurodegenerative disorders. Expanding private healthcare access supported demand for both standard and advanced medications. Urban centers showed faster growth due to better diagnostic services and neurologist availability. Limited reimbursement coverage remained a constraint but gradual expansion of insurance programs improved support. Partnerships between public agencies and regional distributors helped widen product availability across major countries.
Middle East and Africa
Middle East and Africa held nearly 3% share in 2024. Rising life expectancy and higher reporting of cognitive disorders increased the need for specialized care. Gulf countries invested in memory centers and advanced diagnostic tools, which improved early detection. Access to innovative therapies remained limited in several regions, but improving procurement systems enhanced availability in key markets. Public health authorities promoted awareness programs focused on early intervention. These steps helped the region steadily expand its Alzheimer’s therapeutic landscape.
Market Segmentations:
By Product
- Cholinesterase inhibitors
- NMDA Receptor Antagonist
- Combination Drug
- Pipeline Drugs
By End User
- Hospital Pharmacy
- Retail Pharmacy
- E-commerce
By Geography
- North America
- U.S.
- Canada
- Mexico
- Europe
- Germany
- France
- U.K.
- Italy
- Spain
- Rest of Europe
- Asia Pacific
- China
- Japan
- India
- South Korea
- South-east Asia
- Rest of Asia Pacific
- Latin America
- Brazil
- Argentina
- Rest of Latin America
- Middle East & Africa
- GCC Countries
- South Africa
- Rest of the Middle East and Africa
Competitive Landscape
The Alzheimer’s Therapeutic Market includes major players such as Johnson & Johnson Services, Inc., Novartis AG, AC Immune, TauRx Pharmaceuticals Ltd., F. Hoffmann La Roche Ltd., AbbVie Inc., Daiichi Sankyo Company, Limited, Biogen, Eisai Co., Ltd., H. Lundbeck A/S, and Adamas Pharmaceuticals, Inc. Leading companies focus on expanding portfolios through disease-modifying therapies, monoclonal antibodies, and next-generation pipeline assets. Most firms invest heavily in late-stage clinical trials to improve efficacy and slow disease progression. Strategic partnerships strengthen biomarker research, digital diagnostics, and precision-based treatment models. Firms also enhance global market presence through regulatory approvals, reimbursement expansion, and collaborations with research institutes. Continuous innovation in amyloid-targeting and tau-focused approaches guides competition, while growing emphasis on early detection supports long-term commercial growth.
Key Player Analysis
- Johnson & Johnson Services, Inc. (U.S.)
- Novartis AG (Switzerland)
- AC Immune (Switzerland)
- TauRx Pharmaceuticals Ltd. (U.K.)
- Hoffmann La Roche Ltd. (Switzerland)
- AbbVie Inc. (Allergan Plc.) (U.S.)
- Daiichi Sankyo Company, Limited (Japan)
- Biogen (U.S.)
- Eisai Co., Ltd. (Japan)
- Lundbeck A/S (Denmark)
- Adamas Pharmaceuticals, Inc. (U.S.)
Recent Developments
- In 2024, Otsuka and Lundbeck presented new post-hoc Phase 3 and extension-trial analyses at AAIC 2024 showing REXULTI (brexpiprazole) maintains improvements in agitation linked to Alzheimer’s dementia and supports caregiver burden reduction over 24 weeks.
- In 2024, AbbVie announced a deal to acquire Aliada Therapeutics, adding ALIA-1758, a blood-brain-barrier-shuttled antibody candidate that includes Alzheimer’s as a target indication, strengthening its early neurodegeneration pipeline.
- In 2024, Eisai announced further launches and label progress for Leqembi, including broader global roll-out, before securing EU approval with Biogen in April 2025 for early symptomatic Alzheimer’s
Report Coverage
The research report offers an in-depth analysis based on Product, End-User and Geography. It details leading market players, providing an overview of their business, product offerings, investments, revenue streams, and key applications. Additionally, the report includes insights into the competitive environment, SWOT analysis, current market trends, as well as the primary drivers and constraints. Furthermore, it discusses various factors that have driven market expansion in recent years. The report also explores market dynamics, regulatory scenarios, and technological advancements that are shaping the industry. It assesses the impact of external factors and global economic changes on market growth. Lastly, it provides strategic recommendations for new entrants and established companies to navigate the complexities of the market.
Future Outlook
- Demand for advanced Alzheimer’s therapies will rise as global aging accelerates.
- Disease-modifying treatments will gain wider adoption with stronger clinical evidence.
- Biomarker-based diagnosis will expand and support more accurate patient selection.
- Combination therapies will grow as multi-pathway approaches show improved outcomes.
- Digital health tools will enhance monitoring, adherence, and personalized treatment.
- Pharma investment in neurodegeneration research will continue to increase.
- Reimbursement frameworks will strengthen to improve access to high-value therapies.
- Emerging markets will adopt modern treatments as healthcare infrastructure improves.
- Real-world data studies will shape future guidelines and treatment pathways.
- Collaborations between biotech firms and academic centers will accelerate drug discovery.
Request a Free Sample
Fill in your details and we'll send you a free sample report.
- Sample data tables & charts
- Research methodology
Need a Custom Version of This Report?
Tailor the scope, geography, or segments to your exact requirements.
- Custom geography or segment scope
- Direct access to our analyst team
Frequently Asked Questions
What is the current market size for the Alzheimer’s Therapeutic market, and what is its projected size in 2032?
At what Compound Annual Growth Rate is the Alzheimer’s Therapeutic market projected to grow between 2025 and 2032?
Which is the leading market for Alzheimer’s Therapeutic?
What are the key drivers for the growth of the Alzheimer’s Therapeutic market?
Who are the leading companies in the Alzheimer’s Therapeutic market?
Table of Content
Chapter 1. Report Introduction
- 1.1 Report Description & Purpose
- 1.1.1 Report Title & Market Definition
- 1.1.2 Unique Selling Propositions (USP) & Key Differentiators
- 1.1.3 Value Proposition for Stakeholders
- 1.2 Research Objectives
- 1.2.1 Market Sizing Objectives (Volume & Revenue)
- 1.2.2 Segmentation Objectives
- 1.2.3 Competitive Intelligence Objectives
- 1.2.4 Forecast & Scenario Objectives
- 1.3 Report Scope
- 1.3.1 Alzheimer’s Therapeutic Scope – Types & Subtypes Covered
- 1.3.2 Geographic Scope – Regions & Countries Covered
- 1.3.3 Historical Period, Base Year & Forecast Period (2024; forecast to 2032)
- 1.3.4 Inclusions & Exclusions
- 1.4 HS Code & Classification Framework
- 1.5 Currency, Units & Pricing Basis
- 1.6 Target Stakeholders
- 1.7 Limitations & Assumptions
Chapter 2. Executive Summary
- 2.1 Global Alzheimer’s Therapeutic Market Snapshot
- 2.1.1 Market Size – Historical (2024) & Forecast (2024-2032) (2024: USD 5219.5 million → 2032: USD 10024.59 million)
- 2.1.2 Volume & Revenue – Global Totals
- 2.1.3 Key Market Highlights – Top Five Facts
- 2.2 Alzheimer’s Therapeutic Market Segmentation Snapshot
- 2.2.1 Market Split by Region – 2024 vs. 2032
- 2.3 Competitive Snapshot
- 2.3.1 Top 10 Players by Revenue Share – 2024
- 2.3.2 Top 10 Players by Volume Share – 2024
- 2.3.3 Recent Strategic Developments (18-Month Summary)
- 2.4 Key Investment Highlights & Strategic Conclusions
Chapter 3. Alzheimer’s Therapeutic Market Dynamics & Industry Analysis
- 3.1 Market Overview & Context
- 3.1.1 Alzheimer’s Therapeutic Market Position in the Broader Automotive Value Chain
- 3.1.2 OEM vs. Replacement Market Dynamics
- 3.1.3 Market Maturity & Development Stage by Region
- 3.2 Alzheimer’s Therapeutic Market Drivers
- 3.3 Alzheimer’s Therapeutic Market Restraints & Challenges
- 3.4 Alzheimer’s Therapeutic Market Opportunities
- 3.5 Porter's Five Forces Analysis
- 3.5.1 Threat of New Entrants
- 3.5.2 Bargaining Power of Suppliers
- 3.5.3 Bargaining Power of Buyers
- 3.5.4 Threat of Substitutes
- 3.5.5 Competitive Rivalry – Intensity Assessment
- 3.6 Alzheimer’s Therapeutic Value Chain Analysis
- 3.6.1 Upstream – Raw Material/Input Suppliers
- 3.6.1.1 Raw Material/Input 1
- 3.6.1.2 Raw Material/Input 2
- 3.6.1.3 Raw Material/Input 3
- 3.6.2 Midstream – Production/Manufacturing/Service Delivery
- 3.6.2.1 Production/Process Overview
- 3.6.2.2 Key Facility Locations & Capacity by Manufacturer
- 3.6.3 Downstream – Distribution & End Consumer
- 3.6.3.1 Primary Channel – B2B/OEM
- 3.6.3.2 Secondary Channels – Dealer, Retail, Online, Direct
- 3.6.4 Value Chain Profitability Analysis
- 3.6.1 Upstream – Raw Material/Input Suppliers
- 3.7 PESTEL Analysis
- 3.7.1 Political Factors
- 3.7.2 Economic Factors
- 3.7.3 Social Factors
- 3.7.4 Technological Factors
- 3.7.5 Environmental Factors
- 3.7.6 Legal Factors
- 3.8 Alzheimer’s Therapeutic Supply Chain Analysis
- 3.8.1 Raw Material/Input Supply Risk Assessment
- 3.8.2 Manufacturing Concentration Risk (Geographic Exposure)
- 3.8.3 Trade Disruption Impact Analysis
- 3.9 Regulatory & Policy Landscape
Note: The regulatory and policy landscape section covers regulations based on their applicability to the market, Alzheimer’s Therapeutic category, geography, and scope of the study. Only regulatory frameworks with a material impact on operations, compliance, trade, sustainability, or market access are analyzed in detail.
Chapter 4. Key Investment Pockets & Opportunity Analysis
- 4.1 Alzheimer’s Therapeutic Market Attractiveness Analysis
- 4.1.1 By Region – Investment Attractiveness Matrix (Volume × CAGR)
- 4.2 Absolute Revenue Growth Opportunity
- 4.2.1 By Region – Absolute USD Growth Through 2032
- 4.3 Incremental Volume Opportunity
- 4.3.1 By Region – Incremental Volume Through 2032
- 4.3.2 Segment – Incremental Volume
- 4.4 Emerging Submarket Opportunity Deep Dive (Subject to Applicability)
- 4.5 Emerging Market Opportunity Scorecards
- 4.5.1 United States
- 4.5.2 Europe
- 4.5.3 Asia
- 4.5.4 Middle East & Africa
Note: Emerging Market Opportunity Scorecards will be included based on relevance and strategic importance. Regions listed are indicative and may vary depending on data availability and market dynamics.
Chapter 5. Alzheimer’s Therapeutic Import-Export Analysis & Trade Flows
- 5.1 Global Trade Overview
- 5.1.1 Global Export Value by Country (2024)
- 5.1.2 Global Export Volume by Country (2024)
- 5.1.3 Global Import Value by Country (2024)
- 5.1.4 Global Import Volume by Country (2024)
- 5.1.5 Net Trade Balance by Country (2024)
- 5.2 Export Analysis – Segment
- 5.2.1 Type 1 (HS Code)
- 5.2.2 Type 2 (HS Code)
- 5.2.3 Type 3 (HS Code)
- 5.2.4 Type 4 (HS Code)
- 5.2.5 Type 5 (HS Code)
- 5.3 Import Analysis – Segment
- 5.3.1 Type 1 (HS Code)
- 5.3.2 Type 2 (HS Code)
- 5.3.3 Type 3 (HS Code)
- 5.3.4 Type 4 (HS Code)
- 5.3.5 Type 5 (HS Code)
- 5.4 Average Unit Trade Prices
- 5.4.1 Average Export Price – Segment & Country
- 5.4.2 Average Import Price – Segment & Source Country
- 5.4.3 Price Trends (2024)
- 5.5 Key Trade Route Analysis
- 5.5.1 Trade Route 1
- 5.5.2 Trade Route 2
- 5.5.3 Trade Route 3
- 5.5.4 Trade Route 4
- 5.5.5 Trade Route 5
- 5.6 Trade Policy Impact Assessment
- 5.6.1 US Anti-Dumping & Section 301 Tariffs
- 5.6.2 EU Customs Union Impact
- 5.6.3 Major Free Trade Agreements
- 5.6.4 USMCA Rules of Origin
Note: Trade policy analysis will be included only where relevant to the Alzheimer’s Therapeutic market.
Chapter 6. Competitive Landscape & Company Benchmarking
- 6.1 Alzheimer’s Therapeutic Market Concentration & Structure
- 6.1.1 Herfindahl-Hirschman Index (HHI) – vs. 2024
- 6.1.2 Tier 1, Tier 2 & Tier 3 Market Structure
- 6.1.3 Global, Regional & Local Player Dynamics
- 6.2 Alzheimer’s Therapeutic Market Share Analysis – 2024
- 6.2.1 Global Revenue Share by Company
- 6.2.2 Global Volume Share by Company
- 6.2.3 Regional Revenue Share
- 6.2.4 Market Share Evolution ( vs. 2024)
- 6.2.5 OEM Segment Share by Company
- 6.2.6 Replacement Segment Share by Company
- 6.3 Production/Delivery Capacity & Facility Analysis
- 6.3.1 Global Installed Capacity
- 6.3.2 Capacity Utilization Rates
- 6.3.3 Production/Output Volume
- 6.3.4 Facility Locations & Capacity Map
- 6.3.5 Planned Capacity Additions
- 6.4 Alzheimer’s Therapeutic Competitive Benchmarking Matrix
- 6.4.1 Revenue, Volume, CAGR & Profitability Comparison
- 6.4.2 Channel Revenue Mix
- 6.4.3 Geographic Revenue Exposure
- 6.4.4 R&D Intensity
- 6.4.5 Sustainability Maturity
- 6.5 Strategic Developments in Alzheimer’s Therapeutic (Last 24 Months)
- 6.5.1 Mergers, Acquisitions & Divestments
- 6.5.2 New Alzheimer’s Therapeutic Launches
- 6.5.3 Facility Expansions
- 6.5.4 Strategic Alliances, Joint Ventures & Partnerships
- 6.5.5 Distribution Expansion & Market Entry
- 6.5.6 Sustainability & ESG Initiatives
- 6.6 Competitive Strategy Mapping
- 6.6.1 Leader, Challenger, Follower & Niche Classification
- 6.6.2 Pricing Strategy Comparison
- 6.6.3 Channel Strategy Matrix
Note: Strategic developments are included based on their materiality and the availability of reliable information.
Chapter 7. Global Alzheimer’s Therapeutic Market – By Distribution Channel
- 7.1 Segment Overview
- 7.1.1 Volume & Revenue Split by Channel (2024 & 2032)
- 7.1.2 Channel Mix Evolution (2024-2032)
Chapter 8. Regional Market Analysis – Global Overview
- 8.1 Global Regional Overview
- 8.1.1 Regional Volume Share
- 8.1.2 Regional Revenue Share
- 8.1.3 Regional Volume by Region
- 8.1.4 Regional Revenue by Region
- 8.1.5 Regional Forecast Through 2032
- 8.2 Cross-Regional Segment Analysis
- 8.2.1 By Distribution Channel
- 8.2.2 By Brand/Price Tier
Chapter 9. North America Alzheimer’s Therapeutic Market
- 9.1 United States
- 9.2 Canada
- 9.3 Mexico
Chapter 10. Europe Alzheimer’s Therapeutic Market
- 10.1 Germany
- 10.2 France
- 10.3 Italy
- 10.4 United Kingdom
- 10.5 Spain
- 10.6 Poland
- 10.7 Russia
- 10.8 Netherlands
- 10.9 Belgium
- 10.10 Sweden
- 10.11 Denmark
- 10.12 Norway
- 10.13 Rest of Europe
Chapter 11. Asia Pacific Alzheimer’s Therapeutic Market
- 11.1 China
- 11.2 India
- 11.3 Japan
- 11.4 South Korea
- 11.5 Thailand
- 11.6 Indonesia
- 11.7 Vietnam
- 11.8 Malaysia
- 11.9 Australia
- 11.10 Rest of Asia Pacific
Chapter 12. Latin America Alzheimer’s Therapeutic Market
- 12.1 Brazil
- 12.2 Argentina
- 12.3 Colombia
- 12.4 Chile
- 12.5 Rest of Latin America
Chapter 13. Middle East Alzheimer’s Therapeutic Market
- 13.1 Saudi Arabia
- 13.2 United Arab Emirates
- 13.3 Turkey
- 13.4 Israel
- 13.5 Iran
- 13.6 Rest of the Middle East
Chapter 14. Africa Alzheimer’s Therapeutic Market
- 14.1 South Africa
- 14.2 Egypt
- 14.3 Nigeria
- 14.4 Morocco
- 14.5 Rest of Africa
Chapter 15. Alzheimer’s Therapeutic Company Profiles
- 15.1 [Company 01]
- 15.1.1 Company Overview
- 15.1.2 Key Management Personnel
- 15.1.3 Products & Services Portfolio
- 15.1.4 Financial Performance
- 15.1.5 Key Market Focus & Geographic Presence
- 15.1.6 Recent Developments & Strategic Initiatives
Note: The company profile list is preliminary and may change based on research findings, market developments, data availability, and client requirements.
Chapter 16. Appendices
- Appendix A – List of Abbreviations & Acronyms
- Appendix B – Industry Classification Code Reference – Full Series
- Appendix C – Production & Capacity Data Tables
- Appendix D – End-Use & Demand Base Tables
- Appendix E – Consumption & Replacement Rate Assumptions
- Appendix F – ASP Reference Tables
- Appendix G – Manufacturing & Facility Database
- Appendix H – Import-Export Data Tables
- Appendix I – Regulatory Summary Tables
- Appendix J – Primary Research Participant List (Anonymized)
- Appendix K – Primary Research Questionnaire Framework
- Appendix L – Data Sources & Bibliography
- Appendix M – Market Size Divergence & Source Comparison
Chapter 17. Research Methodology
- 17.1 Research Framework & Philosophy
- 17.2 Secondary Research – Sources, Hierarchy & Data Extraction
- 17.3 Data Modeling – Bottom-Up & Top-Down Market Sizing
- 17.4 Primary Research – Stakeholder Framework, LOI & Sample Sizes
- 17.5 Forecast Methodology – Regression, Scenario & Sensitivity Analysis
- 17.6 Quality Control – Four-Layer Validation Framework
- 17.7 Limitations & Standard Assumptions
- 17.8 Disclaimer
