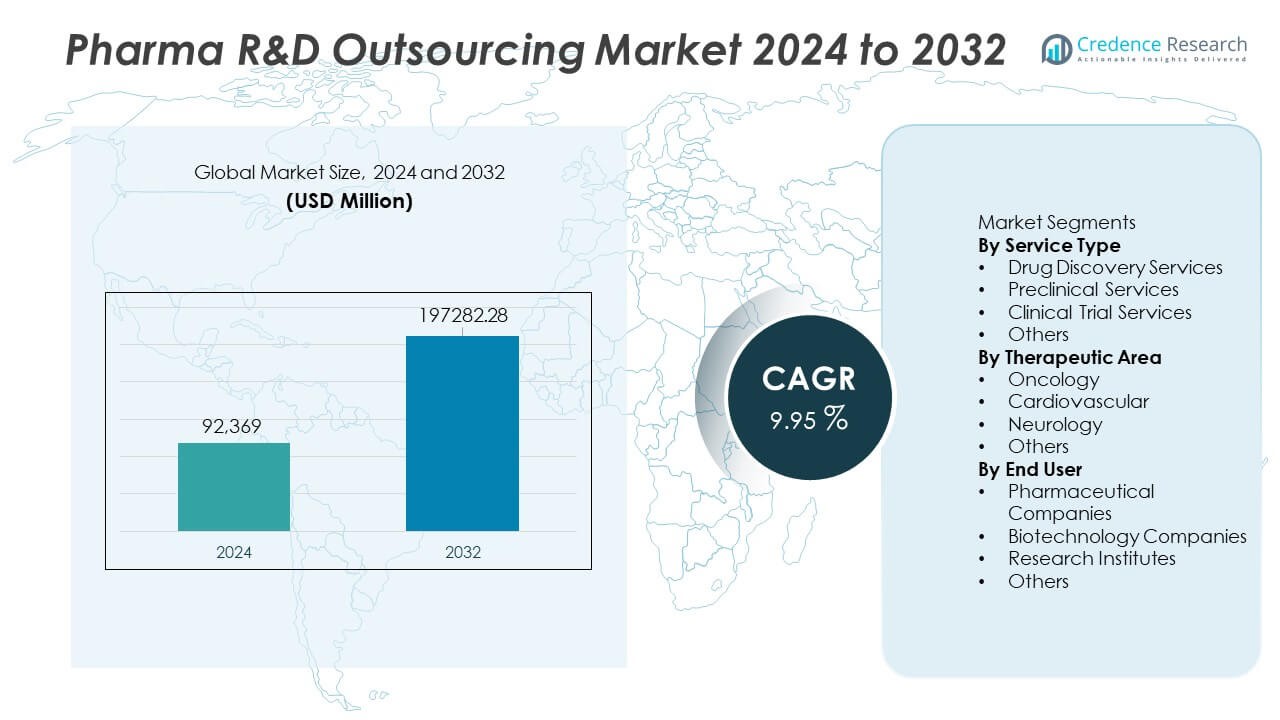
Home » Healthcare » Pharmaceuticals » Pharma R&D Outsourcing Market

Pharma R&D Outsourcing Market By Product Type (Small Molecules, Biologics) By Stage of Development (Clinical, Non-Clinical) By Company Size (Small & Mid-Sized Companies, Large Companies)-Growth, Future Prospects & Competitive Analysis, 2016 – 2030

Price: $4999

Published: | Report ID: 18993 | Report Format : PDF

Key Highlights of the Report

The global demand for the Pharma R&D Outsourcing Market was valued at USD 70,289.04 Million in 2022 is expected to reach USD 163,002.5 Million in 2030 growing at a CAGR of 10.46% between 2023 and 2030.

The global pharma R&D outsourcing market is divided into four sections: product type, development stage, firm size, therapy area, and region. Small molecules pharma R&D outsourcing is the most prevalent, with clinical and non-clinical development being the two key stages of development. The large companies category is dominating market demand, cardiovascular diseases are significant, driving growth in the pharmaceutical R&D outsourcing industry, with North America leading market growth.

The global pharma R&D outsourcing industry is driven by various factors, including increased usage of cloud computing and related software platforms in research and development, as well as Al’s appearance in drug discovery and development. Other restrictions include worries about intellectual property, as well as the high cost and low success rate of pharmaceutical research and development. However, the industry faces significant challenges related to intellectual property protection, quality control, and regulatory compliance.

Nonetheless, the worldwide pharmaceutical R&D outsourcing market offers considerable potential opportunities, including increased venture capitalist investments in the Life Sciences/Blotch Industry, as well as access to specialist knowledge. Furthermore, artificial intelligence and machine learning are two examples of technical advances that are expected to gain traction in the market.

Pharma R&D Outsourcing Market

Design Element 2

Access crucial information at unmatched prices!

Request your free sample report today & start making informed decisions powered by Credence Research!

Download Free Sample
CTA Design Element 3

What Are the Primary Forces Driving the Global Pharma R&D Outsourcing Market?

Several factors are driving the worldwide pharma R&D outsourcing industry, including increased usage of cloud computing and related software platforms in research and development, as well as Al’s appearance in drug discovery and development.

What Are the Global Pharma R&D Outsourcing Market’s Major Challenges?

A variety of problems, such as quality control, regulatory compliance, and intellectual property protection also hampers the global pharmaceutical R&D outsourcing market.

What Are the Opportunities for Growth in the Global Pharma R&D Outsourcing Market?

Venture capitalist investments in the Life Sciences/Blotch Industry are expanding, as is access to specialist knowledge in the worldwide pharmaceutical R&D outsourcing sector.

Executive Summary

Overview of the Global Pharma R&D Outsourcing Market

The pharmaceutical R&D outsourcing market refers to the practice of pharmaceutical corporations outsourcing R&D activities to third-party service providers. This might involve a wide spectrum of drug discovery, preclinical and clinical development, regulatory affairs, and manufacturing activities. Factors driving the market include:

  • Rising R&D expenses.
  • A growing demand for specialized expertise.
  • An increase in the number of small and mid-sized pharmaceutical enterprises.

However, worries about data privacy and security, a lack of control over outsourced tasks, and quality and regulatory compliance challenges are projected to limit market expansion.

Market Definition

The market for pharmaceutical R&D outsourcing describes the practice of pharmaceutical corporations contracting out their R&D work to outside service organizations. The activities involved in drug research, preclinical and clinical development, regulatory affairs, and manufacturing might range widely. In addition to other specialist service providers, the market includes a wide range of contract development and manufacturing organizations (CDMOs), contract research organizations (CROs), and other service providers.

Pharma R&D Outsourcing Market

Market Insights

  • Global demand for pharmaceutical R&D outsourcing was worth USD 70,289.04 Million in 2022 and is predicted to reach USD 163,002.5 Million in 2030, expanding at a CAGR of 9.56% between 2023 and 2030.
  • The small molecules sector accounted for a sizable share of the pharma R&D outsourcing industry, while the biologics segment will likely exhibit the fastest CAGR during the forecast period
  • The clinical category had a significant proportion of roughly 64.13%, while the non-clinical segment is one of the fastest expanding segments in the pharmaceutical R&D outsourcing market
  • In 2022, the small and mid-sized companies segment held a significant proportion of roughly 57.54%, while The Large companies segment is leading the market demand.
  • The oncology section held a significant proportion of roughly 30.71%.
  • North America is the most important market for pharmaceutical R&D outsourcing, accounting for a sizable portion of the global market, while the Asia-Pacific region is expected to have the greatest CAGR in the pharmaceutical R&D outsourcing market.
  • Increased use of cloud computing and related software platforms in research and development, as well as Al’s appearance in drug discovery and development, are the major drivers of the market.
  • At the same time, Concerns over intellectual property, as well as the high cost and low success rate of pharmaceutical research and development, are the main restraints.
  • Venture capitalist investments in the Life Sciences/Blotch Industry are increasing, as is access to specialized knowledge are the major opportunities in the market.

Segmentation by Product Type

  • The small molecules sector accounted for a sizable share of the pharma R&D outsourcing industry.
  • The biologics segment will likely exhibit the fastest CAGR during the forecast period.

Segmentation by Stage of Development

  • In 2022, the clinical category had a significant proportion of roughly 64.13%.
  • The non-clinical segment is one of the fastest-expanding segments in the pharmaceutical R&D outsourcing market.

Segmentation by Company Size

  • In 2022, the small and mid-sized companies segment held a significant proportion of roughly 57.54%.
  • The Large companies segment is leading the market demand.

Segmentation by Therapy Area

  • In 2022, the oncology section held a significant proportion of roughly 30.71%.
  • The infectious diseases segment also contributes significantly to the pharmaceutical R&D outsourcing market.
  • The market for new and innovative medicines for cardiovascular diseases is considerable, which is driving growth in the pharmaceutical R&D outsourcing market.

Segmentation by Region

  • North America is the most important market for pharmaceutical R&D outsourcing, accounting for a sizable portion of the global market.
  • The Asia-Pacific region is expected to have the greatest CAGR in the pharmaceutical R&D outsourcing market during the projected period.
  • The rest of the World, including Latin America, The Middle East, and Africa, contributes the remainder to the demand for pharma R&D outsourcing.

The growing demand for pharma R&D outsourcing can be traced to the increased usage of cloud computing and related software platforms in research and development, as well as Al’s appearance in drug discovery and development. However, the market is constrained by intellectual property concerns and the high cost and low success rate of pharmaceutical research and development.

North America is the largest market for pharmaceutical R&D outsourcing, accounting for a sizable portion of the global market. The United States is the largest market in North America, owing to the presence of several of the world’s major pharmaceutical corporations, as well as a huge number of specialized service providers. Europe is the second-largest market for pharmaceutical R&D outsourcing, with the UK and Germany being important players.

The Asia-Pacific area is also a big market, with key outsourcing destinations such as India and China. There are also considerable disparities in the level of outsourcing activity within these regions, with certain countries and regions having a more developed outsourcing ecosystem than others. India, for example, has a significant number of CROs and CDMOs as well as a highly skilled staff, making it a favorite outsourcing destination for pharmaceutical corporations. Similarly, the UK has a well-developed regulatory environment and a highly skilled population, which has contributed to the region’s outsourcing activity.

Overall, the expanding usage of cloud computing and related software platforms in research and development, as well as Al’s appearance in drug discovery and development, can be attributable to the increased demand for pharma R&D outsourcing.

Increased Use of Cloud Computing and Related Software Platforms in R&D

Even though many worldwide firms are utilizing cloud infrastructure to allow employees to work from home, many may still require optimization of their cloud and data strategies to aid in innovation, research, and development. The cloud can immediately build up infrastructure, grow or shrink as needed, and secure physical data centers and virtual networks, making it an excellent way to assist R&D. Furthermore, businesses can develop secure digital apps and platforms more quickly. Finally, the cloud provides the ability to store and combine data across a secure network. This feature allows for interoperable data and cooperation, collaboration, and co-creation among organizations. The cloud makes data possible, and projects to modernize data are closely related to the cloud.

By 2025, the amount of data generated by human genome sequencing is expected to reach 40 exabytes, and scientists will have spent up to 30%–40% of their time looking for, combining, and cleaning data. The cloud could be a game changer in terms of bringing drugs to market faster and at a lower cost. It has already beaten the world record for analyzing elastic genetic data. According to various studies, combining infrastructure and resources for master protocols can reduce research cycle time by 12-17% while reducing overall expenses by 11-14%, accelerating market growth.

Al’s Appearance in Drug Discovery and Development

Al has a big impact on healthcare, especially in the pharmaceutical business, where it’s employed for drug research and development, clinical trials, and pharmaceutical productivity. The search for new drugs takes a long time. The life cycle of a new medication entails a series of intricate tasks that demand time and development from the lab to the pharmacy. With Al’s assistance, these complex occurrences will occur less frequently, and pharmaceutical companies will be able to achieve their goal of developing a medicine more swiftly.

Pharmaceutical corporations have made numerous advances but have yet to see a return on their R&D efforts. The average investment in research and development for successful drug development is USD 2.6 billion. This cost includes millions of compounds’ recurrent success or failure in the R&D process to acquire approval. To deliver high-quality findings fast, several pharmaceutical businesses use cutting-edge technology such as Al and machine learning. These initiatives can generate a tremendous amount of data, and Al can sort the correct experiment information. Al has been used more frequently in advanced studies in recent years, propelling the market’s growth.

Pharmaceutical R&D is expensive and has a low success rate

The pharmaceutical sector spent 83 billion USD on research and development in 2019. These expenses were incurred for a number of activities, including the discovery and testing of novel medications, the development of incremental advances such as product modifications, and clinical testing for safety monitoring or marketing. The percentage of revenue spent on R&D by pharmaceutical businesses is also increasing. Developing novel medications is costly and uncertain, and many prospective drugs never make it to market.

 Only 12% of medications that have undergone thorough preclinical testing and clinical trials are approved by the FDA. The development process might also take more than 10 years, during which time the corporation receives no financial incentive for investing in the drug’s development, impeding market expansion.

Concerns About Intellectual Property

Pharmaceutical research and development (R&D) outsourcing has grown in popularity in recent years as it helps pharmaceutical corporations to decrease expenses and hasten the medication development process. However, one key impediment to the pharmaceutical R&D outsourcing business is the issue of intellectual property (IP) concerns.

When pharmaceutical companies outsource R&D activities to third-party service providers, they may be obliged to reveal sensitive information about medication development, such as trade secrets, intellectual information, and confidential data. This can pose considerable dangers in terms of intellectual property theft, infringement, and misappropriation, with serious ramifications for the pharmaceutical company and its stakeholders.

To overcome this issue, pharmaceutical companies must be proactive in controlling their intellectual property risks, such as creating appropriate contracts, confidentiality agreements, and security standards with their outsourcing partners. They must also verify that their outsourcing partners have the required experience, resources, and infrastructure to secure their intellectual property while maintaining the highest data security and confidentiality standards. By following these procedures, pharmaceutical companies can reduce the risks connected with intellectual property problems while continuing to reap the benefits of R&D outsourcing.

Venture Capitalist Investments in the Life Sciences/Blotch Industry are on the Rise

Big pharma’s attention and corporate investment are dominated by experimental anti-cancer medications, including lead generation platform technology, metabolism, ophthalmology, cardiology, central nervous system (CNS), dermatological, gastrointestinal (G. I.), and inflammation. Novartis, One, Amgen, Astellas, Pfizer, S.R. and J&J Development Corp. are among the industry’s biggest corporate venture investors. More than half of these new investments, according to SVB, were in preclinical or Phase I enterprises.

The strong venture capital sector practiced by private investors in new biopharma businesses is an important component of the US biopharma innovation ecosystem. Venture capital investment in biotechnology firms has reached new heights in recent years. This investment comprises huge sums of money given to biotechnology startups by existing biopharma businesses through their corporate venture capital (CVC) divisions. A corporation participates in CVC activity, a subset of venture capital investment when it invests in an affiliate. Typically, investment is given to a promising startup in the company’s field. Record-breaking investments in the biopharma industry have created a plethora of new prospects in global healthcare.

Access to Specialized Knowledge

Pharmaceutical research and development is a complex and highly specialized industry that necessitates a diverse set of skills, including scientific, technological, regulatory, and legal understanding. Pharmaceutical businesses can get access to a bigger pool of specialized expertise by outsourcing R&D efforts to third-party service providers. This can involve, among other things, expertise in specialized therapeutic areas, medication delivery technology, clinical trial design, and regulatory compliance.

Access to specialist expertise can assist pharmaceutical businesses to accelerate drug development, decrease costs, and improve product quality. It might also assist them in remaining competitive in a continuously changing market by keeping up with the most recent scientific and technological advancements.

Pharmaceutical businesses must carefully select their outsourcing partners based on their expertise, experience, and track record in order to capitalize on this potential. They must also guarantee that their outsourcing partners understand and can work together to achieve their business objectives, priorities, and values. Pharmaceutical firms can achieve a competitive advantage in the market by using the benefits of specialized expertise.

Competitive Landscape

Key Players

The global pharma R&D outsourcing market is highly competitive, with the presence of several key players. Some of the major players in the market and their market share are as follows:

  • Charles River Laboratories
  • ICON
  • IQVIA
  • Labcorp Drug Development
  • Medpace
  • Parexel International Corporation
  • Syneos Health
  • Thermo Fisher Scientific
  • Wuxi AppTec
  • Lonza
  • Boehringer Ingelheim
  • Samsung Biologics
  • AbbVie
  • Advanced Clinical
  • BioAnalytix
  • Asymchem
  • Alcami
  • Catalent
  • Curia Global
  • ChemPartner
  • CMED
  • Criterium
  • Cromos Pharma
  • Evotec
  • KBI Biopharma
  • KCR S.A.
  • Kemwell Biopharma
  • Mesned Pharma Consult Center
  • Medelis
  • OCT Clinical
  • ProTrials Research
  • PROMETRIKA
  • QPS
  • Singota Solutions
  • Sofpromed
  • WuXi Biologics
  • Others

These companies focus on product innovation, expanding their distribution channels, and mergers and acquisitions to stay ahead in the market. The major players in the global pharma R&D outsourcing market are constantly striving to stay ahead by introducing new products and innovations.

In order to launch the nation’s first Prime Site in November 2022, IQVIA Holdings Inc. signed a long-term cooperation with Clalit, the leading supplier of healthcare services in Israel. The collaboration brings together the strengths of IQVIA and Clalit in data, genomics, real-world research, and clinical trial delivery.

Lonza unveiled a groundbreaking new capsule solution for enteric (intestinal) medication administration in November 2022. The contents of the Capsugel EnprotectTM capsule are only released in the intestine and do not disintegrate during stomach transit. Because they do not need to be coated or sealed in any other manner, Capsugel EnprotectTM capsules make it much easier to manufacture drug products.

Shape Your Report to Specific Countries or Regions & Enjoy 30% Off!

Summary of Key Findings

  • Increased use of cloud computing and related software platforms in research and development, as well as Al’s appearance in drug discovery and development, driving market growth
  • Market segmented by Product type, stage of development, and company size. Therapy area and region.
  • The large companies segment is leading the market demand.
  • The biologics segment will likely exhibit the fastest CAGR during the forecast period.
  • North America is leading market growth; the market is highly competitive with key players including Advanced Clinical, BioAnalytix, Asymchem and Alcam.

Future Outlook

  • It is projected that technical advancements like artificial intelligence and machine learning would gain industry traction.
  • It is projected that there will be more competition in the industry as new service providers enter the space and existing ones expand their product portfolios.
  • Political and regulatory developments, such as modifications to the rules governing drug pricing, may have an effect on the market in the future.
  • The need for pharmaceutical R&D outsourcing services has surged as a result of the COVID-19 pandemic, and this trend is anticipated to remain for the foreseeable future.

Segmentation

  • By Product Type
    • Small Molecules
    • Biologics
  • By Stage of Development
    • Clinical
    • Non-Clinical
  • By Company Size
    • Small & Mid-Sized Companies
    • Large Companies
  • By Therapy Area
    • Oncology
    • Cardiovascular Diseases
    • Infectious Diseases
    • Musculoskeletal Disorders
    • Central Nervous System Disorders
    • Gastrointestinal Disorders
    • Other Therapy Areas
  • By Region
    • North America
      • The US.
      • Canada
      • Mexico
    • Europe
      • Germany
      • France
      • The U.K.
      • Italy
      • Spain
      • Rest of Europe
    • Asia Pacific
      • China
      • Japan
      • India
      • South Korea
      • South-east Asia
      • Rest of Asia Pacific
    • Latin America
      • Brazil
      • Argentina
      • Rest of Latin America
    • Middle East & Africa
      • GCC Countries
      • South Africa
      • Rest of the Middle East and Africa

CHAPTER NO. 1 : INTRODUCTION. 48

1.1. Report Description 48

1.1.1. Purpose of the Report 48

1.1.2. USP & Key Offerings. 48

1.2. Key Benefits for Stakeholders 48

1.3. Target Audience 49

1.4. Report Scope 50

CHAPTER NO. 2 : EXECUTIVE SUMMARY 52

2.1. Pharma R&D Outsourcing Market Snapshot 52

2.2. Global Pharma R&D Outsourcing Market, 2017 – 2022 (USD Million) 53

CHAPTER NO. 3 : IMPACT ANALYSIS OF COVID 19 & RUSSIA-UKRAINE WAR ON

3.1. Impact Assessment of COVID-19 Pandemic, By Region . 54

3.1.1. Impact of COVID-19 on Global Pharma R&D Outsourcing: 54

3.1.2. Geopolitical Impact on Global Pharma R&D Outsourcing: 55

3.1.3. Israel’s Role in Pharma R&D: 56

3.1.4. Considerations for the Future: . 56

CHAPTER NO. 4 : PHARMA R&D OUTSOURCING MARKET – INDUSTRY ANALYSIS . 57

4.1. Introduction 57

4.2. Market Drivers. 58

4.2.1. Numerous benefits arise from outsourcing pharmaceutical research and

development. 58

4.2.2. Rising Outsourcing of Research and Development . 59

4.2.3. Increased Demand for Outsourced Services. 59

4.3. Market Restraints 60

4.3.1. Clinical Trial Failures 60

4.3.2. Stringent Government Regulations 61

4.4. Market Opportunities 62

4.4.1. Emergence of Pharma R&D Outsourcing in Developing Countries 62

4.4.2. Increased R&D by Biopharmaceutical Vendors. 63

GLOBAL PHARMA R&D OUTSOURCING MARKET, 2017 – 2030

9

4.5. Porter’s Five Forces Analysis 64

4.6. Value Chain Analysis 66

4.7. Buying Criteria69

CHAPTER NO. 5 : ANALYSIS COMPETITIVE LANDSCAPE 70

5.1. Company Market Share Analysis – 2022 70

5.1.1. Global Pharma R&D Outsourcing Market: Top 5 Company Market Share,

by Revenue 2022 . 70

5.1.2. Global Pharma R&D Outsourcing Market: Top 10 Company Market Share,

by Revenue 2022 . 71

5.1. Global Pharma R&D Outsourcing Market Company Revenue Market Share, 2022 72

5.2. Company Assessment Metrics. 73

5.2.1. Stars 73

5.2.2. Emerging Leaders 73

5.2.3. Pervasive Players. 73

5.2.4. Participants . 73

5.3. Key Players Product Matrix . 74

CHAPTER NO. 6 : PESTEL & ADJACENT MARKET ANALYSIS. 78

6.1. PESTEL 78

6.1.1. Political Factors . 78

6.1.2. Economic Factors. 78

6.1.3. Social Factors. 78

6.1.4. Technological Factors 78

6.1.5. Environmental Factors. 79

6.1.6. Legal Factors 79

6.2. Adjacent Market Analysis 80

CHAPTER NO. 7 : PHARMA R&D OUTSOURCING MARKET – BY TYPE SEGMENT

ANALYSIS 83

7.1. Pharma R&D Outsourcing Market Overview, by Type Segment 83

7.1.1. Pharma R&D Outsourcing Market Revenue Share, By Type, 2022 & 2030 83

7.1.2. Pharma R&D Outsourcing Market Attractiveness Analysis, By Type 84

7.1.3. Incremental Revenue Growth Opportunity, by Type, 2023 – 2030 84

7.1.4. Pharma R&D Outsourcing Market Revenue, By Type, 2017 to 2022 . 85

7.2. Small Molecules. 86

7.3. Biologics 87

GLOBAL PHARMA R&D OUTSOURCING MARKET, 2017 – 2030

10

CHAPTER NO. 8 : PHARMA R&D OUTSOURCING MARKET – BY THERAPY AREA

SEGMENT ANALYSIS 88

8.1. Pharma R&D Outsourcing Market Overview, by Therapy Area Segment. 88

8.1.1. Pharma R&D Outsourcing Market Revenue Share, By Therapy Area, 2022

& 2030. 88

8.1.2. Pharma R&D Outsourcing Market Attractiveness Analysis, By Therapy Area 89

8.1.3. Incremental Revenue Growth Opportunity, by Therapy Area, 2023 – 2030. 89

8.1.4. Pharma R&D Outsourcing Market Revenue, By Therapy Area, 2017 to

2022 90

8.2. Oncology 91

8.3. Cardiovascular Diseases. 92

8.4. Infectious Diseases 93

8.5. Musculoskeletal Disorders. 94

8.6. Others 95

CHAPTER NO. 9 : PHARMA R&D OUTSOURCING MARKET – BY END-USER SEGMENT

ANALYSIS 96

9.1. Pharma R&D Outsourcing Market Overview, by End-user Segment 96

9.1.1. Pharma R&D Outsourcing Market Revenue Share, By End-user, 2022 &

2030 96

9.1.2. Pharma R&D Outsourcing Market Attractiveness Analysis, By End-user . 97

9.1.3. Incremental Revenue Growth Opportunity, by End-user, 2023 – 2030 97

9.1.4. Pharma R&D Outsourcing Market Revenue, By End-user, 2017 to 2022 . 98

9.2. Small & Mid-Sized Companies. 99

9.3. Large Companies . 100

CHAPTER NO. 10 : PHARMA R&D OUTSOURCING MARKET – BY FUNCTION SEGMENT

ANALYSIS 101

10.1. Pharma R&D Outsourcing Market Overview, by Function Segment 101

10.1.1. Pharma R&D Outsourcing Market Revenue Share, By Function, 2022 &

2030 101

10.1.2. Pharma R&D Outsourcing Market Attractiveness Analysis, By Function . 102

10.1.3. Incremental Revenue Growth Opportunity, by Function, 2023 – 2030 103

10.1.4. Pharma R&D Outsourcing Market Revenue, By Function, 2017 to 2022 . 104

10.2. Clinical 105

10.3. Regulatory Affairs Outsourcing 106

10.4. Bioanalytical Testing Services 107

GLOBAL PHARMA R&D OUTSOURCING MARKET, 2017 – 2030

11

10.5. Others 108

CHAPTER NO. 11 : PHARMA R&D OUTSOURCING MARKET – REGIONAL ANALYSIS. 109

11.1. Pharma R&D Outsourcing Market Overview, by Regional Segments. 109

11.2. Region 109

11.2.1. Global Pharma R&D Outsourcing Market Revenue Share, By Region, 2022

& 2030. 109

11.2.2. Pharma R&D Outsourcing Market Attractiveness Analysis, By Region 110

11.2.3. Incremental Revenue Growth Opportunity, by Region, 2023 – 2030. 111

11.2.4. Pharma R&D Outsourcing Market Revenue, By Region, 2017 to 2022 112

11.3. Type 113

11.3.1. Global Pharma R&D Outsourcing Market Revenue, By Type, 2017 – 2022

(USD Million) . 113

11.3.2. Global Pharma R&D Outsourcing Market Revenue, By Type, 2023 – 2030

(USD Million) . 113

11.4. Therapy Area 114

11.4.1. Global Pharma R&D Outsourcing Market Revenue, By Therapy Area, 2017

– 2022 (USD Million). 114

11.4.2. Global Pharma R&D Outsourcing Market Revenue, By Therapy Area, 2023

– 2030 (USD Million). 114

11.5. End-user 115

11.5.1. Global Pharma R&D Outsourcing Market Revenue, By End-user, 2017 –

2022 (USD Million). 115

11.5.2. Global Pharma R&D Outsourcing Market Revenue, By End-user, 2023 –

2030 (USD Million). 115

11.6. Function 116

11.6.1. Global Pharma R&D Outsourcing Market Revenue, By Function, 2017 –

2022 (USD Million). 116

11.6.2. Global Pharma R&D Outsourcing Market Revenue, By Function, 2023 –

2030 (USD Million). 116

CHAPTER NO. 12 : PHARMA R&D OUTSOURCING MARKET – NORTH AMERICA 117

12.1. North America117

12.1. Key Highlights 118

12.1.1. North America Pharma R&D Outsourcing Market Revenue, By Country,

2017 – 2022 (USD Million) 119

12.1.2. North America Pharma R&D Outsourcing Market Revenue, By Type, 2017 –

2022 (USD Million). 120

12.1.3. North America Pharma R&D Outsourcing Market Revenue, By Therapy

Area, 2017 – 2022 (USD Million). 121

GLOBAL PHARMA R&D OUTSOURCING MARKET, 2017 – 2030

12

12.1.4. North America Pharma R&D Outsourcing Market Revenue, By End-user,

2017 – 2022 (USD Million) 122

12.1.5. North America Pharma R&D Outsourcing Market Revenue, By Function,

2017 – 2022 (USD Million) 123

12.1.6. U.S. 124

12.1.7. U.S. Pharma R&D Outsourcing Market Revenue, By Type, 2017 – 2022

(USD Million) . 124

12.1.8. U.S. Pharma R&D Outsourcing Market Revenue, By Therapy Area, 2017 –

2022 (USD Million). 125

12.1.9. U.S. Pharma R&D Outsourcing Market Revenue, By End-user, 2017 – 2022

(USD Million) . 126

12.1.10. U.S. Pharma R&D Outsourcing Market Revenue, By Function, 2017

– 2022 (USD Million). 127

12.1.11. Canada . 128

12.1.12. Canada Pharma R&D Outsourcing Market Revenue, By Type, 2017 –

2022 (USD Million). 128

12.1.13. Canada Pharma R&D Outsourcing Market Revenue, By Therapy

Area, 2017 – 2022 (USD Million). 129

12.1.14. Canada Pharma R&D Outsourcing Market Revenue, By End-user,

2017 – 2022 (USD Million) 130

12.1.15. Canada Pharma R&D Outsourcing Market Revenue, By Function,

2017 – 2022 (USD Million) 131

12.1.16. Mexico 132

12.1.17. Mexico Pharma R&D Outsourcing Market Revenue, By Type, 2017 –

2022 (USD Million). 132

12.1.18. Mexico Pharma R&D Outsourcing Market Revenue, By Therapy

Area, 2017 – 2022 (USD Million). 133

12.1.19. Mexico Pharma R&D Outsourcing Market Revenue, By End-user,

2017 – 2022 (USD Million) 134

12.1.20. Mexico Pharma R&D Outsourcing Market Revenue, By Function,

2017 – 2022 (USD Million) 135

CHAPTER NO. 13 : PHARMA R&D OUTSOURCING MARKET – EUROPE. 136

13.1. Europe 136

13.2. Key Highlights 137

13.2.1. Europe Pharma R&D Outsourcing Market Revenue, By Country, 2017 –

2030 (USD Million). 138

13.2.2. Europe Pharma R&D Outsourcing Market Revenue, By Type, 2017 – 2022

(USD Million) . 140

13.2.3. Europe Pharma R&D Outsourcing Market Revenue, By Therapy Area, 2017

– 2022 (USD Million). 141

GLOBAL PHARMA R&D OUTSOURCING MARKET, 2017 – 2030

13

13.2.4. Europe Pharma R&D Outsourcing Market Revenue, By End-user, 2017 –

2022 (USD Million). 142

13.2.5. Europe Pharma R&D Outsourcing Market Revenue, By Function, 2017 –

2022 (USD Million). 143

13.2.6. UK 144

13.2.7. UK Pharma R&D Outsourcing Market Revenue, By Type, 2017 – 2022 (USD

Million) 144

13.2.8. UK Pharma R&D Outsourcing Market Revenue, By Therapy Area, 2017 –

2022 (USD Million). 145

13.2.9. UK Pharma R&D Outsourcing Market Revenue, By End-user, 2017 – 2022

(USD Million) . 146

13.2.10. UK Pharma R&D Outsourcing Market Revenue, By Function, 2017 –

2022 (USD Million). 147

13.2.11. France 148

13.2.12. France Pharma R&D Outsourcing Market Revenue, By Type, 2017 –

2022 (USD Million). 148

13.2.13. France Pharma R&D Outsourcing Market Revenue, By Therapy

Area, 2017 – 2022 (USD Million). 149

13.2.14. France Pharma R&D Outsourcing Market Revenue, By End-user,

2017 – 2022 (USD Million) 150

13.2.15. France Pharma R&D Outsourcing Market Revenue, By Function,

2017 – 2022 (USD Million) 151

13.2.16. Germany. 152

13.2.17. Germany Pharma R&D Outsourcing Market Revenue, By Type,

2017 – 2022 (USD Million) 152

13.2.18. Germany Pharma R&D Outsourcing Market Revenue, By Therapy

Area, 2017 – 2022 (USD Million). 153

13.2.19. Germany Pharma R&D Outsourcing Market Revenue, By End-user,

2017 – 2022 (USD Million) 154

13.2.20. Germany Pharma R&D Outsourcing Market Revenue, By Function,

2017 – 2022 (USD Million) 155

13.2.21. Italy 156

13.2.22. Italy Pharma R&D Outsourcing Market Revenue, By Type, 2017 –

2022 (USD Million). 156

13.2.23. Italy Pharma R&D Outsourcing Market Revenue, By Therapy Area,

2017 – 2022 (USD Million) 157

13.2.24. Italy Pharma R&D Outsourcing Market Revenue, By End-user, 2017

– 2022 (USD Million). 158

13.2.25. Italy Pharma R&D Outsourcing Market Revenue, By Function, 2017

– 2022 (USD Million). 159

13.2.26. Spain 160

GLOBAL PHARMA R&D OUTSOURCING MARKET, 2017 – 2030

14

13.2.27. Spain Pharma R&D Outsourcing Market Revenue, By Type, 2017 –

2022 (USD Million). 160

13.2.28. Spain Pharma R&D Outsourcing Market Revenue, By Therapy Area,

2017 – 2022 (USD Million) 161

13.2.29. Spain Pharma R&D Outsourcing Market Revenue, By End-user,

2017 – 2022 (USD Million) 162

13.2.30. Spain Pharma R&D Outsourcing Market Revenue, By Function,

2017 – 2022 (USD Million) 163

13.2.31. Russia . 164

13.2.32. Russia Pharma R&D Outsourcing Market Revenue, By Type, 2017 –

2022 (USD Million). 164

13.2.33. Russia Pharma R&D Outsourcing Market Revenue, By Therapy

Area, 2017 – 2022 (USD Million). 165

13.2.34. Russia Pharma R&D Outsourcing Market Revenue, By End-user,

2017 – 2022 (USD Million) 166

13.2.35. Russia Pharma R&D Outsourcing Market Revenue, By Function,

2017 – 2022 (USD Million) 167

13.2.36. Belgium 168

13.2.37. Belgium Pharma R&D Outsourcing Market Revenue, By Type, 2017

– 2022 (USD Million). 168

13.2.38. Belgium Pharma R&D Outsourcing Market Revenue, By Therapy

Area, 2017 – 2022 (USD Million). 169

13.2.39. Belgium Pharma R&D Outsourcing Market Revenue, By End-user,

2017 – 2022 (USD Million) 170

13.2.40. Belgium Pharma R&D Outsourcing Market Revenue, By Function,

2017 – 2022 (USD Million) 171

13.2.41. Netherland . 172

13.2.42. Netherland Pharma R&D Outsourcing Market Revenue, By Type,

2017 – 2022 (USD Million) 172

13.2.43. Netherland Pharma R&D Outsourcing Market Revenue, By Therapy

Area, 2017 – 2022 (USD Million). 173

13.2.44. Netherland Pharma R&D Outsourcing Market Revenue, By End￾user, 2017 – 2022 (USD Million) 174

13.2.45. Netherland Pharma R&D Outsourcing Market Revenue, By

Function, 2017 – 2022 (USD Million). 175

13.2.46. Austria 176

13.2.47. Austria Pharma R&D Outsourcing Market Revenue, By Type, 2017 –

2022 (USD Million). 176

13.2.48. Austria Pharma R&D Outsourcing Market Revenue, By Therapy

Area, 2017 – 2022 (USD Million). 177

GLOBAL PHARMA R&D OUTSOURCING MARKET, 2017 – 2030

15

13.2.49. Austria Pharma R&D Outsourcing Market Revenue, By End-user,

2017 – 2022 (USD Million) 178

13.2.50. Austria Pharma R&D Outsourcing Market Revenue, By Function,

2017 – 2022 (USD Million) 179

13.2.51. Sweden. 180

13.2.52. Sweden Pharma R&D Outsourcing Market Revenue, By Type, 2017

– 2022 (USD Million). 180

13.2.53. Sweden Pharma R&D Outsourcing Market Revenue, By Therapy

Area, 2017 – 2022 (USD Million). 181

13.2.54. Sweden Pharma R&D Outsourcing Market Revenue, By End-user,

2017 – 2022 (USD Million) 182

13.2.55. Sweden Pharma R&D Outsourcing Market Revenue, By Function,

2017 – 2022 (USD Million) 183

13.2.56. Poland 184

13.2.57. Poland Pharma R&D Outsourcing Market Revenue, By Type, 2017 –

2022 (USD Million). 184

13.2.58. Poland Pharma R&D Outsourcing Market Revenue, By Therapy

Area, 2017 – 2022 (USD Million). 185

13.2.59. Poland Pharma R&D Outsourcing Market Revenue, By End-user,

2017 – 2022 (USD Million) 186

13.2.60. Poland Pharma R&D Outsourcing Market Revenue, By Function,

2017 – 2022 (USD Million) 187

13.2.61. Denmark. 188

13.2.62. Denmark Pharma R&D Outsourcing Market Revenue, By Type,

2017 – 2022 (USD Million) 188

13.2.63. Denmark Pharma R&D Outsourcing Market Revenue, By Therapy

Area, 2017 – 2022 (USD Million). 189

13.2.64. Denmark Pharma R&D Outsourcing Market Revenue, By End-user,

2017 – 2022 (USD Million) 190

13.2.65. Denmark Pharma R&D Outsourcing Market Revenue, By Function,

2017 – 2022 (USD Million) 191

13.2.66. Switzerland. 192

13.2.67. Switzerland Pharma R&D Outsourcing Market Revenue, By Type,

2017 – 2022 (USD Million) 192

13.2.68. Switzerland Pharma R&D Outsourcing Market Revenue, By Therapy

Area, 2017 – 2022 (USD Million). 193

13.2.69. Switzerland Pharma R&D Outsourcing Market Revenue, By End￾user, 2017 – 2022 (USD Million) 194

13.2.70. Switzerland Pharma R&D Outsourcing Market Revenue, By

Function, 2017 – 2022 (USD Million). 195

13.2.71. Rest of Europe 196

GLOBAL PHARMA R&D OUTSOURCING MARKET, 2017 – 2030

16

13.2.72. Rest of Europe Pharma R&D Outsourcing Market Revenue, By

Type, 2017 – 2022 (USD Million). 196

13.2.73. Rest of Europe Pharma R&D Outsourcing Market Revenue, By

Therapy Area, 2017 – 2022 (USD Million) . 197

13.2.74. Rest of Europe Pharma R&D Outsourcing Market Revenue, By End￾user, 2017 – 2022 (USD Million) 198

13.2.75. Rest of Europe Pharma R&D Outsourcing Market Revenue, By

Function, 2017 – 2022 (USD Million). 199

CHAPTER NO. 14 : PHARMA R&D OUTSOURCING MARKET – ASIA PACIFIC . 200

14.1. Asia Pacific 200

14.2. Key Highlights 201

14.2.1. Asia Pacific Pharma R&D Outsourcing Market Revenue, By Country, 2017 –

2022 (USD Million). 202

14.2.2. Asia Pacific Pharma R&D Outsourcing Market Revenue, By Type, 2017 –

2022 (USD Million). 204

14.2.3. Asia Pacific Pharma R&D Outsourcing Market Revenue, By Therapy Area,

2017 – 2022 (USD Million) 205

14.2.4. Asia Pacific Pharma R&D Outsourcing Market Revenue, By End-user, 2017

– 2022 (USD Million). 206

14.2.5. Asia Pacific Pharma R&D Outsourcing Market Revenue, By Function, 2017

– 2022 (USD Million). 207

14.2.6. China 208

14.2.7. China Pharma R&D Outsourcing Market Revenue, By Type, 2017 – 2022

(USD Million) . 208

14.2.8. China Pharma R&D Outsourcing Market Revenue, By Therapy Area, 2017 –

2022 (USD Million). 209

14.2.9. China Pharma R&D Outsourcing Market Revenue, By End-user, 2017 –

2022 (USD Million). 210

14.2.10. China Pharma R&D Outsourcing Market Revenue, By Function,

2017 – 2022 (USD Million) 211

14.2.11. Japan 212

14.2.12. Japan Pharma R&D Outsourcing Market Revenue, By Type, 2017 –

2022 (USD Million). 212

14.2.13. Japan Pharma R&D Outsourcing Market Revenue, By Therapy Area,

2017 – 2022 (USD Million) 213

14.2.14. Japan Pharma R&D Outsourcing Market Revenue, By End-user,

2017 – 2022 (USD Million) 214

14.2.15. Japan Pharma R&D Outsourcing Market Revenue, By Function,

2017 – 2022 (USD Million) 215

14.2.16. South Korea 216

GLOBAL PHARMA R&D OUTSOURCING MARKET, 2017 – 2030

17

14.2.17. South Korea Pharma R&D Outsourcing Market Revenue, By Type,

2017 – 2022 (USD Million) 216

14.2.18. South Korea Pharma R&D Outsourcing Market Revenue, By

Therapy Area, 2017 – 2022 (USD Million) . 217

14.2.19. South Korea Pharma R&D Outsourcing Market Revenue, By End￾user, 2017 – 2022 (USD Million) 218

14.2.20. South Korea Pharma R&D Outsourcing Market Revenue, By

Function, 2017 – 2022 (USD Million). 219

14.2.21. India . 220

14.2.22. India Pharma R&D Outsourcing Market Revenue, By Type, 2017 –

2022 (USD Million). 220

14.2.23. India Pharma R&D Outsourcing Market Revenue, By Therapy Area,

2017 – 2022 (USD Million) 221

14.2.24. India Pharma R&D Outsourcing Market Revenue, By End-user, 2017

– 2022 (USD Million). 222

14.2.25. India Pharma R&D Outsourcing Market Revenue, By Function, 2017

– 2022 (USD Million). 223

14.2.26. Australia . 224

14.2.27. Australia Pharma R&D Outsourcing Market Revenue, By Type, 2017

– 2022 (USD Million). 224

14.2.28. Australia Pharma R&D Outsourcing Market Revenue, By Therapy

Area, 2017 – 2022 (USD Million). 225

14.2.29. Australia Pharma R&D Outsourcing Market Revenue, By End-user,

2017 – 2022 (USD Million) 226

14.2.30. Australia Pharma R&D Outsourcing Market Revenue, By Function,

2017 – 2022 (USD Million) 227

14.2.31. Thailand 228

14.2.32. Thailand Pharma R&D Outsourcing Market Revenue, By Type, 2017

– 2022 (USD Million). 228

14.2.33. Thailand Pharma R&D Outsourcing Market Revenue, By Therapy

Area, 2017 – 2022 (USD Million). 229

14.2.34. Thailand Pharma R&D Outsourcing Market Revenue, By End-user,

2017 – 2022 (USD Million) 230

14.2.35. Thailand Pharma R&D Outsourcing Market Revenue, By Function,

2017 – 2022 (USD Million) 231

14.2.36. Indonesia 232

14.2.37. Indonesia Pharma R&D Outsourcing Market Revenue, By Type,

2017 – 2022 (USD Million) 232

14.2.38. Indonesia Pharma R&D Outsourcing Market Revenue, By Therapy

Area, 2017 – 2022 (USD Million). 233

GLOBAL PHARMA R&D OUTSOURCING MARKET, 2017 – 2030

18

14.2.39. Indonesia Pharma R&D Outsourcing Market Revenue, By End-user,

2017 – 2022 (USD Million) 234

14.2.40. Indonesia Pharma R&D Outsourcing Market Revenue, By Function,

2017 – 2022 (USD Million) 235

14.2.41. Vietnam 236

14.2.42. Vietnam Pharma R&D Outsourcing Market Revenue, By Type, 2017

– 2022 (USD Million). 236

14.2.43. Vietnam Pharma R&D Outsourcing Market Revenue, By Therapy

Area, 2017 – 2022 (USD Million). 237

14.2.44. Vietnam Pharma R&D Outsourcing Market Revenue, By End-user,

2017 – 2022 (USD Million) 238

14.2.45. Vietnam Pharma R&D Outsourcing Market Revenue, By Function,

2017 – 2022 (USD Million) 239

14.2.46. Malaysia . 240

14.2.47. Malaysia Pharma R&D Outsourcing Market Revenue, By Type, 2017

– 2022 (USD Million). 240

14.2.48. Malaysia Pharma R&D Outsourcing Market Revenue, By Therapy

Area, 2017 – 2022 (USD Million). 241

14.2.49. Malaysia Pharma R&D Outsourcing Market Revenue, By End-user,

2017 – 2022 (USD Million) 242

14.2.50. Malaysia Pharma R&D Outsourcing Market Revenue, By Function,

2017 – 2022 (USD Million) 243

14.2.51. Philippines 244

14.2.52. Philippines Pharma R&D Outsourcing Market Revenue, By Type,

2017 – 2022 (USD Million) 244

14.2.53. Philippines Pharma R&D Outsourcing Market Revenue, By Therapy

Area, 2017 – 2022 (USD Million). 245

14.2.54. Philippines Pharma R&D Outsourcing Market Revenue, By End￾user, 2017 – 2022 (USD Million) 246

14.2.55. Philippines Pharma R&D Outsourcing Market Revenue, By

Function, 2017 – 2022 (USD Million). 247

14.2.56. Taiwan 248

14.2.57. Taiwan Pharma R&D Outsourcing Market Revenue, By Type, 2017 –

2022 (USD Million). 248

14.2.58. Taiwan Pharma R&D Outsourcing Market Revenue, By Therapy

Area, 2017 – 2022 (USD Million). 249

14.2.59. Taiwan Pharma R&D Outsourcing Market Revenue, By End-user,

2017 – 2022 (USD Million) 250

14.2.60. Taiwan Pharma R&D Outsourcing Market Revenue, By Function,

2017 – 2022 (USD Million) 251

14.2.61. Rest of Asia Pacific 252

GLOBAL PHARMA R&D OUTSOURCING MARKET, 2017 – 2030

19

14.2.62. Rest of Asia Pacific Pharma R&D Outsourcing Market Revenue, By

Type, 2017 – 2022 (USD Million). 252

14.2.63. Rest of Asia Pacific Pharma R&D Outsourcing Market Revenue, By

Therapy Area, 2017 – 2022 (USD Million) . 253

14.2.64. Rest of Asia Pacific Pharma R&D Outsourcing Market Revenue, By

End-user, 2017 – 2022 (USD Million). 254

14.2.65. Rest of Asia Pacific Pharma R&D Outsourcing Market Revenue, By

Function, 2017 – 2022 (USD Million). 255

CHAPTER NO. 15 : PHARMA R&D OUTSOURCING MARKET – LATIN AMERICA 256

15.1. Latin America 256

15.2. Key Highlights 257

15.2.1. Latin America Pharma R&D Outsourcing Market Revenue, By Country,

2017 – 2022 (USD Million) 258

15.2.2. Latin America Pharma R&D Outsourcing Market Revenue, By Type, 2017 –

2022 (USD Million). 259

15.2.3. Latin America Pharma R&D Outsourcing Market Revenue, By Therapy

Area, 2017 – 2022 (USD Million). 260

15.2.4. Latin America Pharma R&D Outsourcing Market Revenue, By End-user,

2017 – 2022 (USD Million) 261

15.2.5. Latin America Pharma R&D Outsourcing Market Revenue, By Function,

2017 – 2022 (USD Million) 262

15.2.6. Brazil 263

15.2.7. Brazil Pharma R&D Outsourcing Market Revenue, By Type, 2017 – 2022

(USD Million) . 263

15.2.8. Brazil Pharma R&D Outsourcing Market Revenue, By Therapy Area, 2017 –

2022 (USD Million). 264

15.2.9. Brazil Pharma R&D Outsourcing Market Revenue, By End-user, 2017 –

2022 (USD Million). 265

15.2.10. Brazil Pharma R&D Outsourcing Market Revenue, By Function,

2017 – 2022 (USD Million) 266

15.2.11. Argentina 267

15.2.12. Argentina Pharma R&D Outsourcing Market Revenue, By Type,

2017 – 2022 (USD Million) 267

15.2.13. Argentina Pharma R&D Outsourcing Market Revenue, By Therapy

Area, 2017 – 2022 (USD Million). 268

15.2.14. Argentina Pharma R&D Outsourcing Market Revenue, By End-user,

2017 – 2022 (USD Million) 269

15.2.15. Argentina Pharma R&D Outsourcing Market Revenue, By Function,

2017 – 2022 (USD Million) 270

15.2.16. Peru 271

GLOBAL PHARMA R&D OUTSOURCING MARKET, 2017 – 2030

20

15.2.17. Peru Pharma R&D Outsourcing Market Revenue, By Type, 2017 –

2022 (USD Million). 271

15.2.18. Peru Pharma R&D Outsourcing Market Revenue, By Therapy Area,

2017 – 2022 (USD Million) 272

15.2.19. Peru Pharma R&D Outsourcing Market Revenue, By End-user, 2017

– 2022 (USD Million). 273

15.2.20. Peru Pharma R&D Outsourcing Market Revenue, By Function, 2017

– 2022 (USD Million). 274

15.2.21. Chile . 275

15.2.22. Chile Pharma R&D Outsourcing Market Revenue, By Type, 2017 –

2022 (USD Million). 275

15.2.23. Chile Pharma R&D Outsourcing Market Revenue, By Therapy Area,

2017 – 2022 (USD Million) 276

15.2.24. Chile Pharma R&D Outsourcing Market Revenue, By End-user, 2017

– 2022 (USD Million). 277

15.2.25. Chile Pharma R&D Outsourcing Market Revenue, By Function, 2017

– 2022 (USD Million). 278

15.2.26. Colombia 279

15.2.27. Colombia Pharma R&D Outsourcing Market Revenue, By Type,

2017 – 2022 (USD Million) 279

15.2.28. Colombia Pharma R&D Outsourcing Market Revenue, By Therapy

Area, 2017 – 2022 (USD Million). 280

15.2.29. Colombia Pharma R&D Outsourcing Market Revenue, By End-user,

2017 – 2022 (USD Million) 281

15.2.30. Colombia Pharma R&D Outsourcing Market Revenue, By Function,

2017 – 2022 (USD Million) 282

15.2.31. Rest of Latin America 283

15.2.32. Rest of Latin America Pharma R&D Outsourcing Market Revenue,

By Type, 2017 – 2022 (USD Million) 283

15.2.33. Rest of Latin America Pharma R&D Outsourcing Market Revenue,

By Therapy Area, 2017 – 2022 (USD Million). 284

15.2.34. Rest of Latin America Pharma R&D Outsourcing Market Revenue,

By End-user, 2017 – 2022 (USD Million) 285

15.2.35. Rest of Latin America Pharma R&D Outsourcing Market Revenue,

By Function, 2017 – 2022 (USD Million) 286

CHAPTER NO. 16 : PHARMA R&D OUTSOURCING MARKET – MIDDLE EAST 287

16.1. The Middle-East. 287

16.2. Key Highlights 288

16.2.1. Middle East Pharma R&D Outsourcing Market Revenue, By Country, 2017

– 2022 (USD Million). 289

GLOBAL PHARMA R&D OUTSOURCING MARKET, 2017 – 2030

21

16.2.2. Middle East Pharma R&D Outsourcing Market Revenue, By Type, 2017 –

2022 (USD Million). 290

16.2.3. Middle East Pharma R&D Outsourcing Market Revenue, By Therapy Area,

2017 – 2022 (USD Million) 291

16.2.4. Middle East Pharma R&D Outsourcing Market Revenue, By End-user, 2017

– 2022 (USD Million). 292

16.2.5. Middle East Pharma R&D Outsourcing Market Revenue, By Function, 2017

– 2022 (USD Million). 293

16.2.6. UAE 294

16.2.7. UAE Pharma R&D Outsourcing Market Revenue, By Type, 2017 – 2022

(USD Million) . 294

16.2.8. UAE Pharma R&D Outsourcing Market Revenue, By Therapy Area, 2017 –

2022 (USD Million). 295

16.2.9. UAE Pharma R&D Outsourcing Market Revenue, By End-user, 2017 – 2022

(USD Million) . 296

16.2.10. UAE Pharma R&D Outsourcing Market Revenue, By Function, 2017

– 2022 (USD Million). 297

16.2.11. KSA. 298

16.2.12. KSA Pharma R&D Outsourcing Market Revenue, By Type, 2017 –

2022 (USD Million). 298

16.2.13. KSA Pharma R&D Outsourcing Market Revenue, By Therapy Area,

2017 – 2022 (USD Million) 299

16.2.14. KSA Pharma R&D Outsourcing Market Revenue, By End-user, 2017

– 2022 (USD Million). 300

16.2.15. KSA Pharma R&D Outsourcing Market Revenue, By Function, 2017 –

2022 (USD Million). 301

16.2.16. Israel 302

16.2.17. Israel Pharma R&D Outsourcing Market Revenue, By Type, 2017 –

2022 (USD Million). 302

16.2.18. Israel Pharma R&D Outsourcing Market Revenue, By Therapy Area,

2017 – 2022 (USD Million) 303

16.2.19. Israel Pharma R&D Outsourcing Market Revenue, By End-user,

2017 – 2022 (USD Million) 304

16.2.20. Israel Pharma R&D Outsourcing Market Revenue, By Function,

2017 – 2022 (USD Million) 305

16.2.21. Turkey 306

16.2.22. Turkey Pharma R&D Outsourcing Market Revenue, By Type, 2017 –

2022 (USD Million). 306

16.2.23. Turkey Pharma R&D Outsourcing Market Revenue, By Therapy

Area, 2017 – 2022 (USD Million). 307

GLOBAL PHARMA R&D OUTSOURCING MARKET, 2017 – 2030

22

16.2.24. Turkey Pharma R&D Outsourcing Market Revenue, By End-user,

2017 – 2022 (USD Million) 308

16.2.25. Turkey Pharma R&D Outsourcing Market Revenue, By Function,

2017 – 2022 (USD Million) 309

16.2.26. Iran. 310

16.2.27. Iran Pharma R&D Outsourcing Market Revenue, By Type, 2017 –

2022 (USD Million). 310

16.2.28. Iran Pharma R&D Outsourcing Market Revenue, By Therapy Area,

2017 – 2022 (USD Million) 311

16.2.29. Iran Pharma R&D Outsourcing Market Revenue, By End-user, 2017

– 2022 (USD Million). 312

16.2.30. Iran Pharma R&D Outsourcing Market Revenue, By Function, 2017

– 2022 (USD Million). 313

16.2.31. Rest of Middle East. 314

16.2.32. Rest of Middle East Pharma R&D Outsourcing Market Revenue, By

Type, 2017 – 2022 (USD Million). 314

16.2.33. Rest of Middle East Pharma R&D Outsourcing Market Revenue, By

Therapy Area, 2017 – 2022 (USD Million) . 315

16.2.34. Rest of Middle East Pharma R&D Outsourcing Market Revenue, By

End-user, 2017 – 2022 (USD Million). 316

16.2.35. Rest of Middle East Pharma R&D Outsourcing Market Revenue, By

Function, 2017 – 2022 (USD Million). 317

CHAPTER NO. 17 : PHARMA R&D OUTSOURCING MARKET – AFRICA 318

17.1. Africa 318

17.2. Key Highlights 319

17.2.1. Africa Pharma R&D Outsourcing Market Revenue, By Country, 2017 – 2022

(USD Million) . 320

17.2.2. Africa Pharma R&D Outsourcing Market Revenue, By Type, 2017 – 2022

(USD Million) . 321

17.2.3. Africa Pharma R&D Outsourcing Market Revenue, By Therapy Area, 2017 –

2022 (USD Million). 322

17.2.4. Africa Pharma R&D Outsourcing Market Revenue, By End-user, 2017 –

2022 (USD Million). 323

17.2.5. Africa Pharma R&D Outsourcing Market Revenue, By Function, 2017 –

2022 (USD Million). 324

17.2.6. South Africa. 325

17.2.7. South Africa Pharma R&D Outsourcing Market Revenue, By Type, 2017 –

2022 (USD Million). 325

17.2.8. South Africa Pharma R&D Outsourcing Market Revenue, By Therapy Area,

2017 – 2022 (USD Million) 326

GLOBAL PHARMA R&D OUTSOURCING MARKET, 2017 – 2030

23

17.2.9. South Africa Pharma R&D Outsourcing Market Revenue, By End-user,

2017 – 2022 (USD Million) 327

17.2.10. South Africa Pharma R&D Outsourcing Market Revenue, By

Function, 2017 – 2022 (USD Million). 328

17.2.11. Egypt 329

17.2.12. Egypt Pharma R&D Outsourcing Market Revenue, By Type, 2017 –

2022 (USD Million). 329

17.2.13. Egypt Pharma R&D Outsourcing Market Revenue, By Therapy Area,

2017 – 2022 (USD Million) 330

17.2.14. Egypt Pharma R&D Outsourcing Market Revenue, By End-user,

2017 – 2022 (USD Million) 331

17.2.15. Egypt Pharma R&D Outsourcing Market Revenue, By Function,

2017 – 2022 (USD Million) 332

17.2.16. Nigeria 333

17.2.17. Nigeria Pharma R&D Outsourcing Market Revenue, By Type, 2017 –

2022 (USD Million). 333

17.2.18. Nigeria Pharma R&D Outsourcing Market Revenue, By Therapy

Area, 2017 – 2022 (USD Million). 334

17.2.19. Nigeria Pharma R&D Outsourcing Market Revenue, By End-user,

2017 – 2022 (USD Million) 335

17.2.20. Nigeria Pharma R&D Outsourcing Market Revenue, By Function,

2017 – 2022 (USD Million) 336

17.2.21. Algeria 337

17.2.22. The East African Community (EAC) Pharma R&D Outsourcing

Market Revenue, By Type, 2017 – 2022 (USD Million). 337

17.2.23. Algeria Pharma R&D Outsourcing Market Revenue, By Therapy

Area, 2017 – 2022 (USD Million). 338

17.2.24. Algeria Pharma R&D Outsourcing Market Revenue, By End-user,

2017 – 2022 (USD Million) 339

17.2.25. Algeria Pharma R&D Outsourcing Market Revenue, By Function,

2017 – 2022 (USD Million) 340

17.2.26. Morocco . 341

17.2.27. Morocco Pharma R&D Outsourcing Market Revenue, By Type, 2017

– 2022 (USD Million). 341

17.2.28. Morocco Pharma R&D Outsourcing Market Revenue, By Therapy

Area, 2017 – 2022 (USD Million). 342

17.2.29. Morocco Pharma R&D Outsourcing Market Revenue, By End-user,

2017 – 2022 (USD Million) 343

17.2.30. Morocco Pharma R&D Outsourcing Market Revenue, By Function,

2017 – 2022 (USD Million) 344

17.2.31. Rest of Africa 345

GLOBAL PHARMA R&D OUTSOURCING MARKET, 2017 – 2030

24

17.2.32. Rest of Africa Pharma R&D Outsourcing Market Revenue, By Type,

2017 – 2022 (USD Million) 345

17.2.33. Rest of Africa Pharma R&D Outsourcing Market Revenue, By

Therapy Area, 2017 – 2022 (USD Million) . 346

17.2.34. Rest of Africa Pharma R&D Outsourcing Market Revenue, By End￾user, 2017 – 2022 (USD Million) 347

17.2.35. Rest of Africa Pharma R&D Outsourcing Market Revenue, By

Function, 2017 – 2022 (USD Million). 348

CHAPTER NO. 18 : COMPANY PROFILES . 349

18.1. Charles River Laboratories. 349

18.1.1. Company Overview 349

18.1.2. Product Portfolio . 350

18.1.3. Financial Overview. 350

18.2. ICON 351

18.2.1. Company Overview 351

18.2.2. Product Portfolio . 352

18.2.3. Financial Overview. 352

18.3. IQVIA 353

18.3.1. Company Overview 353

18.3.2. Product Portfolio . 354

18.3.3. Financial Overview. 354

18.4. Labcorp Drug Development. 355

18.4.1. Company Overview 355

18.4.2. 355

18.4.3. Product Portfolio . 356

18.4.4. Financial Overview. 356

18.5. Medpace 357

18.5.1. Company Overview 357

18.5.2. Product Portfolio . 358

18.5.3. Financial Overview. 358

18.6. Parexel International Corporation. 359

18.6.1. Company Overview 359

18.6.2. Product Portfolio . 360

18.6.3. Financial Overview. 360

18.7. Syneos Health 361

18.7.1. Company Overview 361

18.7.2. Product Portfolio . 361

18.7.3. Financial Overview. 362

18.8. Thermo Fisher Scientific 363

18.8.1. Company Overview 363

18.8.2. Product Portfolio . 364

18.8.3. Financial Overview. 364

18.9. Wuxi AppTec 365

18.9.1. Company Overview 365

18.9.2. Product Portfolio . 366

18.9.3. Financial Overview. 366

18.10. Lonza 367

18.10.1. Company Overview. 367

18.10.2. Product Portfolio 368

18.10.3. Financial Overview 368

18.11. Boehringer Ingelheim 369

18.11.1. Company Overview. 369

18.11.2. Product Portfolio 369

18.11.3. Financial Overview 370

18.12. Samsung Biologics . 371

18.12.1. Company Overview. 371

18.12.2. Product Portfolio 372

18.12.3. Financial Overview 372

18.13. AbbVie 373

18.13.1. Company Overview. 373

18.13.2. Product Portfolio 374

18.13.3. Financial Overview 374

18.14. Advanced Clinical. 375

18.14.1. Company Overview. 375

18.14.2. Product Portfolio 375

18.14.3. Financial Overview 376

18.15. BioAnalytix 377

18.15.1. Company Overview. 377

18.15.2. Product Portfolio 378

18.15.3. Financial Overview 378

18.16. Asymchem 379

18.16.1. Company Overview. 379

18.16.2. Product Portfolio 380

18.16.3. Financial Overview 380

18.17. Alcami 381

18.17.1. Company Overview. 381

18.17.2. Product Portfolio 381

18.17.3. Financial Overview 382

18.18. Catalent 383

18.18.1. Company Overview. 383

18.18.2. Product Portfolio 384

18.18.3. Financial Overview 384

18.19. Curia Global 385

18.19.1. Company Overview. 385

18.19.2. Product Portfolio 385

18.19.3. Financial Overview 386

18.20. ChemPartner 387

18.20.1. Company Overview. 387

18.20.2. Product Portfolio 388

18.20.3. Financial Overview 388

18.21. CMED 389

18.21.1. Company Overview. 389

18.21.2. Product Portfolio 389

18.21.3. Financial Overview 390

18.22. Criterium 391

18.22.1. Company Overview. 391

18.22.2. Product Portfolio 392

18.22.3. Financial Overview 392

18.23. Cromos Pharma . 393

18.23.1. Company Overview. 393

18.23.2. Product Portfolio 394

18.23.3. Financial Overview 394

18.24. Evotec 395

18.24.1. Company Overview. 395

18.24.2. Product Portfolio 396

18.24.3. Financial Overview 396

18.25. KBI Biopharma. 397

18.25.1. Company Overview. 397

GLOBAL PHARMA R&D OUTSOURCING MARKET, 2017 – 2030

27

18.25.2. Product Portfolio 397

18.25.3. Financial Overview 398

18.26. KCR S.A. 399

18.26.1. Company Overview. 399

18.26.2. Product Portfolio 400

18.26.3. Financial Overview 400

18.27. Kemwell Biopharma 401

18.27.1. Company Overview. 401

18.27.2. Product Portfolio 402

18.27.3. Financial Overview 402

18.28. Mesned Pharma Consult Center 403

18.28.1. Company Overview. 403

18.28.2. Product Portfolio 403

18.28.3. Financial Overview 404

18.29. Medelis 405

18.29.1. Company Overview. 405

18.29.2. Product Portfolio 405

18.29.3. Financial Overview 406

18.30. OCT Clinical 407

18.30.1. Company Overview. 407

18.30.2. Product Portfolio 408

18.30.3. Financial Overview 408

18.31. ProTrials Research . 409

18.31.1. Company Overview. 409

18.31.2. Product Portfolio 410

18.31.3. Financial Overview 410

18.32. PROMETRIKA 411

18.32.1. Company Overview. 411

18.32.2. Product Portfolio 411

18.32.3. Financial Overview 412

18.33. QPS 413

18.33.1. Company Overview. 413

18.33.2. Product Portfolio 414

18.33.3. Financial Overview 414

18.34. Singota Solutions. 415

18.34.1. Company Overview. 415

18.34.2. Product Portfolio 416

18.34.3. Financial Overview 416

18.35. Sofpromed 417

18.35.1. Company Overview. 417

18.35.2. Product Portfolio 417

18.35.3. Financial Overview 418

18.36. WuXi Biologics419

18.36.1. Company Overview. 419

18.36.2. Product Portfolio 420

18.36.3. Financial Overview 420

CHAPTER NO. 19 : RESEARCH METHODOLOGY 421

19.1. Research Methodology 421

19.2. Phase I – Secondary Research 422

19.3. Phase II – Data Modeling 422

19.3.1. Company Share Analysis Model . 423

19.3.2. Revenue Based Modeling. 423

19.4. Phase III – Primary Research 424

19.5. Research Limitations . 425

19.5.1. Assumptions 425

Frequently Asked Questions:

What is the current size of the global pharma R&D outsourcing market?

The global pharma R&D outsourcing market was valued at USD 70,289.04 Million in 2022.

What is the expected growth rate of the pharma R&D outsourcing market between 2023 and 2030?

The pharma R&D outsourcing market is expected to grow at a CAGR of 9.56% between 2023 and 2030, reaching USD 163,002.5 Million in 2030.

Which segment is leading the market share in terms of stage of development?

The clinical category had a significant proportion of roughly 64.13%.

Which company size segment governs the demand for pharma R&D outsourcing in the world?

Large companies segment is leading the market demand.

Which segment is expected to post the highest CAGR during the forecast period?

The biologics segment will likely exhibit the fastest CAGR during the forecast period.

Which region is fueling the growth of the pharma R&D outsourcing industry?

North America is the most important market for pharmaceutical R&D outsourcing, accounting for a sizable portion of the global market.

Who are the major players in the global pharma R&D outsourcing market?

The top players include Advanced Clinical, BioAnalytix, Asymchem and Alcam. Other major players include Curia Global, ChemPartner, CMED, Criterium and Cromos Pharma.

What are the major market drivers of the pharma R&D outsourcing industry?

Increased use of cloud computing and related software platforms in research and development, as well as Al’s appearance in drug discovery and development, are the major market drivers.

What are the major market restraints of the pharma R&D outsourcing industry?

Concerns over intellectual property, as well as the high cost and low success rate of pharmaceutical research and development are the major market restraints.

What are the major market opportunities of the pharma R&D outsourcing industry?

enture capitalist investments in the Life Sciences/Blotch Industry are increasing, as is access to specialized knowledge the major opportunity in the pharma R&D outsourcing industry.

Japan’s Pharmacy Automation Market

Published:
Report ID: 37511

Sterile Active Pharmaceutical Ingredient Market

Published:
Report ID: 37476

Organ Preservation Solutions Market

Published:
Report ID: 37472

Middle East and Africa Veterinary Vaccines Market

Published:
Report ID: 37309

Asia Pacific Stem Cell Therapy Market

Published:
Report ID: 37280

US Active Pharmaceutical Ingredient (API) Market

Published:
Report ID: 37221

Cancer Supportive Care Market

Published:
Report ID: 1901

Middle East and Africa Radiopharmaceuticals Market

Published:
Report ID: 37164

Temperature Controlled Pharma Packaging Solutions Market

Published:
Report ID: 20599

Vietnam Pneumococcal Vaccine Market

Published:
Report ID: 37015

Maternity and Nursing Bras Market

Published:
Report ID: 36899

Gene Therapy Market

Published:
Report ID: 36825

Purchase Options

$2999
Delivery Format: Excel.
$4999
Designed for the individual purchaser.
$6999
Users located at a single corporate site or regional office.
$7999
Allowed for unlimited sharing globally within one company.
Smallform of Sample request

Have a question?

User Profile

Don’t settle for less – trust Mitul to help you find the best solution.

Report delivery within 24 to 48 hours

– Other Info –

What people say?-

User Review

I am very impressed with the information in this report. The author clearly did their research when they came up with this product and it has already given me a lot of ideas.

Jana Schmidt
CEDAR CX Technologies

– Connect with us –

Phone

+91 6232 49 3207


support

24/7 Research Support


sales@credenceresearch.com

– Research Methodology –

Going beyond the basics: advanced techniques in research methodology

– Trusted By –

Pepshi, LG, Nestle
Motorola, Honeywell, Johnson and johnson
LG Chem, SIEMENS, Pfizer
Unilever, Samsonite, QIAGEN