Home » Information and Communications Technology » Technology & Media » Carbon Pricing Software Market

Carbon Pricing Software Market By Deployment Type (Cloud-Based, On-Premise); By Organization Size (Small and Medium Enterprises (SMEs), Large Enterprises); By Industry Vertical (Energy and Utilities, Manufacturing, Transportation and Logistics, IT and Telecom, Others) – Growth, Share, Opportunities & Competitive Analysis, 2024 – 2032

Price: $4699

Published: | Report ID: 115395 | Report Format : Excel, PDF

Market Overview:

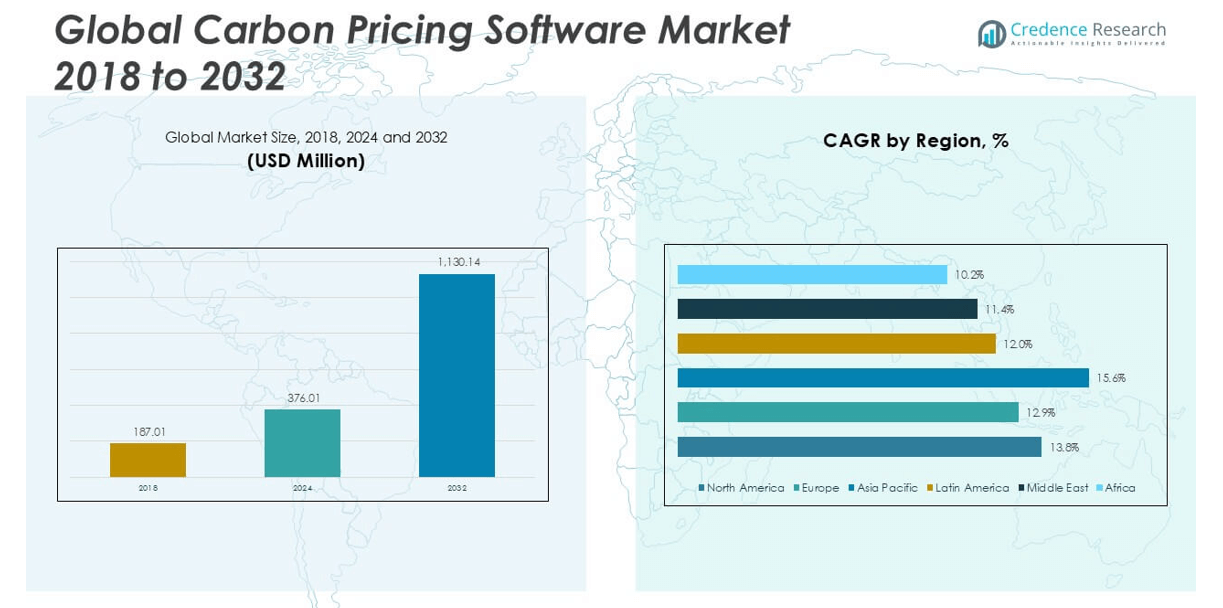
The Carbon Pricing Software market size was valued at USD 187.01 million in 2018, increased to USD 376.01 million in 2024, and is anticipated to reach USD 1,130.14 million by 2032, at a CAGR of 13.74% during the forecast period.

REPORT ATTRIBUTE DETAILS
Historical Period 2020-2023
Base Year 2024
Forecast Period 2025-2032
Carbon Pricing Software Market Size 2024 USD 376.01 million
Carbon Pricing Software Market, CAGR 13.74%
Carbon Pricing Software Market Size 2032 USD 1,130.14 million


The Carbon Pricing Software market is led by prominent players such as Microsoft, SAP SE, IBM, Salesforce, Sinai Technologies, Persefoni, Trucost, Atmosfair, KBC (Yokogawa Group), and Carbonstop. These companies offer advanced platforms for carbon accounting, scenario analysis, and regulatory compliance, addressing rising global demand for sustainability management. Microsoft and SAP SE dominate through integrated ESG solutions and strong enterprise client bases, while niche firms like Sinai Technologies and Persefoni provide specialized, AI-driven carbon pricing tools. Regionally, North America holds the largest market share at 42.4%, driven by strict environmental regulations and corporate sustainability initiatives. Europe and Asia Pacific follow, supported by robust climate policies and industrial decarbonization efforts.

Carbon Pricing Software Market size

Market Insights

  • The Carbon Pricing Software market was valued at USD 376.01 million in 2024 and is projected to reach USD 1,130.14 million by 2032, growing at a CAGR of 13.74% during the forecast period.
  • Market growth is primarily driven by rising regulatory pressure for carbon emissions reporting, growing adoption of internal carbon pricing, and increasing corporate commitments to sustainability and ESG frameworks.
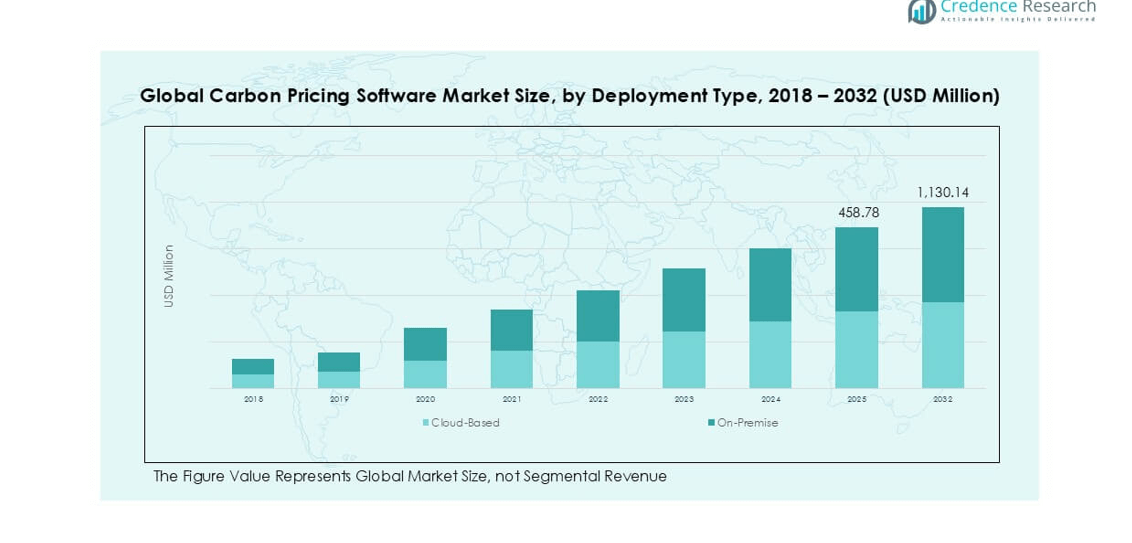
  • Key trends include integration of AI-powered analytics, cloud-based deployment dominance, and increasing adoption by large enterprises; the cloud-based segment held the largest share in 2024 due to its scalability and real-time data capabilities.
  • The competitive landscape is led by major players like Microsoft, SAP SE, IBM, Salesforce, Sinai Technologies, and Persefoni, who focus on platform innovation and partnerships to gain market share.
  • Regionally, North America accounted for 42.4%, followed by Europe (28.4%) and Asia Pacific (20.3%); energy and utilities remained the top contributing industry vertical in 2024.

Design Element 2

Access crucial information at unmatched prices!

Request your sample report today & start making informed decisions powered by Credence Research!

Download Sample

CTA Design Element 3

Market Segmentation Analysis:

By Deployment Type

The cloud-based segment dominates the Carbon Pricing Software market, accounting for the largest revenue share in 2024. This deployment type is preferred due to its scalability, remote accessibility, lower upfront costs, and ease of integration with other sustainability platforms. Cloud-based solutions also support real-time updates and facilitate compliance tracking, which is critical for organizations managing complex carbon accounting frameworks. In contrast, on-premise deployment is typically chosen by large enterprises with strict data security policies. However, its adoption remains limited due to higher infrastructure and maintenance costs.

  • For instance, Persefoni’s cloud-native platform is currently used by more than 500 companies globally, enabling automated carbon accounting across 280,000+ emissions data points per enterprise on average, significantly reducing manual reporting time.

By Organization Size

Large enterprises hold the dominant share in the Carbon Pricing Software market, driven by their ability to invest in advanced sustainability solutions and meet stringent regulatory requirements. These organizations often operate in multiple geographies and need comprehensive platforms to measure, report, and manage carbon emissions. Additionally, they face increased stakeholder pressure to implement carbon pricing strategies and report ESG performance. While SMEs are increasingly adopting carbon pricing tools, their growth is slower due to budget constraints and limited awareness, although cloud-based solutions are helping bridge this gap by offering affordable, scalable options.

  • For instance, Salesforce implemented its own internal carbon pricing system across 75 offices globally, using its Net Zero Cloud platform to track emissions data and engage over 30,000 employees in sustainability-driven decision-making.

By Industry Vertical

The energy and utilities sector leads the market by industry vertical, contributing the highest share in 2024 due to its high emission levels and regulatory scrutiny. This sector faces strong pressure to decarbonize operations and adhere to emission trading systems and carbon tax frameworks. Manufacturing follows closely, fueled by the need to optimize resource use and meet global sustainability standards. Transportation and logistics companies are also adopting carbon pricing tools to align with green supply chain initiatives. The IT and telecom sector, along with others like construction and retail, is gradually embracing such software to support internal ESG commitments.

Market Overview

Regulatory Pressure and Carbon Compliance Mandates

The increasing implementation of carbon taxes, emission trading schemes (ETS), and regulatory frameworks across regions is a major growth driver for carbon pricing software. Governments and international bodies are enforcing strict reporting and compliance standards, prompting enterprises to adopt digital tools to measure, manage, and reduce carbon footprints. This regulatory push has made carbon pricing software essential for businesses to avoid penalties, optimize costs, and align with sustainability goals, particularly in carbon-intensive industries like energy, manufacturing, and logistics.

  • For instance, Microsoft’s internal carbon fee model, introduced in 2012 and scaled company-wide, charges each business unit based on actual emissions data processed through its cloud platform resulting in an annual offset of over 16 million metric tons of CO₂e by 2023.

Rising Corporate Sustainability Goals and ESG Integration

Corporations are increasingly integrating environmental, social, and governance (ESG) frameworks into their operational strategies. This shift is fueled by investor expectations, brand reputation concerns, and stakeholder demands for transparency in emissions reporting. As a result, businesses are turning to carbon pricing software to quantify their carbon liabilities and align their strategies with science-based targets. These tools enable automated tracking, benchmarking, and real-time insights into carbon emissions, thereby facilitating responsible decision-making and enhancing long-term corporate sustainability performance.

  • For instance, SAP’s Environment Management software is actively used by over 1,100 companies globally, enabling integrated sustainability performance tracking aligned with 17 UN Sustainable Development Goals (SDGs) and ESG reporting standards.

Diital Transformation and Advancements in Data Analytics

The rapid adoption of digital technologies and big data analytics is driving demand for intelligent carbon pricing solutions. These platforms use AI and predictive analytics to simulate carbon pricing impacts, forecast liabilities, and offer actionable insights for emission reductions. Companies are increasingly leveraging these capabilities to improve cost-efficiency and operational planning. Cloud-based architecture and API integrations with ERP, IoT, and energy management systems are further streamlining data collection and enhancing the accuracy of carbon reporting, boosting adoption across sectors.

Key Trends & Opportunities

Integration with Broader Sustainability Platforms

A growing trend in the market is the integration of carbon pricing software with broader sustainability and ESG platforms. Organizations seek holistic tools that not only calculate carbon costs but also support energy efficiency planning, sustainability disclosures, and compliance audits. This integration presents an opportunity for software vendors to offer comprehensive environmental management solutions, improving customer value and competitiveness. As businesses consolidate their sustainability operations, demand for interoperable and modular carbon pricing systems is set to rise.

  • For instance, IBM’s Envizi ESG Suite integrates with over 500 data sources, streamlining emissions tracking and allowing users to consolidate ESG data across 40+ frameworks, including CDP, GRI, and TCFD, to ensure regulatory and investor transparency.

Growing Adoption by SMEs and Emerging Markets

Small and medium-sized enterprises (SMEs) and organizations in emerging economies are showing increasing interest in carbon pricing tools, driven by global supply chain pressures and export regulations. As multinational corporations require their partners to demonstrate sustainability efforts, SMEs are compelled to adopt such software. This trend opens significant growth potential for vendors offering affordable, cloud-based, and user-friendly solutions. Moreover, emerging markets present an untapped customer base as more governments introduce carbon control mechanisms and environmental incentives.

  • For instance, Carbonstop, China’s first carbon accounting software provider, has supported over 1,600 enterprises, including SMEs, in measuring and managing their emissions, and has calculated more than 150 million tons of carbon data across supply chains to date.

Key Challenges

Lack of Standardization and Market Fragmentation

One of the key challenges in the carbon pricing software market is the absence of universal standards for carbon accounting and pricing. Regional discrepancies in carbon tax rates, ETS designs, and reporting requirements make it difficult for software providers to offer standardized solutions. This fragmentation increases complexity for multinational organizations and hinders scalability. Vendors must constantly update their platforms to accommodate varying legal frameworks, which can slow product development and increase operational costs.

Limited Awareness and Technical Expertise

Despite growing interest, many organizations—particularly SMEs—lack awareness and technical knowledge about carbon pricing mechanisms and the value of related software tools. This knowledge gap results in slower adoption rates, especially in sectors that are not yet heavily regulated. Furthermore, internal teams often lack the training or resources needed to effectively utilize these tools, making implementation and ROI realization more difficult. Bridging this awareness and skills gap remains a critical barrier to market expansion.

Data Quality and Integration Challenges

Accurate carbon pricing relies on comprehensive and high-quality emissions data, which many organizations struggle to collect and standardize. Integrating disparate data sources, such as utility bills, transportation logs, and production metrics, into one cohesive system can be technically demanding. Inconsistent data formats and legacy systems further hinder real-time reporting and analytics. Ensuring data accuracy, transparency, and traceability is essential for generating reliable carbon cost insights, yet remains a persistent operational challenge across industries.

Regional Analysis

North America

North America held the largest share of the Carbon Pricing Software market in 2024, accounting for approximately 42.4% of global revenue. The market grew from USD 80.11 million in 2018 to USD 159.36 million in 2024 and is projected to reach USD 480.32 million by 2032, registering a CAGR of 13.8%. This robust growth is driven by strong regulatory frameworks, the presence of carbon markets like California’s Cap-and-Trade Program, and increasing corporate investments in ESG compliance. The U.S. and Canada are at the forefront of adopting advanced carbon pricing platforms to meet both federal and state-level environmental mandates.

Europe

Europe represented around 28.4% of the global Carbon Pricing Software market in 2024, rising from USD 54.90 million in 2018 to USD 106.54 million in 2024, with a projected value of USD 302.12 million by 2032. The region is growing at a CAGR of 12.9%, primarily fueled by the European Union Emissions Trading System (EU ETS) and stringent sustainability regulations across member countries. Businesses across Germany, France, and the Nordics are heavily investing in digital tools to manage their carbon liabilities, reflecting the region’s commitment to climate neutrality and enhanced environmental accountability.

Asia Pacific

The Asia Pacific region is the fastest-growing market for Carbon Pricing Software, expanding at a CAGR of 15.6% and capturing about 20.3% of the global market share in 2024. The market size rose from USD 35.06 million in 2018 to USD 76.55 million in 2024, and is expected to reach USD 261.32 million by 2032. Growth is driven by industrial expansion, government-led carbon policies in China and South Korea, and increasing awareness of sustainable practices in India and Southeast Asia. Regional companies are increasingly adopting carbon management platforms to align with global sustainability standards and export requirements.

Latin America

Latin America accounted for approximately 4.8% of the global Carbon Pricing Software market in 2024, growing from USD 9.02 million in 2018 to USD 17.91 million in 2024 and expected to reach USD 47.79 million by 2032. The market is witnessing a CAGR of 12.0%, supported by growing participation in international climate frameworks and voluntary carbon markets. Countries such as Brazil and Chile are introducing carbon pricing mechanisms and encouraging corporate environmental disclosures. However, limited digital infrastructure and regulatory maturity continue to challenge widespread adoption across the region.

Middle East

The Middle East captured 2.6% of the global Carbon Pricing Software market in 2024, with the market size increasing from USD 5.28 million in 2018 to USD 9.71 million in 2024 and projected to reach USD 24.66 million by 2032. The region is growing at a CAGR of 11.4%, largely driven by the UAE and Saudi Arabia’s strategic push toward carbon neutrality and economic diversification. While adoption is currently modest, government-led initiatives to reduce oil dependency and improve environmental governance are creating opportunities for digital carbon management solutions across sectors like energy, construction, and manufacturing.

Africa

Africa held the smallest market share of 1.6% in the global Carbon Pricing Software market in 2024, with the market expanding from USD 2.65 million in 2018 to USD 5.94 million in 2024 and forecasted to reach USD 13.93 million by 2032. Growing at a CAGR of 10.2%, the region shows gradual progress, primarily supported by international climate funding and green development initiatives. South Africa, being the most advanced in carbon taxation, leads adoption, while other countries lag due to limited regulatory structures and digital readiness. Nonetheless, long-term opportunities exist as environmental awareness and policy frameworks evolve.

Carbon Pricing Software Market share

Market Segmentations:

By Deployment Type

  • Cloud-Based
  • On-Premise

By Organization Size

  • Small and Medium Enterprises (SMEs)
  • Large Enterprises

By Industry Vertical

  • Energy and Utilities
  • Manufacturing
  • Transportation and Logistics
  • IT and Telecom
  • Others

By Geography

  • North America
    • U.S.
    • Canada
    • Mexico
  • Europe
    • Germany
    • France
    • U.K.
    • Italy
    • Spain
    • Rest of Europe
  • Asia Pacific
    • China
    • Japan
    • India
    • South Korea
    • South-east Asia
    • Rest of Asia Pacific
  • Latin America
    • Brazil
    • Argentina
    • Rest of Latin America
  • Middle East & Africa
    • GCC Countries
    • South Africa
    • Rest of the Middle East and Africa

Competitive Landscape

The competitive landscape of the Carbon Pricing Software market is characterized by the presence of both established technology firms and emerging sustainability-focused startups. Key players such as Microsoft, SAP SE, IBM, and Salesforce leverage their broad enterprise software capabilities and cloud infrastructure to offer integrated carbon management solutions. Meanwhile, specialized providers like Sinai Technologies, Persefoni, and Carbonstop are gaining traction by offering tailored platforms with advanced analytics, compliance tracking, and scenario modeling tools specifically designed for carbon pricing and sustainability reporting. Companies are increasingly focusing on product innovation, partnerships, and strategic acquisitions to enhance their service offerings and expand geographic reach. For instance, vendors are integrating AI and machine learning to provide predictive insights and real-time data visualization, enhancing decision-making for emission reduction strategies. As regulatory pressures and ESG mandates intensify, competition is expected to grow, with firms striving to differentiate through technological innovation, industry-specific solutions, and robust customer support.

Shape Your Report to Specific Countries or Regions & Enjoy 30% Off!

Key Player Analysis

  • Sinai Technologies
  • Trucost
  • Microsoft
  • SAP SE
  • Atmosfair
  • KBC (Yokogawa Group)
  • Carbonstop
  • IBM
  • Salesforce
  • Persefoni

Recent Developments

  • In June 2025, Atmosfair remains committed to project integrity, with 90% of its offsets meeting the strict CDM Gold Standard certification. While there are no major software launches, they maintain high standards for digital offset and reporting.
  • In June 2024, Yokogawa’s Visual MESA Greenhouse Gas Emissions Management (VM-GEM) software was validated for its ability to monitor, manage, and audit Scope 1, 2, and 3 emissions, using a digital twin approach for documented decarbonization pathways.
  • In May 2024, KBC released Petro-SIM 7.5, a simulation software that includes a Real-Time Optimization (RTO) solution to enhance production, energy efficiency, and emissions reduction. This update focuses on asset performance, sustainability, and profitability by incorporating features like emissions inventory management, green hydrogen simulation, and environmental compliance tools.

Market Concentration & Characteristics

The Carbon Pricing Software Market exhibits moderate to high market concentration, with a mix of established technology firms and specialized sustainability software providers. Major players such as Microsoft, SAP SE, IBM, and Salesforce hold a significant share due to their extensive cloud infrastructure, enterprise customer base, and integrated ESG capabilities. Niche firms like Sinai Technologies, Persefoni, and Carbonstop contribute to innovation by offering tailored solutions focused on carbon accounting and pricing strategy. The market demonstrates a strong preference for cloud-based deployment, driven by ease of integration, scalability, and real-time access to emission data. It is characterized by rapid technological advancement, strong regulatory influence, and increasing demand for automation in sustainability reporting. Vendor competition centers on features like real-time analytics, compliance support, and predictive modeling. Large enterprises dominate adoption due to complex compliance needs, while SMEs show growing interest due to accessible cloud solutions. The market favors providers offering customizable, region-compliant platforms with seamless data integration.

Report Coverage

The research report offers an in-depth analysis based on Deployment Type, Organization Size, Industry Vertical and Geography. It details leading market players, providing an overview of their business, product offerings, investments, revenue streams, and key applications. Additionally, the report includes insights into the competitive environment, SWOT analysis, current market trends, as well as the primary drivers and constraints. Furthermore, it discusses various factors that have driven market expansion in recent years. The report also explores market dynamics, regulatory scenarios, and technological advancements that are shaping the industry. It assesses the impact of external factors and global economic changes on market growth. Lastly, it provides strategic recommendations for new entrants and established companies to navigate the complexities of the market.

Future Outlook

  1. The market is expected to witness sustained growth driven by global carbon neutrality commitments and expanding climate regulations.
  2. Demand for cloud-based carbon pricing platforms will continue to rise due to scalability and lower infrastructure costs.
  3. Integration of AI and machine learning will enhance real-time monitoring, predictive analytics, and scenario modeling capabilities.
  4. Adoption among small and medium enterprises is projected to increase as affordable and user-friendly solutions become more accessible.
  5. Industry-specific carbon pricing tools will gain traction, especially in energy, manufacturing, and logistics sectors.
  6. Regional markets in Asia Pacific and Latin America are likely to experience accelerated growth due to emerging regulatory frameworks.
  7. Increased investor and stakeholder pressure will push more companies to adopt transparent carbon pricing strategies.
  8. Software providers will focus on expanding service portfolios through acquisitions, partnerships, and technological innovation.
  9. Interoperability with ESG reporting systems and sustainability platforms will become a key differentiator.
  10. Market competition will intensify, with vendors offering end-to-end compliance, cost optimization, and carbon risk assessment features.

CHAPTER NO. 1: GENESIS OF THE MARKET

1.1 Market Prelude – Introduction & Scope

1.2 The Big Picture – Objectives & Vision

1.3 Strategic Edge – Unique Value Proposition

1.4 Stakeholder Compass – Key Beneficiaries

CHAPTER NO. 2: EXECUTIVE LENS

2.1 Pulse of the Industry – Market Snapshot

2.2 Growth Arc – Revenue Projections (USD Million)

2.3. Premium Insights – Based on Primary Interviews

CHAPTER NO. 3: CARBON PRICING SOFTWARE MARKET FORCES & INDUSTRY PULSE

3.1 Foundations of Change – Market Overview
3.2 Catalysts of Expansion – Key Market Drivers
3.2.1 Momentum Boosters – Growth Triggers
3.2.2 Innovation Fuel – Disruptive Technologies
3.3 Headwinds & Crosswinds – Market Restraints
3.3.1 Regulatory Tides – Compliance Challenges
3.3.2 Economic Frictions – Inflationary Pressures
3.4 Untapped Horizons – Growth Potential & Opportunities
3.5 Strategic Navigation – Industry Frameworks
3.5.1 Market Equilibrium – Porter’s Five Forces
3.5.2 Ecosystem Dynamics – Value Chain Analysis
3.5.3 Macro Forces – PESTEL Breakdown

3.6 Price Trend Analysis

    3.6.1 Regional Price Trend
3.6.2 Price Trend by Service

CHAPTER NO. 4: KEY INVESTMENT EPICENTER         

4.1 Regional Goldmines – High-Growth Geographies

4.2 Service Frontiers – Lucrative Service Categories

4.3 Application Sweet Spots – Emerging Demand Segments

CHAPTER NO. 5: REVENUE TRAJECTORY & WEALTH MAPPING

5.1 Momentum Metrics – Forecast & Growth Curves

5.2 Regional Revenue Footprint – Market Share Insights

5.3 Segmental Wealth Flow – Deployment Type & Industry Vertical Revenue

CHAPTER NO. 6: TRADE & COMMERCE ANALYSIS     

6.1.      Import Analysis by Region

6.1.1.    Global Carbon Pricing Software Import Revenue By Region

6.2.      Export Analysis by Region

6.2.1.    Global Carbon Pricing Software Export Revenue By Region

CHAPTER NO. 7: COMPETITION ANALYSIS       

7.1.      Company Market Share Analysis

7.1.1.    Global Carbon Pricing Software: Company Market Share

7.2.      Global Carbon Pricing Software Company Revenue Market Share

7.3.      Strategic Developments

7.3.1.    Acquisitions & Mergers

7.3.2.    New Service Launch

7.3.3.    Regional Expansion

7.4.    Competitive Dashboard

7.5.    Company Assessment Metrics, 2024

CHAPTER NO. 8: CARBON PRICING SOFTWARE MARKET – BY DEPLOYMENT TYPE SEGMENT ANALYSIS

8.1.      Carbon Pricing Software Overview by Deployment Type Segment

8.1.1.    Carbon Pricing Software Revenue Share By Deployment Type

8.2.      Cloud-Based

8.3.      On-Premise

CHAPTER NO. 9: CARBON PRICING SOFTWARE MARKET – BY ORGANIZATION SIZE SEGMENT ANALYSIS

9.1.      Carbon Pricing Software Overview by Organization Size Segment

9.1.1.    Carbon Pricing Software Revenue Share By Organization Size

9.2.      Small and Medium Enterprises (SMEs)

9.3.      Large Enterprises

CHAPTER NO. 10: CARBON PRICING SOFTWARE MARKET – BY INDUSTRY VERTICAL SEGMENT ANALYSIS

10.1.     Carbon Pricing Software Overview by Industry Vertical Segment

10.1.1.  Carbon Pricing Software Revenue Share By Industry Vertical

10.2.     Energy and Utilities

10.3.     Manufacturing

10.4.     Transportation and Logistics

10.5.     IT and Telecom

10.6.     Others

CHAPTER NO. 11: CARBON PRICING SOFTWARE MARKET – REGIONAL ANALYSIS

11.1.     Carbon Pricing Software Overview by Region Segment

11.1.1.  Global Carbon Pricing Software Revenue Share By Region

11.1.2.  Regions

11.1.3.  Global Carbon Pricing Software Revenue By Region

11.1.4. Deployment Type

11.1.5.  Global Carbon Pricing Software Revenue By Deployment Type

11.1.6.  Organization Size

11.1.7. Global Carbon Pricing Software Revenue By Organization Size

11.1.8. Industry Vertical

11.1.9. Global Carbon Pricing Software Revenue By Industry Vertical

CHAPTER NO. 12: NORTH AMERICA CARBON PRICING SOFTWARE MARKET – COUNTRY ANALYSIS

12.1.     North America Carbon Pricing Software Overview by Country Segment

12.1.1.  North America Carbon Pricing Software Revenue Share By Region

12.2.     North America

12.2.1.  North America Carbon Pricing Software Revenue By Country

12.2.2.  Deployment Type

12.2.3.  North America Carbon Pricing Software Revenue By Deployment Type

12.2.4.  Organization Size

12.2.5.  North America Carbon Pricing Software Revenue By Organization Size

12.2.6.  Industry Vertical

12.2.7.  North America Carbon Pricing Software Revenue By Industry Vertical

2.3.      U.S.

12.4.     Canada

12.5.     Mexico

CHAPTER NO. 13: EUROPE CARBON PRICING SOFTWARE MARKET – COUNTRY ANALYSIS

13.1.     Europe Carbon Pricing Software Overview by Country Segment

13.1.1.  Europe Carbon Pricing Software Revenue Share By Region

13.2.     Europe

13.2.1.  Europe Carbon Pricing Software Revenue By Country

13.2.2.  Deployment Type

13.2.3.  Europe Carbon Pricing Software Revenue By Deployment Type

13.2.4.  Organization Size

13.2.5.  Europe Carbon Pricing Software Revenue By Organization Size

13.2.6.  Industry Vertical

13.2.7.  Europe Carbon Pricing Software Revenue By Industry Vertical

13.3.     UK

13.4.     France

13.5.     Germany

13.6.     Italy

13.7.     Spain

13.8.     Russia

13.9.   Rest of Europe

CHAPTER NO. 14: ASIA PACIFIC CARBON PRICING SOFTWARE MARKET – COUNTRY ANALYSIS

14.1.     Asia Pacific Carbon Pricing Software Overview by Country Segment

14.1.1.  Asia Pacific Carbon Pricing Software Revenue Share By Region

14.2.     Asia Pacific

14.2.1.  Asia Pacific Carbon Pricing Software Revenue By Country

14.2.2.  Deployment Type

14.2.3.  Asia Pacific Carbon Pricing Software Revenue By Deployment Type

14.2.4.  Organization Size

14.2.5.  Asia Pacific Carbon Pricing Software Revenue By Organization Size

14.2.5.  Industry Vertical

14.2.7.  Asia Pacific Carbon Pricing Software Revenue By Industry Vertical

14.3.     China

14.4.     Japan

14.5.     South Korea

14.6.     India

14.7.     Australia

14.8.     Southeast Asia

14.9.     Rest of Asia Pacific

CHAPTER NO. 15: LATIN AMERICA CARBON PRICING SOFTWARE MARKET – COUNTRY ANALYSIS

15.1.     Latin America Carbon Pricing Software Overview by Country Segment

15.1.1.  Latin America Carbon Pricing Software Revenue Share By Region

15.2.     Latin America

15.2.1.  Latin America Carbon Pricing Software Revenue By Country

15.2.2.  Deployment Type

15.2.3.  Latin America Carbon Pricing Software Revenue By Deployment Type

15.2.4.  Organization Size

15.2.5.  Latin America Carbon Pricing Software Revenue By Organization Size

15.2.6.  Industry Vertical

15.2.7.  Latin America Carbon Pricing Software Revenue By Industry Vertical

15.3.     Brazil

15.4.     Argentina

15.5.     Rest of Latin America

CHAPTER NO. 16: MIDDLE EAST CARBON PRICING SOFTWARE MARKET – COUNTRY ANALYSIS

16.1.     Middle East Carbon Pricing Software Overview by Country Segment

16.1.1.  Middle East Carbon Pricing Software Revenue Share By Region

16.2.     Middle East

16.2.1.  Middle East Carbon Pricing Software Revenue By Country

16.2.2.  Deployment Type

16.2.3.  Middle East Carbon Pricing Software Revenue By Deployment Type

16.2.4.  Organization Size

16.2.5.  Middle East Carbon Pricing Software Revenue By Organization Size

16.2.6.  Industry Vertical

16.2.7.  Middle East Carbon Pricing Software Revenue By Industry Vertical

16.3.     GCC Countries

16.4.     Israel

16.5.     Turkey

16.6.     Rest of Middle East

CHAPTER NO. 17: AFRICA CARBON PRICING SOFTWARE MARKET – COUNTRY ANALYSIS

17.1.     Africa Carbon Pricing Software Overview by Country Segment

17.1.1.  Africa Carbon Pricing Software Revenue Share By Region

17.2.     Africa

17.2.1.  Africa Carbon Pricing Software Revenue By Country

17.2.2.  Deployment Type

17.2.3.  Africa Carbon Pricing Software Revenue By Deployment Type

17.2.4.  Organization Size

17.2.5.  Africa Carbon Pricing Software Revenue By Organization Size

17.2.6.  Industry Vertical

17.2.7.  Africa Carbon Pricing Software Revenue By Industry Vertical

17.3.     South Africa

17.4.     Egypt

17.5.     Rest of Africa

CHAPTER NO. 18: COMPANY PROFILES 

18.1.     Sinai Technologies

18.1.1.  Company Overview

18.1.2.  Service Portfolio

18.1.3.  Financial Overview

18.1.4.  Recent Developments

18.1.5.  Growth Strategy

18.1.6.  SWOT Analysis

18.2.     Trucost

18.3.     Microsoft

18.4.     SAP SE

18.5.     Atmosfair

18.6.     KBC (Yokogawa Group)

18.7.     Carbonstop

18.8.     IBM

18.9.     Salesforce

18.10.   Persefoni

Frequently Asked Questions

What is the current market size for Carbon Pricing Software, and what is its projected size in 2032?

The Carbon Pricing Software market was valued at USD 376.01 million in 2024 and is expected to reach USD 1,130.14 million by 2032, reflecting strong growth in sustainability adoption across industries.

What are the primary factors fueling the growth of the Carbon Pricing Software market?

Key drivers include regulatory carbon mandates, growing corporate ESG goals, digital transformation, AI-powered analytics, and increasing adoption by SMEs and emerging economies.

Who are the leading companies in the Carbon Pricing Software market?

Top players include Microsoft, SAP SE, IBM, Salesforce, Sinai Technologies, Persefoni, Trucost, Atmosfair, KBC (Yokogawa Group), and Carbonstop, offering platforms for carbon accounting, scenario modeling, and compliance.

Which region commanded the largest share of the Carbon Pricing Software market in 2024?

North America led the market with a 42.4% share in 2024, driven by strict environmental regulations, ESG investments, and early technology adoption in the U.S. and Canada.

About Author

Sushant Phapale

Sushant Phapale

ICT & Automation Expert

Sushant is an expert in ICT, automation, and electronics with a passion for innovation and market trends.

View Profile

Gunakesh Parmar

Reviewed By
Gunakesh Parmar

Research Consultant

With over 15 years of dedicated experience in market research since 2009, specializes in delivering actionable insights from data.

View Profile

Carbon Tapes Market

Published:
Report ID: 115738

Carbon Footprint Reduction Market

Published:
Report ID: 115443

Carbon Steel Market

Published:
Report ID: 115401

Carbon Capture and Storage Market

Published:
Report ID: 19306

Activated Carbon Fiber Market

Published:
Report ID: 104626

Carbon Footprint Audit Market

Published:
Report ID: 114467

Lignin‑Derived Carbon Materials Market

Published:
Report ID: 113920

Aseptic Packaging for Non-Carbonated Beverages Market

Published:
Report ID: 111948

Carbon Fiber Reinforced Thermoplastic Plastic Market

Published:
Report ID: 85329

Data Center Immersion Cooling Market

Published:
Report ID: 115743

Stationary Catalytic Systems Market

Published:
Report ID: 115653

Packaged Air Conditioning System Market

Published:
Report ID: 115460

Thin Client Market

Published:
Report ID: 115386

Thermostat Market

Published:
Report ID: 115377

Access Control Reader Market

Published:
Report ID: 115251

Immersive Analytics Market

Published:
Report ID: 115021

Digital Diabetes Management Market

Published:
Report ID: 114987

Diabetes Management Apps Market

Published:
Report ID: 114981

AC Microgrid Market

Published:
Report ID: 114955

Omni-channel Retail Solutions Market

Published:
Report ID: 114578

Industry 5.0 Market

Published:
Report ID: 114262

Purchase Options

The report comes as a view-only PDF document, optimized for individual clients. This version is recommended for personal digital use and does not allow printing.
$4699

To meet the needs of modern corporate teams, our report comes in two formats: a printable PDF and a data-rich Excel sheet. This package is optimized for internal analysis and multi-location access, making it an excellent choice for organizations with distributed workforce.
$5699

The report will be delivered in printable PDF format along with the report’s data Excel sheet. This license offers 100 Free Analyst hours where the client can utilize Credence Research Inc.’s research team. It is highly recommended for organizations seeking to execute short, customized research projects related to the scope of the purchased report.
$12699

Credence Staff 3

WILLIAM, North America

Support Staff at Credence Research

KEITH PHILLIPS, Europe

Lee - CR Sales Staff

LEE VALLANCE, Asia Pacific

Kieran Jameson

KIERAN JAMESON, Australia

Smallform of Sample request

Report delivery within 24 to 48 hours

What people say?-

User Review

I am very impressed with the information in this report. The author clearly did their research when they came up with this product and it has already given me a lot of ideas.

Jana Schmidt
CEDAR CX Technologies

– Connect with us –


support

24/7 Research Support


– Research Methodology –

Going beyond the basics: advanced techniques in research methodology

Pepshi, LG, Nestle
Motorola, Honeywell, Johnson and johnson
LG Chem, SIEMENS, Pfizer
Unilever, Samsonite, QIAGEN

Request Sample