Market Overview
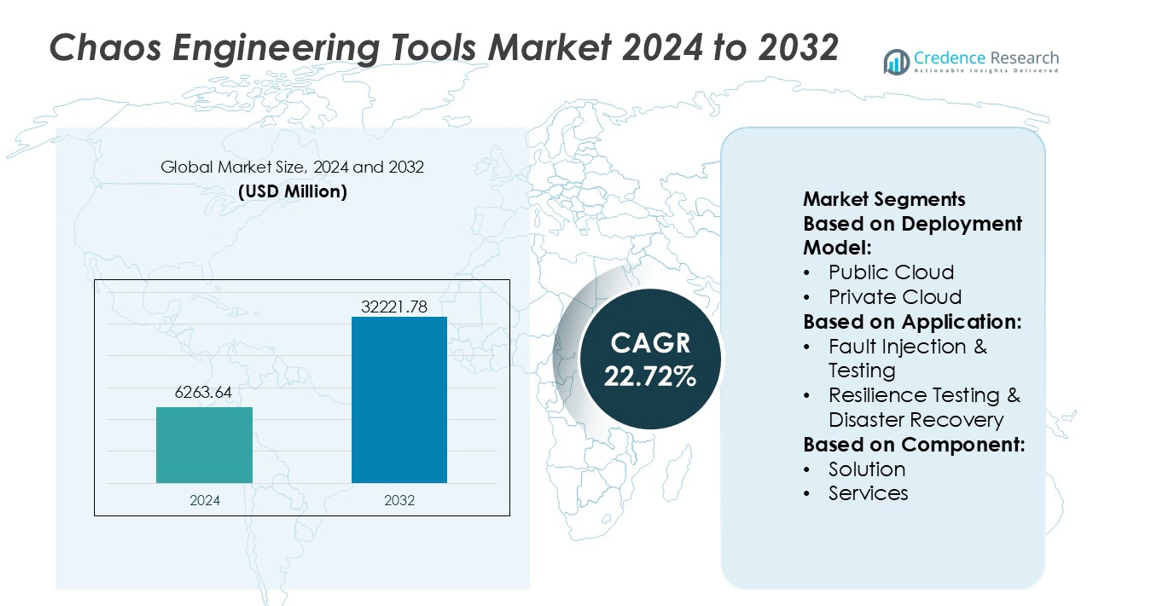
Chaos Engineering Tools Market size was valued USD 6263.64 million in 2024 and is anticipated to reach USD 32221.78 million by 2032, at a CAGR of 22.72% during the forecast period.
| REPORT ATTRIBUTE |
DETAILS |
| Historical Period |
2020-2023 |
| Base Year |
2024 |
| Forecast Period |
2025-2032 |
| Chaos Engineering Tools Market Size 2024 |
USD 6263.64 million |
| Chaos Engineering Tools Market, CAGR |
22.72% |
| Chaos Engineering Tools Market Size 2032 |
USD 32221.78 million |
The Chaos Engineering Tools Market includes major technology providers that offer automated failure injection, observability integration, and resilience validation across distributed systems. These vendors focus on cloud-native platforms, AI-driven fault analysis, and real-time monitoring to help enterprises prevent downtime and maintain continuous service availability. Advanced solutions support microservices, Kubernetes orchestration, multi-region failover testing, and security resilience simulations. North America leads the market with 37% share, supported by strong DevOps maturity, high cloud adoption, and widespread use of SRE frameworks across fintech, telecom, e-commerce, and SaaS environments. Continuous product innovation, integration with CI/CD pipelines, and demand for uptime assurance strengthen the region’s dominant position.
Market Insights
- The Chaos Engineering Tools Market was valued at USD 6263.64 million in 2024 and will reach USD 32221.78 million by 2032 at a CAGR of 22.72%.
- Growing adoption of microservices, Kubernetes, and distributed cloud environments drives demand for automated fault injection, performance testing, and multi-region failover validation.
- Vendors focus on AI-driven diagnostics, observability integration, and CI/CD compatibility to enhance reliability, reduce outage risks, and offer competitive product differentiation.
- Skill gaps and concerns over production risk limit adoption in risk-averse enterprises, but managed services and guided experiment libraries help reduce barriers.
- North America leads with 37% market share due to strong DevOps maturity, while Public Cloud holds the dominant segment share because of fast deployment and scalable testing environments.
Access crucial information at unmatched prices!
Request your sample report today & start making informed decisions powered by Credence Research Inc.!
Download Sample
Market Segmentation Analysis:
By Deployment Model
Public Cloud leads the deployment model with close to 64% share due to easy setup, flexible scaling, and faster execution of chaos experiments. Many DevOps teams prefer cloud-native platforms because they integrate with CI/CD pipelines and container orchestration tools. Public Cloud solutions also support distributed environments and simulate real-world faults across microservices, APIs, and load balancers. Private Cloud adoption grows in regulated industries where data control and compliance are critical. Enterprises that run sensitive workloads choose on-premise chaos frameworks to maintain security policies and limit external exposure.
- For instance, 3D Systems Inc. operates its cloud-connected On Demand Manufacturing platform that has produced more than 1,000,000 industrial parts, and the system manages over 500 qualified material options while using remote monitoring across multiple data centers to maintain uptime.
By Application
Fault Injection & Testing holds the dominant share at roughly 41%, supported by high usage in microservice-based architectures. Developers run controlled failure simulations to expose weaknesses in dependencies, service communication, and API response behavior before going live. Resilience Testing & Disaster Recovery grows as firms use chaos experiments to validate backup systems and multi-region failover strategies. Security Resilience Testing increases with ransomware risks and API-layer attacks. Performance & Scalability Testing supports peak-load events in e-commerce, streaming, fintech, and telecom networks, ensuring consistent response times under traffic spikes.
- For instance, Bentley Systems reports that its digital-twin solution for telecom towers under its OpenTower iQ platform has already been deployed to digitize more than 25,000 cell towers in the United States, leveraging drone imaging, IoT sensor data, and AI/ML workflows in the iTwin Platform environment.
By Component
Solution segment remains dominant with around 67% share, driven by demand for automated platforms that orchestrate fault injection, observability, and reporting. Companies select ready-to-deploy tools that integrate with Kubernetes, Prometheus, Grafana, and major cloud services. These platforms help teams run repeatable experiments and visualize system behavior in real time. Services grow as enterprises need consulting, custom experiment design, managed chaos operations, and training. Vendors offer workshops, readiness assessments, and SRE-focused support to improve reliability practices across large distributed environments.
Key Growth Drivers
Rising Adoption of Microservices and Cloud-Native Architectures
The shift from monolithic systems to microservices increases failure points across APIs, containers, and distributed workloads. Chaos engineering tools help engineering teams test real-time resilience by injecting controlled faults into Kubernetes clusters, load balancers, and service communications. Companies adopt these platforms to validate uptime commitments, reduce production outages, and improve user experience. As cloud-native adoption accelerates in banking, media, and commerce, demand for automated chaos experiments grows. Organizations also use these tools to verify autoscaling, failover paths, and zero-downtime releases across hybrid and multi-cloud setups.
- For instance, Mastercam is the most widely used CAD/CAM software worldwide, supporting automation across over 300,000 licensed seats. It integrates with more than 3,000 certified post-processors and includes robust simulation tools that enable users to validate toolpaths and detect potential errors before jobs reach the CNC machines.
Growing Emphasis on Service Reliability and SLA Compliance
Businesses treat downtime as a financial and reputational risk, especially in fintech, e-commerce, telecom, and SaaS platforms. Chaos engineering supports reliability goals by exposing hidden infrastructure weaknesses before customers experience an outage. Firms use experiments to test database failover, network latency, packet loss, and service throttling scenarios. Teams also prefer tools with real-time observability, allowing them to track system health across nodes and regions. As service-level agreements tighten and user traffic becomes unpredictable, organizations invest in automated reliability tooling to reduce operational disruptions.
- For instance, Vuforia Engine platform has supported over 1.5 million developers creating augmented-reality solutions, with a newly released Enterprise Plan enabling unlimited target generations and on-premises advanced model-target support.
Increasing DevOps and SRE Adoption Across Large Enterprises
Enterprises strengthen DevOps and SRE practices to improve performance, security, and release cycles. Chaos engineering becomes a core part of reliability testing, alongside CI/CD and monitoring frameworks. Engineering teams use fault-injection workflows to validate rollback procedures, backup systems, and auto-remediation scripts. Vendors provide integration with Kubernetes, Prometheus, Grafana, and major cloud platforms, making it easier to run simulations in production-like environments. As companies replace manual failure testing with automation, chaos platforms gain traction for faster root cause analysis and continuous resilience improvement.
Key Trends & Opportunities
Growth of AI-Driven Experimentation and Self-Healing Systems
Vendors integrate machine learning into chaos tools to predict the safest failure conditions and recommend test scopes. AI-based platforms learn from past experiments and highlight components most likely to break under stress. This supports autonomous remediation where systems auto-correct issues without human intervention. The trend benefits industries with large distributed systems such as cloud providers, streaming services, telecom networks, and fintech workloads. Automated diagnosis shortens recovery time and enhances uptime, creating a strong commercial incentive to adopt advanced software-driven resilience models.
- For instance, Siemens announced it recorded 5,250 new inventions in fiscal 2024—averaging 24 inventions per workday—with over half of the award-winning solutions leveraging artificial intelligence.
Rising Need for Security Resilience and Attack Simulations
Cyberattacks are more sophisticated, forcing companies to test how systems behave during breaches, DDoS events, or data access failures. Chaos tools help simulate traffic floods, container compromise, API failures, and authentication breakdowns. Security teams measure detection time, alert quality, and response speed to improve defense readiness. As zero-trust and cloud-native security models expand, demand grows for platforms that merge chaos testing with security monitoring. This creates a major opportunity for vendors offering combined observability, compliance modules, and automated recovery analytics.
- For instance, ESI Group’s BM-Stamp stamping-simulation platform has already been adopted by more than 25 users at OEM Stellantis, and for a large aluminium hood inner with up to 10 mm spring-back it achieved geometry prediction accuracy of 0.5 mm in 95% of the part surface.
Expansion in Regulated and Mission-Critical Industries
Sectors like healthcare, finance, aviation, and public services adopt chaos engineering to validate uptime, data protection, and multi-region backup systems. Vendors offer compliance-friendly deployment options such as private cloud and on-premise setups that meet regulatory standards. Enterprises use chaos tests to safeguard against outages caused by hardware failures, network instability, or cloud downtime. As mission-critical industries move to hybrid infrastructures, demand rises for certified tools, consulting, and continuous resilience validation services. This expansion opens strong future revenue opportunities.
Key Challenges
Skill Gap and Limited In-House Expertise
Many engineering teams lack experience in designing, running, and analyzing chaos experiments. Poorly executed tests risk disrupting live systems, making some companies hesitant to adopt full-scale implementations. Skilled SRE and DevOps professionals are needed to configure fault injections, interpret observability data, and create automated safety checks. Smaller organizations struggle with training costs and complexity. Vendors respond by offering managed services and guided workflows, but knowledge gaps still slow market penetration, especially in early-stage adopters.
Concerns Over Production Risk and Downtime Exposure
Organizations fear that chaos tests may trigger unintended outages, performance drops, or data integrity issues during peak business hours. Firms running legacy systems hesitate to introduce controlled failures because infrastructure may lack safeguards. Without proper blast-radius controls and rollback strategies, testing can affect customer-facing services. This risk perception limits adoption in highly sensitive environments. Vendors address concerns with sandboxing, safe-mode testing, and real-time monitoring, yet operational hesitation remains a barrier in risk-averse enterprises.
Regional Analysis
North America
North America holds the dominant share of nearly 37% driven by strong cloud adoption, mature DevOps practices, and rapid shift toward microservice systems in SaaS, fintech, e-commerce, and streaming platforms. Enterprises invest in chaos engineering to validate uptime, load handling, and cross-region failover. Major vendors, hyperscale cloud providers, and observability platforms are headquartered in this region, supporting faster product innovation and integrations. U.S. enterprises also use chaos testing to meet SLA commitments and avoid revenue loss from service disruption. Increasing focus on autonomous remediation and AI-based observability further strengthens adoption across large-scale infrastructures.
Europe
Europe accounts for roughly 26% share supported by strong regulatory compliance requirements and rising adoption of cloud-native development. Banks, automotive manufacturers, telecommunications providers, and Industry 4.0 platforms use chaos engineering to secure uptime and reduce failure risks in distributed systems. Many organizations operate private cloud or hybrid deployments to meet data protection standards, creating demand for controlled, on-premise chaos platforms. Countries such as Germany, the U.K., and France lead adoption due to digital transformation and advanced DevOps maturity. Vendors benefit from growing preference for real-time monitoring, disaster recovery validation, and automated fault simulation.
Asia-Pacific
Asia-Pacific holds approximately 23% market share and shows the fastest expansion due to rapid digitalization, large cloud user base, and the presence of hyperscale data centers. E-commerce, online gaming, fintech, and telecom operators rely on chaos tools to manage peak loads and unpredictable traffic patterns. Countries including India, China, Japan, and South Korea invest in microservices, serverless workloads, and container orchestration. Many enterprises adopt chaos engineering to reduce downtime costs and improve customer experience in high-transaction environments. The region’s expanding startup ecosystem and cloud-native service providers further accelerate tool adoption.
Latin America
Latin America secures close to 8% share, supported by growing use of cloud infrastructure and DevOps practices in banking, telecom, and retail. Companies deploy chaos tools to eliminate single points of failure, validate backup strategies, and improve service reliability. Brazil and Mexico lead adoption due to strong digital transformation in financial services, e-commerce, and media platforms. Organizations focus on resilience testing to handle traffic spikes during online shopping and payment events. While market penetration is lower than major regions, increasing cloud migration and managed service offerings create steady growth potential.
Middle East & Africa
Middle East & Africa represent nearly 6% share, driven by modernization of IT infrastructure in energy, telecom, aviation, and government digital services. Chaos engineering platforms help validate redundancy and disaster recovery in mission-critical systems used for air traffic control, banking, and national digital platforms. Gulf countries invest heavily in cloud data centers, boosting demand for automated resilience testing. Adoption remains gradual due to skill gaps and limited SRE maturity, but consulting services and cloud-based deployments enable steady market development. Growing cybersecurity threats also encourage security-focused chaos experiments across modernized networks.
Market Segmentations:
By Deployment Model:
- Public Cloud
- Private Cloud
By Application:
- Fault Injection & Testing
- Resilience Testing & Disaster Recovery
By Component:
By Geography
- North America
- Europe
- Germany
- France
- U.K.
- Italy
- Spain
- Rest of Europe
- Asia Pacific
- China
- Japan
- India
- South Korea
- South-east Asia
- Rest of Asia Pacific
- Latin America
- Brazil
- Argentina
- Rest of Latin America
- Middle East & Africa
- GCC Countries
- South Africa
- Rest of the Middle East and Africa
Competitive Landscape
The competitive landscape in the Chaos Engineering Tools Market features 3D Systems Inc., Hexagon AB, Bentley Systems, Incorporated, Mastercam, ANSYS, Inc, PTC, Autodesk Inc., Siemens, ESI Group, and Dassault Systèmes. The Chaos Engineering Tools Market focuses on automation, cloud-native testing, and integration with observability platforms. Vendors enhance platforms with real-time dashboards, safe-fail controls, and guided experiment libraries to reduce operational risk. Many providers invest in AI-assisted analysis to predict failure points, recommend test scenarios, and accelerate remediation. Consulting services, managed chaos operations, and training programs help enterprises overcome skill gaps and adopt continuous resilience practices. Partnerships with cloud service providers, DevOps platforms, and SRE teams support large-scale deployment across hybrid and multi-region environments. As uptime becomes a core business metric, competition centers on speed, scalability, and intelligent fault orchestration.
Shape Your Report to Specific Countries or Regions & Enjoy 30% Off!
Key Player Analysis
- 3D Systems Inc.
- Hexagon AB
- Bentley Systems, Incorporated
- Mastercam
- ANSYS, Inc
- PTC
- Autodesk Inc.
- Siemens
- ESI Group
- Dassault Systèmes
Recent Developments
- In March 2025, Siemens acquired Altair Engineering Inc., a software solutions provider in the industrial simulation and analysis sector. This strategic move aligns with Altair’s goal of accelerating customers’ digital and sustainability transformations by bridging the physical and digital worlds.
- In December 2024, Tata Consultancy Services, a leading IT service provider, extended a partnership with Telenor Denmark (TnDK), the second-largest mobile operator in the Danish market.
- In September 2024, Bentley Systems, Incorporated acquired Cesium, a 3D geospatial company. Cesium Ion, the company’s SaaS platform, delivers 3D geospatial experiences to over 1 million active devices monthly. Bentley’s iTwin Platform enables engineering and construction firms and asset owners to design, build, and operate the world’s infrastructure using digital twin solutions.
- In July 2024, Capgemini announced an acquisition of Lösch & Partner to augment its capabilities in application lifecycle management and systems engineering for German automotive manufacturers.
Report Coverage
The research report offers an in-depth analysis based on Deployment Model, Application, Component and Geography. It details leading market players, providing an overview of their business, product offerings, investments, revenue streams, and key applications. Additionally, the report includes insights into the competitive environment, SWOT analysis, current market trends, as well as the primary drivers and constraints. Furthermore, it discusses various factors that have driven market expansion in recent years. The report also explores market dynamics, regulatory scenarios, and technological advancements that are shaping the industry. It assesses the impact of external factors and global economic changes on market growth. Lastly, it provides strategic recommendations for new entrants and established companies to navigate the complexities of the market.
Future Outlook
- Adoption will rise as microservices, containers, and serverless workloads expand across cloud environments.
- Vendors will add AI-driven fault prediction and automated recovery features to improve reliability.
- Enterprises will run chaos experiments in production-like environments to validate failover and disaster recovery.
- Security-focused chaos testing will grow as cyberattacks and API-layer threats increase.
- Private cloud and on-premise deployment will expand in regulated and data-sensitive industries.
- Managed chaos engineering services will help companies with limited SRE expertise adopt controlled testing.
- Tools will integrate deeper with CI/CD pipelines, observability platforms, and incident response systems.
- Automated experiment libraries will reduce manual setup and improve test repeatability for DevOps teams.
- Adoption will increase in telecom, fintech, online gaming, and streaming platforms with high traffic loads.
- Vendors will compete on faster testing, safer blast radius controls, and multi-region resilience validation.


