
Market Overview
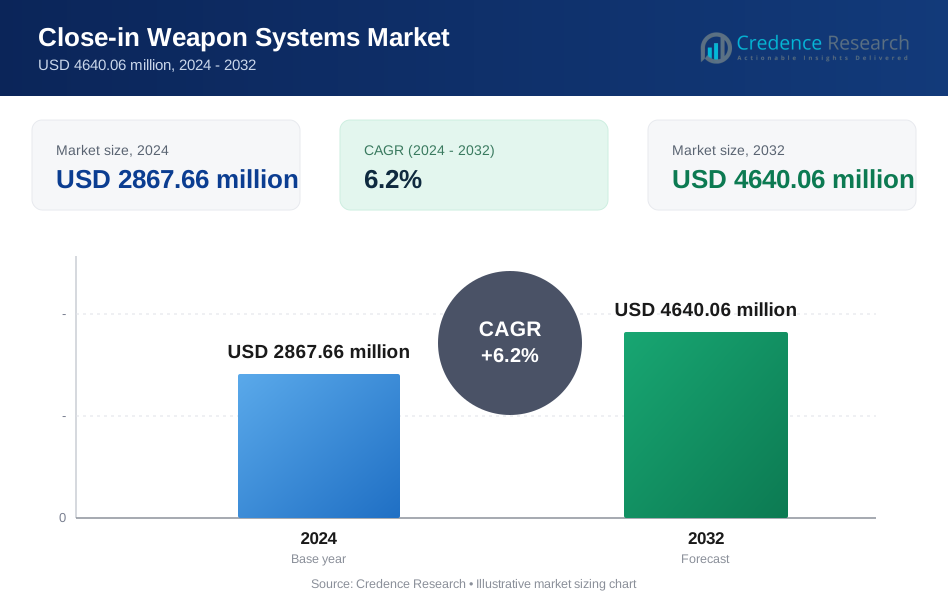
Close in Weapon Systems Market size was valued USD 2867.66 million in 2024 and is anticipated to reach USD 4640.06 million by 2032, at a CAGR of 6.2% during the forecast period.
| REPORT ATTRIBUTE | DETAILS |
|---|---|
| Historical Period | 2020-2023 |
| Base Year | 2024 |
| Forecast Period | 2025-2032 |
| Close-in Weapon Systems Market Size 2024 | USD 2867.66 million |
| Close-in Weapon Systems Market, CAGR | 6.2% |
| Close-in Weapon Systems Market Size 2032 | USD 4640.06 million |
The Close-In Weapon Systems market features strong competition among global defense manufacturers integrating radar guidance, automated tracking, and high-rate interception for naval and ground forces. Companies enhance system precision through electro-optical sensors, network-centric operation, and modular weapon designs suitable for new ship classes and retrofit programs. North America leads the global market with 38% share due to advanced naval fleets, high defense spending, and continuous modernization of destroyers, cruisers, and carrier strike groups. Expanding combat ship programs and rising threats from missiles and drones support sustained demand for CIWS across the region.

Market Insights
- Close in Weapon Systems Market size was valued at USD 2867.66 million in 2024 and is projected to reach USD 4640.06 million by 2032, growing at a CAGR of 6.2%.
- Rising missile and drone threats drive adoption of advanced CIWS equipped with radar guidance, automated tracking, and network-centric targeting for naval and ground protection.
- Missile-based CIWS and hybrid gun-missile systems represent a growing trend, offering longer engagement ranges and higher interception accuracy against fast-moving targets.
- Strong competition exists among global defense suppliers focusing on modular designs, electro-optical sensors, and multi-target engagement capabilities to secure naval upgrade contracts.
- North America holds the largest regional share at 38%, while naval platforms represent the dominant segment due to large destroyer and frigate modernization programs supporting continuous procurement.
Market Segmentation Analysis:
By Platform
Naval-based CIWS holds the dominant share in the Close-In Weapon Systems market due to rising naval modernization and increasing deployment of destroyers, frigates, and aircraft carriers. Maritime threats from anti-ship missiles, drones, and fast-attack crafts drive procurement of high-rate gun and missile-based defense systems. Nations in North America, Europe, and Asia invest in integrated CIWS to secure sea trade routes and territorial waters. Shipbuilders integrate radar guidance, fire-control systems, and automated intercept capabilities, boosting demand for naval platforms.
- For instance, Raytheon’s Phalanx Block 1B fires 4,500 rounds per minute using a 20 mm M61A1. Raytheon/Diehl’s RAM Block 2 interceptors reach Mach 2 and engage targets at 9 km.
By Range
Short-range systems account for the largest share because most close-in engagements involve high-speed missiles, drones, and low-flying aircraft within 2 km. Defense forces prefer compact intercept units with rapid tracking and high firing rates for vessel and base protection. Growth in drone swarms and precision-guided missiles increases reliance on short-range platforms for last-line defense. Manufacturers enhance reaction time, multi-target tracking, and fire accuracy, strengthening adoption across naval and ground applications.
- For instance, OMRON’s NX7 synchronizes 256 axes with a 125-microsecond control cycle. OMRON FHV7 smart cameras capture up to 430 frames per second with 1-microsecond shutter.
By End User
Naval forces dominate the market share since CIWS remains a critical self-defense layer for surface combatants and fleet escorts. Navy operators prioritize automated interception against supersonic missiles and asymmetric maritime threats. Several countries expand shipborne weapon upgrades to replace legacy systems with advanced radar, electro-optical sensors, and remote-controlled firing units. Increasing shipbuilding programs and offshore security missions further scale demand across coastal and blue-water fleets. Ground forces also adopt CIWS to counter rockets, artillery, mortars, and drone attacks on military bases and mobile assets.
Key Growth Drivers
Increasing Threat of Anti-Ship Missiles and Drone Attacks
Rising deployment of hypersonic missiles, sea-skimming cruise missiles, and drone swarms drives strong demand for Close-In Weapon Systems. Naval fleets require last-line interception to protect critical vessels and shipping routes. Nations modernize destroyers, corvettes, and patrol boats to counter fast-attack crafts and precision-guided threats. Integrated fire-control radars, automated tracking, and high-rate guns support effective engagements at close ranges. These upgrades strengthen layered maritime defense and stimulate continuous system procurement.
- For instance, Mitsubishi Electric supplies radar modular assemblies for the SPY-6(V) family developed with Raytheon. The SPY-6(V)1 variant uses 37 radar modular assemblies per array face, giving the system its full sensitivity and discrimination capability.
Global Naval Modernization and Fleet Expansion
Many countries invest in fleet expansion and shipbuilding programs, leading to accelerated installation of CIWS across new and existing platforms. Governments prioritize self-defense capabilities on carriers, frigates, and amphibious assault ships. Defense contracts increase for lightweight, modular designs suited for both large and small vessels. Naval modernization plans in Asia Pacific, Europe, and the Middle East boost long-term demand. Upgrades replace aging systems with advanced electro-optical sensors, missile integration, and automated threat response.
- For instance, Siemens Energy’s SISHIP SiPOD-M podded propulsion system supports vessels in the 5 MW to 23 MW power range, enabling flexible hull layouts and compact installation on naval ships.
Growing Use of Autonomous and Network-Centric Defense
Modern CIWS integrates digital sensors, remote operation, and network-centric targeting for faster threat detection. Joint command architectures link ships, coastal defense units, and aircraft for shared situational awareness. Artificial intelligence and automated interception improve hit probability against high-speed targets. Defense forces adopt data fusion, real-time tracking, and precision guidance to manage complex threat environments. These advancements increase operational reliability and expand procurement across naval and ground forces.
Key Trends & Opportunities
Rising Adoption of Missile-Based CIWS Systems
Missile-based CIWS units gain traction due to extended range and higher kill probability compared to gun-only platforms. They counter maneuvering missiles, larger drones, and fast airborne threats. Nations upgrade combined gun-and-missile systems for layered interception on combat ships. Enhanced seeker technology and automated lock-on capabilities create growth opportunities for defense manufacturers. Increased demand for modular launchers and vertical-firing missile interceptors supports new export contracts.
- For instance, Kawasaki’s new “Island Defense Anti-Ship Missile” (project “New SSM”) uses the company’s KJ300 turbofan engine, which is 0.95 meters in length and produces a thrust of 3.58 kN (~365 kgf) at sea-level static conditions.
Growth in Ground-Based CIWS for Base and Infrastructure Protection
Ground forces adopt CIWS to secure airbases, command posts, and strategic industrial zones. Rising drone warfare, artillery attacks, and unmanned reconnaissance missions increase procurement of mobile and stationary intercept systems. Defense agencies invest in radar-guided, rapid-fire solutions with high accuracy and 360-degree coverage. Opportunities expand across regions conducting border surveillance and counter-terrorism operations. System suppliers develop truck-mounted platforms for fast deployment and flexible battlefield mobility.
- For instance, Emerson’s “Paine™ 220-10-020” digital pressure and temperature transmitter supports pressure ranges from 0–100 psia (6 bar) up to 0–10,000 psia (689 bar), with resolution of 16-bits and better than ±0.10% full-scale accuracy for the highest range.
Key Challenges
High Procurement and Maintenance Costs
Close-In Weapon Systems require advanced radar, automated guidance, and high-rate precision weapons, resulting in substantial acquisition cost. Many nations face budget constraints that delay modernization or reduce fleet integration. Continuous maintenance, ammunition handling, and crew training increase life-cycle expenses. Smaller navies favor selective upgrades rather than fleet-wide deployment, limiting overall adoption in developing regions.
Rapidly Evolving Missile and Drone Capabilities
Modern missiles display evasive maneuvers, low radar signatures, and higher speeds, challenging current CIWS response abilities. Drone swarms complicate tracking and overload fire-control systems. Defense manufacturers must upgrade computing power, tracking algorithms, and precision firing to match threat evolution. Failure to adapt reduces operational effectiveness and weakens confidence in legacy systems. Continuous R&D remains essential to keep pace with emerging attack technologies.
Regional Analysis
North America
North America holds the largest share of the Close-In Weapon Systems market at 38%, supported by advanced naval fleets, high defense spending, and continuous modernization of destroyers, cruisers, and carrier strike groups. The U.S. Navy integrates CIWS with missile defense and radar-guided solutions to protect against cruise missiles, drones, and fast-attack vessels. Strong demand for automated firing, digital tracking, and missile-based interceptors drives procurement across new and upgraded ships. The presence of leading defense contractors and active research programs strengthens long-term market dominance in the region.
Europe
Europe accounts for 27% of the market, driven by naval expansion, maritime security missions, and collaborative defense programs among NATO members. Countries modernize frigates, corvettes, and patrol fleets to counter missile, drone, and asymmetric threats in coastal and open-sea missions. Ongoing shipbuilding projects and interoperability requirements with NATO systems increase procurement of radar-guided CIWS. Rising tensions in the Baltic and Mediterranean regions further push investments in automated interception and integrated combat systems. European militaries also adopt ground-based CIWS for base protection and air defense reinforcement.
Asia Pacific
Asia Pacific captures 24% of global share and stands as the fastest-growing regional market. Naval forces expand fleets through new destroyers, submarines, and offshore patrol vessels to secure trade lanes and deter regional conflicts. China, India, Japan, and South Korea actively procure advanced CIWS to counter missile and drone threats. Territorial security in the South China Sea and Indo-Pacific drives modernization of surface combatants. Increased defense spending, domestic manufacturing, and technology partnerships support strong long-term demand for both naval and land-based systems.
Latin America
Latin America represents 4% of the market, driven by moderate naval upgrades and maritime security efforts. Regional navies focus on protecting offshore oil fields, coastal borders, and trade routes. Procurement mainly includes compact CIWS for patrol vessels and corvettes used in anti-smuggling and surveillance missions. Budget limitations slow large-scale adoption, yet select countries pursue modernization programs and alliance-based procurement. Growing concern over drone intrusions and advanced missile technologies is expected to influence future system investments.
Middle East & Africa
The Middle East & Africa region holds 7% share, supported by coastal surveillance needs, maritime asset protection, and modernization of naval fleets in Gulf states. High risk of drone attacks, missile strikes, and asymmetric maritime threats drives adoption of automated intercept systems. Strategic ports, offshore energy infrastructure, and naval bases integrate CIWS for last-line defense. Defense agencies focus on systems with fast reaction time and multi-target engagement. Some nations partner with global defense suppliers for technology transfer and localized production.
Market Segmentations:
By Platform:
- Naval-based CIWS
- Land-based CIWS
By Range:
- Short-range (2 km)
- Medium-range (2–10 km)
By End User:
- naval forces (Navy)
- ground forces
By Geography
- North America
- U.S.
- Canada
- Mexico
- Europe
- Germany
- France
- U.K.
- Italy
- Spain
- Rest of Europe
- Asia Pacific
- China
- Japan
- India
- South Korea
- South-east Asia
- Rest of Asia Pacific
- Latin America
- Brazil
- Argentina
- Rest of Latin America
- Middle East & Africa
- GCC Countries
- South Africa
- Rest of the Middle East and Africa
Competitive Landscape
The competitive landscape of the Close-In Weapon Systems market includes Rockwell Automation, Inc., OMRON Corporation, Mitsubishi Electric Corporation, Siemens AG, Yokogawa Electric Corporation, Kawasaki Heavy Industries, Ltd., Schneider Electric, Emerson Electric Co., ABB Ltd., and Honeywell International, Inc. The Close-In Weapon Systems market features strong rivalry among defense manufacturers focused on radar-guided interception, high-rate firing platforms, and integrated combat systems. Vendors compete by developing automated tracking, electro-optical sensors, and multi-target engagement to counter drones, cruise missiles, and fast-moving surface threats. Many companies invest in modular and lightweight CIWS designs suitable for new ship classes and retrofit programs. Partnerships with naval shipyards, defense agencies, and technology integrators strengthen market access and export potential. Rising defense budgets, naval modernization plans, and the expansion of land-based CIWS for base protection continue to support industry growth and long-term procurement.
Key Player Analysis
- Rockwell Automation, Inc.
- OMRON Corporation
- Mitsubishi Electric Corporation
- Siemens AG
- Yokogawa Electric Corporation
- Kawasaki Heavy Industries, Ltd.
- Schneider Electric
- Emerson Electric Co.
- ABB Ltd.
- Honeywell International, Inc.
Recent Developments
- In October 2024, Schneider Electric announced the US launch of its "Schneider Home" system, an all-in-one home energy management solution that helps homeowners simplify their energy consumption and increase their sustainability.
- In July 2024, Nozomi Networks Inc., a leader in OT and IoT security, introduced Arc Embedded—the first security sensor for OT and IoT that can be embedded directly within Mitsubishi Electric programmable logic controllers (PLCs).
- In March 2024, Larsen & Toubro Ltd., a supplier of infrastructure, Engineering and Defence announced that it signed a contract for the supply of Close-In weapon systems (CIWS) which are indigenously developed, to the Indian Air Force. The CIWS is planned for deployment at various locations across the country provide protection for assets from low signature and low flying aerial threats, including UAVs.
- In February 2023, ABB introduced an updated version of its ABB Ability™ Symphony® Plus distributed control system (DCS) to drive digital transformation in the power generation and water industries. DCS offers a secure OPC UA connection to Edge and Cloud environments, supporting digital advancement while maintaining core control and automation functions
Report Coverage
The research report offers an in-depth analysis based on Platform, Range, End-User and Geography. It details leading market players, providing an overview of their business, product offerings, investments, revenue streams, and key applications. Additionally, the report includes insights into the competitive environment, SWOT analysis, current market trends, as well as the primary drivers and constraints. Furthermore, it discusses various factors that have driven market expansion in recent years. The report also explores market dynamics, regulatory scenarios, and technological advancements that are shaping the industry. It assesses the impact of external factors and global economic changes on market growth. Lastly, it provides strategic recommendations for new entrants and established companies to navigate the complexities of the market.
Future Outlook
- Demand for CIWS will grow as navies expand fleets and upgrade older vessels.
- Missile-based CIWS adoption will increase due to longer engagement ranges and higher hit accuracy.
- Drone swarm threats will push development of faster tracking and automated engagement systems.
- Integrated radar and electro-optical sensors will become standard for multi-target interception.
- Ground-based CIWS will gain traction for airbase, border, and critical infrastructure protection.
- Nations will invest in modular and lightweight systems for small combat ships and patrol boats.
- AI-driven targeting and network-centric operation will enhance real-time threat response.
- Defense agencies will pursue joint development projects and technology-sharing programs.
- More countries will adopt hybrid gun-and-missile CIWS for layered last-line defense.
- Continuous upgrades and retrofit programs will extend the life of older naval platforms.
Request a Free Sample
Fill in your details and we'll send you a free sample report.
- Sample data tables & charts
- Research methodology
Need a Custom Version of This Report?
Tailor the scope, geography, or segments to your exact requirements.
- Custom geography or segment scope
- Direct access to our analyst team
Frequently Asked Questions
What is the current market size for Close in Weapon Systems Market, and what is its projected size in 2032?
At what Compound Annual Growth Rate is the Close in Weapon Systems Market projected to grow between 2025 and 2032?
Which Close in Weapon Systems Market segment held the largest share in 2024?
What are the primary factors fueling the growth of the Close in Weapon Systems Market?
Who are the leading companies in the Close in Weapon Systems Market?
Which region commanded the largest share of the Close in Weapon Systems Market in 2024?
Table of Content
Chapter 1. Report Introduction
- 1.1 Report Description & Purpose
- 1.1.1 Report Title & Market Definition
- 1.1.2 Unique Selling Propositions (USP) & Key Differentiators
- 1.1.3 Value Proposition for Stakeholders
- 1.2 Research Objectives
- 1.2.1 Market Sizing Objectives (Volume & Revenue)
- 1.2.2 Segmentation Objectives
- 1.2.3 Competitive Intelligence Objectives
- 1.2.4 Forecast & Scenario Objectives
- 1.3 Report Scope
- 1.3.1 Close-in Weapon Systems Scope – Types & Subtypes Covered
- 1.3.2 Geographic Scope – Regions & Countries Covered
- 1.3.3 Historical Period, Base Year & Forecast Period (2024; forecast to 2032)
- 1.3.4 Inclusions & Exclusions
- 1.4 HS Code & Classification Framework
- 1.5 Currency, Units & Pricing Basis
- 1.6 Target Stakeholders
- 1.7 Limitations & Assumptions
Chapter 2. Executive Summary
- 2.1 Global Close-in Weapon Systems Market Snapshot
- 2.1.1 Market Size – Historical (2024) & Forecast (2024-2032) (2024: USD 2867.66 million → 2032: USD 4640.06 million)
- 2.1.2 Volume & Revenue – Global Totals
- 2.1.3 Key Market Highlights – Top Five Facts
- 2.2 Close-in Weapon Systems Market Segmentation Snapshot
- 2.2.1 Market Split by Region – 2024 vs. 2032
- 2.3 Competitive Snapshot
- 2.3.1 Top 10 Players by Revenue Share – 2024
- 2.3.2 Top 10 Players by Volume Share – 2024
- 2.3.3 Recent Strategic Developments (18-Month Summary)
- 2.4 Key Investment Highlights & Strategic Conclusions
Chapter 3. Close-in Weapon Systems Market Dynamics & Industry Analysis
- 3.1 Market Overview & Context
- 3.1.1 Close-in Weapon Systems Market Position in the Broader Automotive Value Chain
- 3.1.2 OEM vs. Replacement Market Dynamics
- 3.1.3 Market Maturity & Development Stage by Region
- 3.2 Close-in Weapon Systems Market Drivers
- 3.3 Close-in Weapon Systems Market Restraints & Challenges
- 3.4 Close-in Weapon Systems Market Opportunities
- 3.5 Porter's Five Forces Analysis
- 3.5.1 Threat of New Entrants
- 3.5.2 Bargaining Power of Suppliers
- 3.5.3 Bargaining Power of Buyers
- 3.5.4 Threat of Substitutes
- 3.5.5 Competitive Rivalry – Intensity Assessment
- 3.6 Close-in Weapon Systems Value Chain Analysis
- 3.6.1 Upstream – Raw Material/Input Suppliers
- 3.6.1.1 Raw Material/Input 1
- 3.6.1.2 Raw Material/Input 2
- 3.6.1.3 Raw Material/Input 3
- 3.6.2 Midstream – Production/Manufacturing/Service Delivery
- 3.6.2.1 Production/Process Overview
- 3.6.2.2 Key Facility Locations & Capacity by Manufacturer
- 3.6.3 Downstream – Distribution & End Consumer
- 3.6.3.1 Primary Channel – B2B/OEM
- 3.6.3.2 Secondary Channels – Dealer, Retail, Online, Direct
- 3.6.4 Value Chain Profitability Analysis
- 3.6.1 Upstream – Raw Material/Input Suppliers
- 3.7 PESTEL Analysis
- 3.7.1 Political Factors
- 3.7.2 Economic Factors
- 3.7.3 Social Factors
- 3.7.4 Technological Factors
- 3.7.5 Environmental Factors
- 3.7.6 Legal Factors
- 3.8 Close-in Weapon Systems Supply Chain Analysis
- 3.8.1 Raw Material/Input Supply Risk Assessment
- 3.8.2 Manufacturing Concentration Risk (Geographic Exposure)
- 3.8.3 Trade Disruption Impact Analysis
- 3.9 Regulatory & Policy Landscape
Note: The regulatory and policy landscape section covers regulations based on their applicability to the market, Close-in Weapon Systems category, geography, and scope of the study. Only regulatory frameworks with a material impact on operations, compliance, trade, sustainability, or market access are analyzed in detail.
Chapter 4. Key Investment Pockets & Opportunity Analysis
- 4.1 Close-in Weapon Systems Market Attractiveness Analysis
- 4.1.1 By Region – Investment Attractiveness Matrix (Volume × CAGR)
- 4.2 Absolute Revenue Growth Opportunity
- 4.2.1 By Region – Absolute USD Growth Through 2032
- 4.3 Incremental Volume Opportunity
- 4.3.1 By Region – Incremental Volume Through 2032
- 4.3.2 Segment – Incremental Volume
- 4.4 Emerging Submarket Opportunity Deep Dive (Subject to Applicability)
- 4.5 Emerging Market Opportunity Scorecards
- 4.5.1 United States
- 4.5.2 Europe
- 4.5.3 Asia
- 4.5.4 Middle East & Africa
Note: Emerging Market Opportunity Scorecards will be included based on relevance and strategic importance. Regions listed are indicative and may vary depending on data availability and market dynamics.
Chapter 5. Close-in Weapon Systems Import-Export Analysis & Trade Flows
- 5.1 Global Trade Overview
- 5.1.1 Global Export Value by Country (2024)
- 5.1.2 Global Export Volume by Country (2024)
- 5.1.3 Global Import Value by Country (2024)
- 5.1.4 Global Import Volume by Country (2024)
- 5.1.5 Net Trade Balance by Country (2024)
- 5.2 Export Analysis – Segment
- 5.2.1 Type 1 (HS Code)
- 5.2.2 Type 2 (HS Code)
- 5.2.3 Type 3 (HS Code)
- 5.2.4 Type 4 (HS Code)
- 5.2.5 Type 5 (HS Code)
- 5.3 Import Analysis – Segment
- 5.3.1 Type 1 (HS Code)
- 5.3.2 Type 2 (HS Code)
- 5.3.3 Type 3 (HS Code)
- 5.3.4 Type 4 (HS Code)
- 5.3.5 Type 5 (HS Code)
- 5.4 Average Unit Trade Prices
- 5.4.1 Average Export Price – Segment & Country
- 5.4.2 Average Import Price – Segment & Source Country
- 5.4.3 Price Trends (2024)
- 5.5 Key Trade Route Analysis
- 5.5.1 Trade Route 1
- 5.5.2 Trade Route 2
- 5.5.3 Trade Route 3
- 5.5.4 Trade Route 4
- 5.5.5 Trade Route 5
- 5.6 Trade Policy Impact Assessment
- 5.6.1 US Anti-Dumping & Section 301 Tariffs
- 5.6.2 EU Customs Union Impact
- 5.6.3 Major Free Trade Agreements
- 5.6.4 USMCA Rules of Origin
Note: Trade policy analysis will be included only where relevant to the Close-in Weapon Systems market.
Chapter 6. Competitive Landscape & Company Benchmarking
- 6.1 Close-in Weapon Systems Market Concentration & Structure
- 6.1.1 Herfindahl-Hirschman Index (HHI) – vs. 2024
- 6.1.2 Tier 1, Tier 2 & Tier 3 Market Structure
- 6.1.3 Global, Regional & Local Player Dynamics
- 6.2 Close-in Weapon Systems Market Share Analysis – 2024
- 6.2.1 Global Revenue Share by Company
- 6.2.2 Global Volume Share by Company
- 6.2.3 Regional Revenue Share
- 6.2.4 Market Share Evolution ( vs. 2024)
- 6.2.5 OEM Segment Share by Company
- 6.2.6 Replacement Segment Share by Company
- 6.3 Production/Delivery Capacity & Facility Analysis
- 6.3.1 Global Installed Capacity
- 6.3.2 Capacity Utilization Rates
- 6.3.3 Production/Output Volume
- 6.3.4 Facility Locations & Capacity Map
- 6.3.5 Planned Capacity Additions
- 6.4 Close-in Weapon Systems Competitive Benchmarking Matrix
- 6.4.1 Revenue, Volume, CAGR & Profitability Comparison
- 6.4.2 Channel Revenue Mix
- 6.4.3 Geographic Revenue Exposure
- 6.4.4 R&D Intensity
- 6.4.5 Sustainability Maturity
- 6.5 Strategic Developments in Close-in Weapon Systems (Last 24 Months)
- 6.5.1 Mergers, Acquisitions & Divestments
- 6.5.2 New Close-in Weapon Systems Launches
- 6.5.3 Facility Expansions
- 6.5.4 Strategic Alliances, Joint Ventures & Partnerships
- 6.5.5 Distribution Expansion & Market Entry
- 6.5.6 Sustainability & ESG Initiatives
- 6.6 Competitive Strategy Mapping
- 6.6.1 Leader, Challenger, Follower & Niche Classification
- 6.6.2 Pricing Strategy Comparison
- 6.6.3 Channel Strategy Matrix
Note: Strategic developments are included based on their materiality and the availability of reliable information.
Chapter 7. Global Close-in Weapon Systems Market – By Distribution Channel
- 7.1 Segment Overview
- 7.1.1 Volume & Revenue Split by Channel (2024 & 2032)
- 7.1.2 Channel Mix Evolution (2024-2032)
Chapter 8. Regional Market Analysis – Global Overview
- 8.1 Global Regional Overview
- 8.1.1 Regional Volume Share
- 8.1.2 Regional Revenue Share
- 8.1.3 Regional Volume by Region
- 8.1.4 Regional Revenue by Region
- 8.1.5 Regional Forecast Through 2032
- 8.2 Cross-Regional Segment Analysis
- 8.2.1 By Distribution Channel
- 8.2.2 By Brand/Price Tier
Chapter 9. North America Close-in Weapon Systems Market
- 9.1 United States
- 9.2 Canada
- 9.3 Mexico
Chapter 10. Europe Close-in Weapon Systems Market
- 10.1 Germany
- 10.2 France
- 10.3 Italy
- 10.4 United Kingdom
- 10.5 Spain
- 10.6 Poland
- 10.7 Russia
- 10.8 Netherlands
- 10.9 Belgium
- 10.10 Sweden
- 10.11 Denmark
- 10.12 Norway
- 10.13 Rest of Europe
Chapter 11. Asia Pacific Close-in Weapon Systems Market
- 11.1 China
- 11.2 India
- 11.3 Japan
- 11.4 South Korea
- 11.5 Thailand
- 11.6 Indonesia
- 11.7 Vietnam
- 11.8 Malaysia
- 11.9 Australia
- 11.10 Rest of Asia Pacific
Chapter 12. Latin America Close-in Weapon Systems Market
- 12.1 Brazil
- 12.2 Argentina
- 12.3 Colombia
- 12.4 Chile
- 12.5 Rest of Latin America
Chapter 13. Middle East Close-in Weapon Systems Market
- 13.1 Saudi Arabia
- 13.2 United Arab Emirates
- 13.3 Turkey
- 13.4 Israel
- 13.5 Iran
- 13.6 Rest of the Middle East
Chapter 14. Africa Close-in Weapon Systems Market
- 14.1 South Africa
- 14.2 Egypt
- 14.3 Nigeria
- 14.4 Morocco
- 14.5 Rest of Africa
Chapter 15. Close-in Weapon Systems Company Profiles
- 15.1 [Company 01]
- 15.1.1 Company Overview
- 15.1.2 Key Management Personnel
- 15.1.3 Products & Services Portfolio
- 15.1.4 Financial Performance
- 15.1.5 Key Market Focus & Geographic Presence
- 15.1.6 Recent Developments & Strategic Initiatives
Note: The company profile list is preliminary and may change based on research findings, market developments, data availability, and client requirements.
Chapter 16. Appendices
- Appendix A – List of Abbreviations & Acronyms
- Appendix B – Industry Classification Code Reference – Full Series
- Appendix C – Production & Capacity Data Tables
- Appendix D – End-Use & Demand Base Tables
- Appendix E – Consumption & Replacement Rate Assumptions
- Appendix F – ASP Reference Tables
- Appendix G – Manufacturing & Facility Database
- Appendix H – Import-Export Data Tables
- Appendix I – Regulatory Summary Tables
- Appendix J – Primary Research Participant List (Anonymized)
- Appendix K – Primary Research Questionnaire Framework
- Appendix L – Data Sources & Bibliography
- Appendix M – Market Size Divergence & Source Comparison
Chapter 17. Research Methodology
- 17.1 Research Framework & Philosophy
- 17.2 Secondary Research – Sources, Hierarchy & Data Extraction
- 17.3 Data Modeling – Bottom-Up & Top-Down Market Sizing
- 17.4 Primary Research – Stakeholder Framework, LOI & Sample Sizes
- 17.5 Forecast Methodology – Regression, Scenario & Sensitivity Analysis
- 17.6 Quality Control – Four-Layer Validation Framework
- 17.7 Limitations & Standard Assumptions
- 17.8 Disclaimer
