
Market Overview
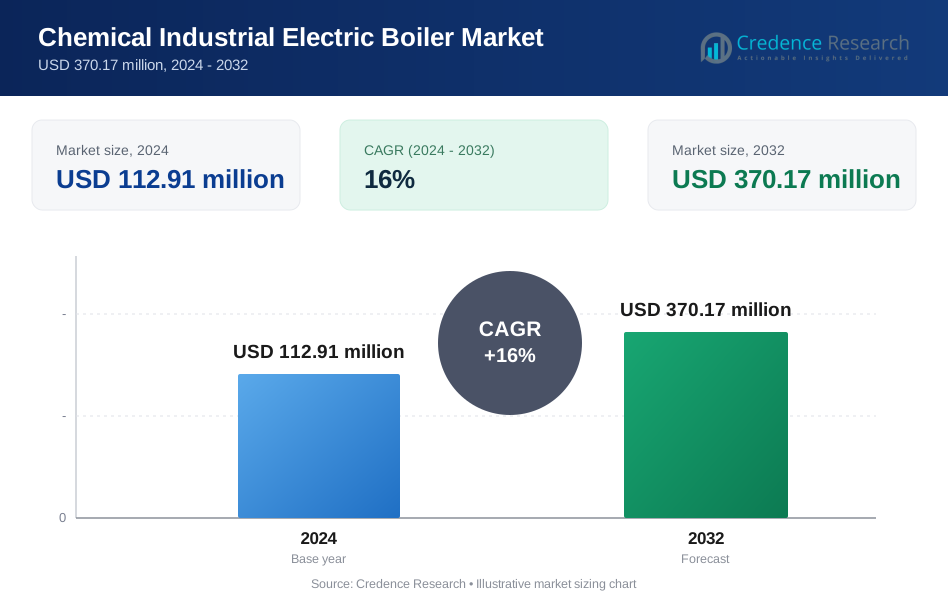
Chemical Industrial Electric Boiler Market was valued at USD 112.91 million in 2024 and is anticipated to reach USD 370.17 million by 2032, growing at a CAGR of 16% during the forecast period.
| REPORT ATTRIBUTE | DETAILS |
|---|---|
| Historical Period | 2020-2023 |
| Base Year | 2024 |
| Forecast Period | 2025-2032 |
| Chemical Industrial Electric Boiler Market Size 2024 | USD 112.91 Million |
| Chemical Industrial Electric Boiler Market, CAGR | 16% |
| Chemical Industrial Electric Boiler Market Size 2032 | USD 370.17 Million |
The Chemical Industrial Electric Boiler Market includes major players such as Danstoker A/S, Chromalox, Ecotherm Austria, Bosch Industriekessel, Cleaver-Brooks, Babcock Wanson, ACV, Cerney, ALFA LAVAL, and Acme Engineering Products. These companies focus on high-efficiency electric steam solutions, modular configurations, and smart control systems designed for continuous chemical processing. Leading manufacturers invest in automation, predictive maintenance, and no-emission boiler technologies to support decarbonization targets across industrial plants. Asia Pacific holds the largest regional share at 34%, driven by rapid chemical production growth, strong electrification policies, and expanding renewable power integration across China, Japan, South Korea, and India.
Market Insights
- The market reached USD 112.91 million in 2024 and is projected to grow at a CAGR of 16 % through 2032.
- Electrification of heat in chemical plants drives adoption, supported by zero on-site emissions, clean steam quality, and lower maintenance than combustion boilers.
- A key trend is the shift toward modular and high-capacity electric boilers, enabling flexible scaling and faster deployment in petrochemical and specialty chemical complexes.
- Asia Pacific leads with 34% regional share, while low-voltage systems account for 58% of the segment, driven by simple installation and strong use in mid-scale processing.
- High electricity cost and grid dependency remain restraints, slowing adoption in regions with weak power infrastructure or high industrial tariffs.
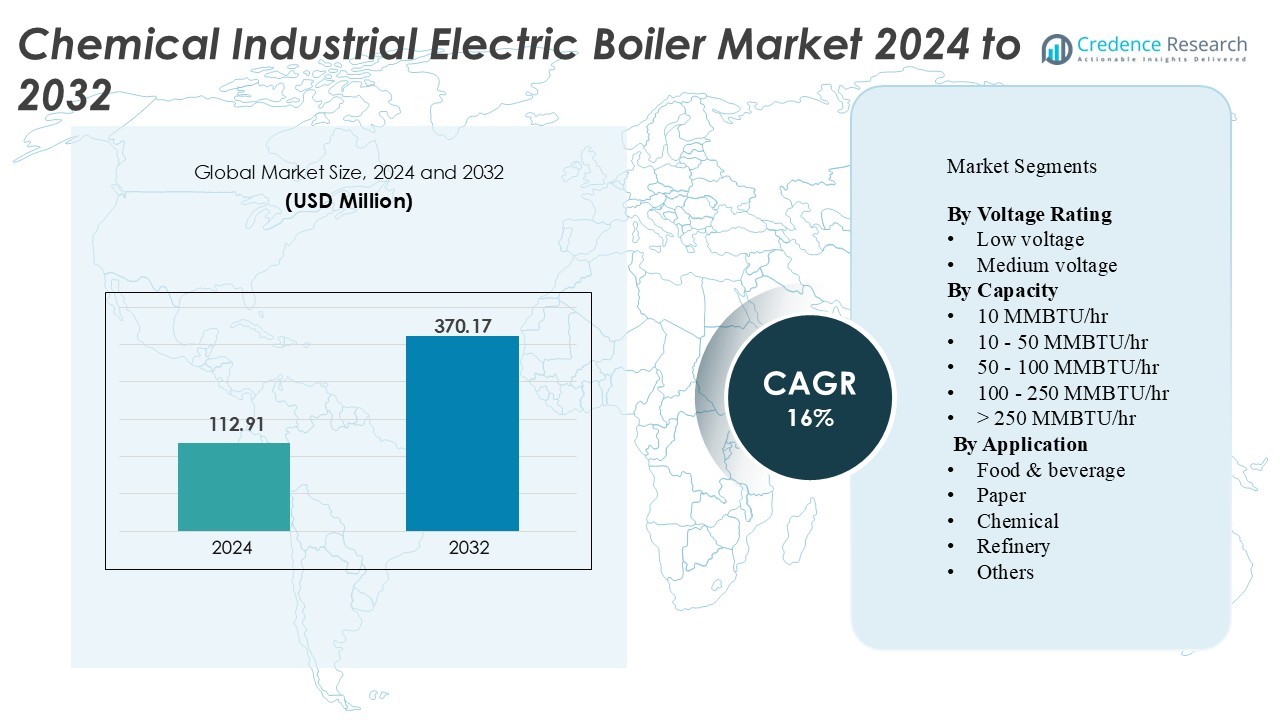
Market Segmentation Analysis:
By Voltage Rating
Low-voltage boilers lead the market with 58% share because they offer simple installation, lower insulation needs, and compatibility with small and mid-scale production units. Food processors, specialty chemical plants, and pharmaceutical units prefer low-voltage models to meet heat, cleaning, and sterilization needs without redesigning electrical infrastructure. Medium-voltage units hold the remaining share and gain traction in high-load processing lines that demand faster steam delivery. Growth in low-voltage adoption is driven by safety compliance, compact footprint, and lower maintenance costs, supporting quick deployment in brownfield expansions.
- For instance, Parat Halvorsen AS offers electric element boilers up to 5,000 kW (low-voltage supply, 230 V/400 V/690 V) with minimum loads down to 15 kW of steam/heating output.
By Capacity
Systems in the 10 – 50 MMBTU/hr range command 41% share, driven by broad use in continuous chemical processing, sterilization, and pasteurization lines. Manufacturers favor this range because it balances high thermal output with predictable energy consumption and grid stability. The 50 – 100 MMBTU/hr range ranks second as large plants shift from gas-fired boilers to electric steam solutions for decarbonization targets. The segment above 100 MMBTU/hr remains niche but grows in integrated chemical and petrochemical complexes adopting multi-boiler architectures to reduce flue-gas treatment costs.
- For instance, Parat Halvorsen has delivered electrode boilers in the 8–15 MW band for industrial process steam an 8 MW unit corresponds to ≈27.297 MMBtu/hr and a 10 MW unit corresponds to ≈34.121 MMBtu/hr, both squarely inside the 10–50 MMBtu/hr segment; Parat’s project list shows multiple 8 MW and 10 MW steam/hot-water installations for food, pharmaceuticals and process industries.
By Application
The chemical industry holds 39% share, making it the dominant application segment, supported by demand for clean steam and precise temperature control in batch and continuous reactors. Electric boilers eliminate combustion contamination, supporting high-purity chemical synthesis and heat-sensitive feedstock processing. Refineries adopt them in pilot plants and hydrogen processing units aiming to reduce Scope 1 emissions. Food and beverage uses expand for CIP systems, evaporation, and dairy sterilization. Paper, pharmaceuticals, and textile plants also shift to electric boilers to reduce greenhouse gas outputs and comply with emerging emission standards.
Key Growth Drivers
Decarbonization Pressure and Emissions Compliance
Chemical manufacturers face strict global limits on direct combustion emissions, pushing facilities to replace gas or coal-fired boilers with electric alternatives. Electric boilers provide zero on-site CO₂ emissions and remove the need for flue-gas treatment, soot blowers, and burner maintenance. This reduces operational complexity, lowers plant-level pollution, and supports ESG reporting. Governments in North America, Europe, and Asia offer incentives for electric heating adoption, including clean-energy grants, carbon credit eligibility, and electricity tax reductions for industrial users. As downstream customers demand greener supply chains, electric steam generation helps producers win contracts with sustainability commitments. Facilities engaged in specialty chemicals, pharmaceuticals, and high-purity intermediates also benefit from cleaner heat transfer without combustion residues, improving product quality and compliance with health-safety benchmarks.
- For instance, Cleaver‑Brooks promotes its electric steam/hot-water boilers with virtually 100% efficiency and zero on-site CO₂ emissions at the point of use.
Rising Electrification of Heat for High-Purity Production
Chemical and pharmaceutical plants increasingly adopt high-purity steam for sterilization, distillation, crystallization, and solvent recovery. Electric boilers deliver consistent steam quality without combustion byproducts such as NOx, SO₂, ash, or unburnt hydrocarbons. This is crucial for food-grade chemistry, API synthesis, cosmetics ingredients, and semiconductor chemicals, where contamination risks trigger costly product losses. Electric units support precise temperature modulation, faster startup, and reduced overshoot, which improve batch efficiency and yield. Their compact footprint and modular configuration also fit brownfield expansions where space and piping modifications are limited. As specialty chemical production grows, demand for stable, clean, and programmable steam sources strengthens the shift toward electrified heat systems.
- For instance, Spirax-Sarco’s compact clean-steam generators produce nominal clean steam outputs from 50 kg/h up to 640 kg/h (CSM-C range) and the CSM-E form factor is specified to produce 50 kg/h of clean steam when supplied with 50 kW of electrical input suitable for upstream sterilizers and small API batches.
Lower Maintenance and Improved Operational Safety
Electric boilers eliminate burners, fuel lines, chimneys, and pressurized gas storage, reducing the risk of explosion, leakage, and fire incidents. Operators prefer simplified maintenance because there are fewer moving parts, no combustion tuning, and minimal corrosion from flue gases. Electric systems provide near-silent operation and offer automated load control, improving workplace safety and energy efficiency. Predictive monitoring tools and smart controllers optimize duty cycles, allowing easy integration into digital manufacturing systems. Reduced downtime and lower workforce training requirements create strong cost savings, especially for continuous chemical processing lines that operate around the clock.
Key Trend & Opportunity
Integration with Renewable Power and Green Hydrogen
Chemical companies increasingly pair electric boilers with renewable-based captive power, such as solar or wind, to create net-zero steam. Some plants explore hybrid systems using electrolyzers and green hydrogen, enabling electric boilers to operate during peak renewable generation while hydrogen covers high-load spikes. Smart energy management platforms schedule steam production during off-peak electricity pricing, lowering operating costs. As grid operators expand renewable capacity and demand-response programs, industries can sell unused electricity back to the grid or participate in virtual power plant schemes. This makes electrified heat a long-term strategic asset rather than only an emissions-reduction tool.
- For instance, research points out that power-to-heat systems (i.e., electric boilers) are mature (TRL 9) and can absorb highly fluctuating, low-quality renewable electricity without equipment damage, acting as a buffer to renewable grid volatility.
Modular High-Capacity Units for Large Chemical Complexes
Recent product launches include modular units above 100 MMBTU/hr that can be deployed in parallel to match refinery-scale or integrated chemical plant steam loads. Multi-boiler clusters provide redundancy, faster startup, and flexible load sharing, reducing reliance on conventional boilers. Vendors also offer skid-mounted solutions that shorten installation time and enable staged capacity expansion. Large complexes aiming for near-term decarbonization targets view these systems as a scalable pathway, supporting both base-load and backup steam generation without flue-gas treatment or emission reporting. Upcoming projects in petrochemicals, polymers, and ammonia processing indicate rising interest in utility electrification.
- For instance, Miura America Co., Ltd. (a modular boiler specialist) has documented modular steam-generator systems where the same output of a conventional larger boiler is achieved in about half the space and using 50-60 % of the footprint by dividing output among multiple smaller modules.
Key Challenge
High Electricity Costs and Grid Dependency
Despite operational advantages, electric boilers incur higher running costs in regions where industrial electricity prices exceed natural gas. Many chemical clusters face peak tariffs and demand charges that impact production economics. Fuel-based boilers remain cheaper to operate in areas with subsidized gas or coal. Plants must also secure strong grid capacity and reliable power quality, since voltage dips or outages disrupt continuous steam demand. Upgrading substations, transformers, and distribution networks creates additional capital burden, especially for older facilities. Without stable renewable or captive power, investment decisions become slower.
Scale Limitations and Thermal Load Constraints
Large chemical and refinery plants rely on high steam volumes that historically required conventional boilers with very high firing capacity. While electric units scale up, ultra-large installations still demand significant electrical infrastructure and heavy grid loading. Even modular clusters require space, high-capacity cabling, and sustained power delivery. In remote industrial zones with weak grid connectivity, electrified heat remains difficult to deploy. Until transmission upgrades and renewable capacity expand, some operators continue to rely on hybrid combustion-electric systems or phased transitions rather than full electrification.
Regional Analysis
North America
North America holds 31% share, supported by strong decarbonization policies, industrial electrification programs, and widespread renewable power integration. Chemical producers in the U.S. and Canada replace legacy gas-fired units with electric boilers to reduce Scope 1 emissions and qualify for clean-energy tax credits. Demand rises in specialty chemicals, pharmaceuticals, and food-grade intermediates that require high-purity steam. Growth in refinery pilot plants and hydrogen processing lines also expands adoption. Robust grid infrastructure, smart-energy platforms, and carbon-pricing incentives further strengthen market penetration across both greenfield and brownfield installations.
Europe
Europe accounts for 28% share, driven by aggressive climate targets, carbon trading schemes, and regulations restricting industrial combustion emissions. Germany, France, and the Netherlands lead installations across petrochemicals, polymers, and specialty chemical clusters. Electric boilers replace coal- and gas-based systems to support net-zero roadmaps and lower pollution in densely populated industrial zones. High electricity prices remain a restraint, but growing renewable capacity, demand-response pricing, and industrial electrification subsidies improve long-term economics. Food and beverage processors, pharmaceutical plants, and paper mills accelerate boiler conversions to comply with environmental and health-safety benchmarks.
Asia Pacific
Asia Pacific commands the 34% share, making it the largest regional market, led by rapid industrial expansion in China, Japan, South Korea, and India. Chemical manufacturers deploy electric boilers to meet emission norms and replace aging fossil-fuel infrastructure. Japan and South Korea push electrification through hydrogen pilot projects and corporate net-zero targets. China’s industrial parks integrate renewable-powered electric boilers as part of clean energy transition programs. Pharmaceutical, petrochemical, and food processing plants favor compact, automated units for efficient steam delivery. Rising power availability and decarbonization incentives strengthen regional leadership.
Middle East & Africa
Middle East & Africa hold 4% share, but adoption grows in refinery complexes, petrochemicals, and desalination-connected chemical units. Countries like the UAE and Saudi Arabia deploy electric boilers in pilot decarbonization projects and green hydrogen hubs where renewable power is abundant. Large integrated complexes explore modular systems to reduce flaring and combustion emissions. Although electricity costs and grid limitations slow broad deployment, government-backed clean energy infrastructure supports gradual transition.
Latin America
Latin America captures 3% share, supported by Brazil, Mexico, and Chile. Adoption rises in food processing, fertilizers, and chemical intermediates as producers modernize steam systems to improve energy efficiency and meet environmental norms. Renewable integration, especially hydropower and solar, makes electric boilers attractive for long-term sustainability. However, uneven grid reliability and capital constraints limit large-scale conversion.
Market Segmentations:
By Voltage Rating
- Low voltage
- Medium voltage
By Capacity
- 10 MMBTU/hr
- 10 - 50 MMBTU/hr
- 50 - 100 MMBTU/hr
- 100 - 250 MMBTU/hr
- > 250 MMBTU/hr
By Application
- Food & beverage
- Paper
- Chemical
- Refinery
- Others
By Geography
- North America
- U.S.
- Canada
- Mexico
- Europe
- Germany
- France
- U.K.
- Italy
- Spain
- Rest of Europe
- Asia Pacific
- China
- Japan
- India
- South Korea
- South-east Asia
- Rest of Asia Pacific
- Latin America
- Brazil
- Argentina
- Rest of Latin America
- Middle East & Africa
- GCC Countries
- South Africa
- Rest of the Middle East and Africa
Competitive Landscape
The competitive landscape of the Chemical Industrial Electric Boiler Market features global boiler manufacturers, electric heating specialists, and industrial system integrators offering high-efficiency steam generation solutions. Key companies expand portfolios with modular and high-capacity units that support electrification of medium and large chemical plants. Vendors compete on automation, safety features, boiler lifespan, and total operating cost. Digital monitoring platforms, IoT-based diagnostics, and predictive maintenance improve reliability for continuous chemical processing. Market leaders form partnerships with chemical producers, EPC contractors, and renewable power providers to deploy zero-emission heat solutions across greenfield and brownfield sites. Companies also focus on compact skid-mounted systems that shorten installation time and reduce engineering complexity. As governments introduce emissions regulations, manufacturers invest in R&D for faster startup, higher thermal output, and better grid compatibility. This continuous innovation strengthens competitiveness and accelerates replacement of conventional fuel-fired boilers in chemical production lines.
Key Player Analysis
- Danstoker A/S
- Chromalox
- Ecotherm Austria
- Bosch Industriekessel
- Cleaver-Brooks
- Babcock Wanson
- ACV
- Cerney
- ALFA LAVAL
- Acme Engineering Products
Recent Developments
- In February 2025, Danstoker supplied new electric steam boilers to Ege Carpets. Both Danish plants replaced gas units with Danstoker electric models. The shift supports lower-emission process steam.
- In August 2024, Ecotherm signed a contract to decarbonize Brodnica’s district heating with electric systems. The project features electric steam and hot-water solutions suited to industrial upgrades. It signals wider adoption of electric boilers across EU markets.
Report Coverage
The research report offers an in-depth analysis based on Voltage Rating, Capacity, Application and Geography. It details leading market players, providing an overview of their business, product offerings, investments, revenue streams, and key applications. Additionally, the report includes insights into the competitive environment, SWOT analysis, current market trends, as well as the primary drivers and constraints. Furthermore, it discusses various factors that have driven market expansion in recent years. The report also explores market dynamics, regulatory scenarios, and technological advancements that are shaping the industry. It assesses the impact of external factors and global economic changes on market growth. Lastly, it provides strategic recommendations for new entrants and established companies to navigate the complexities of the market.
Future Outlook
- Adoption will rise as chemical plants commit to long-term decarbonization and emission-free heat.
- Modular high-capacity systems will support replacement of fossil-fuel boilers in large complexes.
- More facilities will integrate electric boilers with renewable captive power and battery storage.
- Smart control and predictive maintenance will improve uptime and reduce operating costs.
- Green hydrogen-linked steam production will expand in hybrid electrification projects.
- Low-voltage units will remain dominant in mid-scale chemical and pharmaceutical operations.
- Digital monitoring will enable remote diagnostics and energy optimization.
- New installations will favor skid-mounted, plug-and-play systems with shorter commissioning time.
- Electricity pricing reforms and industrial subsidies will improve long-term economics.
- Regional adoption will accelerate as emission regulations tighten across developing markets
Request a Free Sample
Fill in your details and we'll send you a free sample report.
- Sample data tables & charts
- Research methodology
Need a Custom Version of This Report?
Tailor the scope, geography, or segments to your exact requirements.
- Custom geography or segment scope
- Direct access to our analyst team
Frequently Asked Questions
What is the current market size for Chemical Industrial Electric Boiler Market, and what is its projected size in 2032?
At what Compound Annual Growth Rate is Chemical Industrial Electric Boiler Market projected to grow between 2025 and 2032?
Which Chemical Industrial Electric Boiler Market segment held the largest share in 2024?
What are the primary factors fueling the growth of the Chemical Industrial Electric Boiler Market?
Who are the leading companies in the Chemical Industrial Electric Boiler Market?
Which region commanded the largest share of the Chemical Industrial Electric Boiler Market in 2024?
Table of Content
Chapter 1. Report Introduction
- 1.1 Report Description & Purpose
- 1.1.1 Report Title & Market Definition
- 1.1.2 Unique Selling Propositions (USP) & Key Differentiators
- 1.1.3 Value Proposition for Stakeholders
- 1.2 Research Objectives
- 1.2.1 Market Sizing Objectives (Volume & Revenue)
- 1.2.2 Segmentation Objectives
- 1.2.3 Competitive Intelligence Objectives
- 1.2.4 Forecast & Scenario Objectives
- 1.3 Report Scope
- 1.3.1 Chemical Industrial Electric Boiler Scope – Types & Subtypes Covered
- 1.3.2 Geographic Scope – Regions & Countries Covered
- 1.3.3 Historical Period, Base Year & Forecast Period (2024; forecast to 2032)
- 1.3.4 Inclusions & Exclusions
- 1.4 HS Code & Classification Framework
- 1.5 Currency, Units & Pricing Basis
- 1.6 Target Stakeholders
- 1.7 Limitations & Assumptions
Chapter 2. Executive Summary
- 2.1 Global Chemical Industrial Electric Boiler Market Snapshot
- 2.1.1 Market Size – Historical (2024) & Forecast (2024-2032) (2024: USD 112.91 million → 2032: USD 370.17 million)
- 2.1.2 Volume & Revenue – Global Totals
- 2.1.3 Key Market Highlights – Top Five Facts
- 2.2 Chemical Industrial Electric Boiler Market Segmentation Snapshot
- 2.2.1 Market Split by Region – 2024 vs. 2032
- 2.3 Competitive Snapshot
- 2.3.1 Top 10 Players by Revenue Share – 2024
- 2.3.2 Top 10 Players by Volume Share – 2024
- 2.3.3 Recent Strategic Developments (18-Month Summary)
- 2.4 Key Investment Highlights & Strategic Conclusions
Chapter 3. Chemical Industrial Electric Boiler Market Dynamics & Industry Analysis
- 3.1 Market Overview & Context
- 3.1.1 Chemical Industrial Electric Boiler Market Position in the Broader Automotive Value Chain
- 3.1.2 OEM vs. Replacement Market Dynamics
- 3.1.3 Market Maturity & Development Stage by Region
- 3.2 Chemical Industrial Electric Boiler Market Drivers
- 3.3 Chemical Industrial Electric Boiler Market Restraints & Challenges
- 3.4 Chemical Industrial Electric Boiler Market Opportunities
- 3.5 Porter's Five Forces Analysis
- 3.5.1 Threat of New Entrants
- 3.5.2 Bargaining Power of Suppliers
- 3.5.3 Bargaining Power of Buyers
- 3.5.4 Threat of Substitutes
- 3.5.5 Competitive Rivalry – Intensity Assessment
- 3.6 Chemical Industrial Electric Boiler Value Chain Analysis
- 3.6.1 Upstream – Raw Material/Input Suppliers
- 3.6.1.1 Raw Material/Input 1
- 3.6.1.2 Raw Material/Input 2
- 3.6.1.3 Raw Material/Input 3
- 3.6.2 Midstream – Production/Manufacturing/Service Delivery
- 3.6.2.1 Production/Process Overview
- 3.6.2.2 Key Facility Locations & Capacity by Manufacturer
- 3.6.3 Downstream – Distribution & End Consumer
- 3.6.3.1 Primary Channel – B2B/OEM
- 3.6.3.2 Secondary Channels – Dealer, Retail, Online, Direct
- 3.6.4 Value Chain Profitability Analysis
- 3.6.1 Upstream – Raw Material/Input Suppliers
- 3.7 PESTEL Analysis
- 3.7.1 Political Factors
- 3.7.2 Economic Factors
- 3.7.3 Social Factors
- 3.7.4 Technological Factors
- 3.7.5 Environmental Factors
- 3.7.6 Legal Factors
- 3.8 Chemical Industrial Electric Boiler Supply Chain Analysis
- 3.8.1 Raw Material/Input Supply Risk Assessment
- 3.8.2 Manufacturing Concentration Risk (Geographic Exposure)
- 3.8.3 Trade Disruption Impact Analysis
- 3.9 Regulatory & Policy Landscape
Note: The regulatory and policy landscape section covers regulations based on their applicability to the market, Chemical Industrial Electric Boiler category, geography, and scope of the study. Only regulatory frameworks with a material impact on operations, compliance, trade, sustainability, or market access are analyzed in detail.
Chapter 4. Key Investment Pockets & Opportunity Analysis
- 4.1 Chemical Industrial Electric Boiler Market Attractiveness Analysis
- 4.1.1 By Region – Investment Attractiveness Matrix (Volume × CAGR)
- 4.2 Absolute Revenue Growth Opportunity
- 4.2.1 By Region – Absolute USD Growth Through 2032
- 4.3 Incremental Volume Opportunity
- 4.3.1 By Region – Incremental Volume Through 2032
- 4.3.2 Segment – Incremental Volume
- 4.4 Emerging Submarket Opportunity Deep Dive (Subject to Applicability)
- 4.5 Emerging Market Opportunity Scorecards
- 4.5.1 United States
- 4.5.2 Europe
- 4.5.3 Asia
- 4.5.4 Middle East & Africa
Note: Emerging Market Opportunity Scorecards will be included based on relevance and strategic importance. Regions listed are indicative and may vary depending on data availability and market dynamics.
Chapter 5. Chemical Industrial Electric Boiler Import-Export Analysis & Trade Flows
- 5.1 Global Trade Overview
- 5.1.1 Global Export Value by Country (2024)
- 5.1.2 Global Export Volume by Country (2024)
- 5.1.3 Global Import Value by Country (2024)
- 5.1.4 Global Import Volume by Country (2024)
- 5.1.5 Net Trade Balance by Country (2024)
- 5.2 Export Analysis – Segment
- 5.2.1 Type 1 (HS Code)
- 5.2.2 Type 2 (HS Code)
- 5.2.3 Type 3 (HS Code)
- 5.2.4 Type 4 (HS Code)
- 5.2.5 Type 5 (HS Code)
- 5.3 Import Analysis – Segment
- 5.3.1 Type 1 (HS Code)
- 5.3.2 Type 2 (HS Code)
- 5.3.3 Type 3 (HS Code)
- 5.3.4 Type 4 (HS Code)
- 5.3.5 Type 5 (HS Code)
- 5.4 Average Unit Trade Prices
- 5.4.1 Average Export Price – Segment & Country
- 5.4.2 Average Import Price – Segment & Source Country
- 5.4.3 Price Trends (2024)
- 5.5 Key Trade Route Analysis
- 5.5.1 Trade Route 1
- 5.5.2 Trade Route 2
- 5.5.3 Trade Route 3
- 5.5.4 Trade Route 4
- 5.5.5 Trade Route 5
- 5.6 Trade Policy Impact Assessment
- 5.6.1 US Anti-Dumping & Section 301 Tariffs
- 5.6.2 EU Customs Union Impact
- 5.6.3 Major Free Trade Agreements
- 5.6.4 USMCA Rules of Origin
Note: Trade policy analysis will be included only where relevant to the Chemical Industrial Electric Boiler market.
Chapter 6. Competitive Landscape & Company Benchmarking
- 6.1 Chemical Industrial Electric Boiler Market Concentration & Structure
- 6.1.1 Herfindahl-Hirschman Index (HHI) – vs. 2024
- 6.1.2 Tier 1, Tier 2 & Tier 3 Market Structure
- 6.1.3 Global, Regional & Local Player Dynamics
- 6.2 Chemical Industrial Electric Boiler Market Share Analysis – 2024
- 6.2.1 Global Revenue Share by Company
- 6.2.2 Global Volume Share by Company
- 6.2.3 Regional Revenue Share
- 6.2.4 Market Share Evolution ( vs. 2024)
- 6.2.5 OEM Segment Share by Company
- 6.2.6 Replacement Segment Share by Company
- 6.3 Production/Delivery Capacity & Facility Analysis
- 6.3.1 Global Installed Capacity
- 6.3.2 Capacity Utilization Rates
- 6.3.3 Production/Output Volume
- 6.3.4 Facility Locations & Capacity Map
- 6.3.5 Planned Capacity Additions
- 6.4 Chemical Industrial Electric Boiler Competitive Benchmarking Matrix
- 6.4.1 Revenue, Volume, CAGR & Profitability Comparison
- 6.4.2 Channel Revenue Mix
- 6.4.3 Geographic Revenue Exposure
- 6.4.4 R&D Intensity
- 6.4.5 Sustainability Maturity
- 6.5 Strategic Developments in Chemical Industrial Electric Boiler (Last 24 Months)
- 6.5.1 Mergers, Acquisitions & Divestments
- 6.5.2 New Chemical Industrial Electric Boiler Launches
- 6.5.3 Facility Expansions
- 6.5.4 Strategic Alliances, Joint Ventures & Partnerships
- 6.5.5 Distribution Expansion & Market Entry
- 6.5.6 Sustainability & ESG Initiatives
- 6.6 Competitive Strategy Mapping
- 6.6.1 Leader, Challenger, Follower & Niche Classification
- 6.6.2 Pricing Strategy Comparison
- 6.6.3 Channel Strategy Matrix
Note: Strategic developments are included based on their materiality and the availability of reliable information.
Chapter 7. Global Chemical Industrial Electric Boiler Market – By Distribution Channel
- 7.1 Segment Overview
- 7.1.1 Volume & Revenue Split by Channel (2024 & 2032)
- 7.1.2 Channel Mix Evolution (2024-2032)
Chapter 8. Regional Market Analysis – Global Overview
- 8.1 Global Regional Overview
- 8.1.1 Regional Volume Share
- 8.1.2 Regional Revenue Share
- 8.1.3 Regional Volume by Region
- 8.1.4 Regional Revenue by Region
- 8.1.5 Regional Forecast Through 2032
- 8.2 Cross-Regional Segment Analysis
- 8.2.1 By Distribution Channel
- 8.2.2 By Brand/Price Tier
Chapter 9. North America Chemical Industrial Electric Boiler Market
- 9.1 United States
- 9.2 Canada
- 9.3 Mexico
Chapter 10. Europe Chemical Industrial Electric Boiler Market
- 10.1 Germany
- 10.2 France
- 10.3 Italy
- 10.4 United Kingdom
- 10.5 Spain
- 10.6 Poland
- 10.7 Russia
- 10.8 Netherlands
- 10.9 Belgium
- 10.10 Sweden
- 10.11 Denmark
- 10.12 Norway
- 10.13 Rest of Europe
Chapter 11. Asia Pacific Chemical Industrial Electric Boiler Market
- 11.1 China
- 11.2 India
- 11.3 Japan
- 11.4 South Korea
- 11.5 Thailand
- 11.6 Indonesia
- 11.7 Vietnam
- 11.8 Malaysia
- 11.9 Australia
- 11.10 Rest of Asia Pacific
Chapter 12. Latin America Chemical Industrial Electric Boiler Market
- 12.1 Brazil
- 12.2 Argentina
- 12.3 Colombia
- 12.4 Chile
- 12.5 Rest of Latin America
Chapter 13. Middle East Chemical Industrial Electric Boiler Market
- 13.1 Saudi Arabia
- 13.2 United Arab Emirates
- 13.3 Turkey
- 13.4 Israel
- 13.5 Iran
- 13.6 Rest of the Middle East
Chapter 14. Africa Chemical Industrial Electric Boiler Market
- 14.1 South Africa
- 14.2 Egypt
- 14.3 Nigeria
- 14.4 Morocco
- 14.5 Rest of Africa
Chapter 15. Chemical Industrial Electric Boiler Company Profiles
- 15.1 [Company 01]
- 15.1.1 Company Overview
- 15.1.2 Key Management Personnel
- 15.1.3 Products & Services Portfolio
- 15.1.4 Financial Performance
- 15.1.5 Key Market Focus & Geographic Presence
- 15.1.6 Recent Developments & Strategic Initiatives
Note: The company profile list is preliminary and may change based on research findings, market developments, data availability, and client requirements.
Chapter 16. Appendices
- Appendix A – List of Abbreviations & Acronyms
- Appendix B – Industry Classification Code Reference – Full Series
- Appendix C – Production & Capacity Data Tables
- Appendix D – End-Use & Demand Base Tables
- Appendix E – Consumption & Replacement Rate Assumptions
- Appendix F – ASP Reference Tables
- Appendix G – Manufacturing & Facility Database
- Appendix H – Import-Export Data Tables
- Appendix I – Regulatory Summary Tables
- Appendix J – Primary Research Participant List (Anonymized)
- Appendix K – Primary Research Questionnaire Framework
- Appendix L – Data Sources & Bibliography
- Appendix M – Market Size Divergence & Source Comparison
Chapter 17. Research Methodology
- 17.1 Research Framework & Philosophy
- 17.2 Secondary Research – Sources, Hierarchy & Data Extraction
- 17.3 Data Modeling – Bottom-Up & Top-Down Market Sizing
- 17.4 Primary Research – Stakeholder Framework, LOI & Sample Sizes
- 17.5 Forecast Methodology – Regression, Scenario & Sensitivity Analysis
- 17.6 Quality Control – Four-Layer Validation Framework
- 17.7 Limitations & Standard Assumptions
- 17.8 Disclaimer
