Market Overview
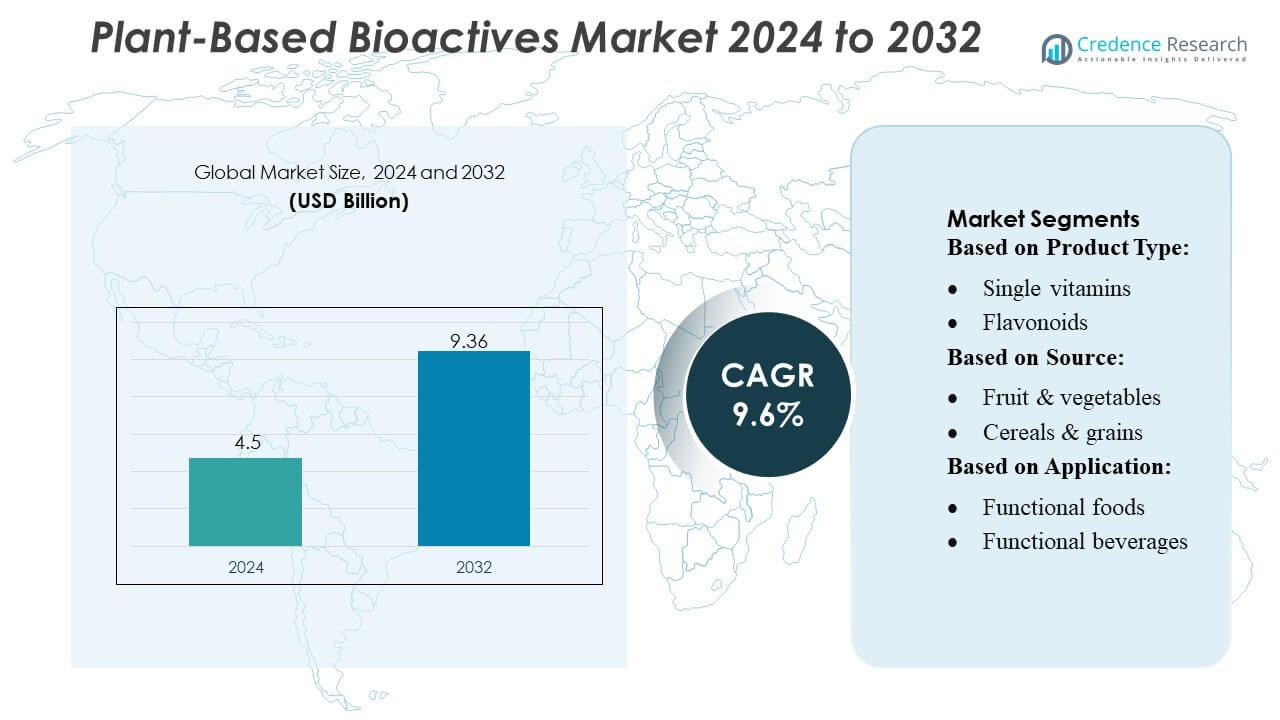
Plant-Based Bioactives Market size was valued USD 4.5 billion in 2024 and is anticipated to reach USD 9.36 billion by 2032, at a CAGR of 9.6% during the forecast period.
| REPORT ATTRIBUTE |
DETAILS |
| Historical Period |
2020-2023 |
| Base Year |
2024 |
| Forecast Period |
2025-2032 |
| Plant-Based Bioactives Market Size 2024 |
USD 4.5 Billion |
| Plant-Based Bioactives Market, CAGR |
9.6% |
| Plant-Based Bioactives Market Size 2032 |
USD 9.36 Billion |
The Plant-Based Bioactives Market is shaped by globally established ingredient manufacturers, nutraceutical producers, and biotechnology companies that focus on high-purity botanical extracts, advanced bioavailability solutions, and clean-label formulations. Leading players strengthen competitiveness through R&D investments in polyphenols, flavonoids, and other functional compounds while expanding partnerships with food, beverage, and pharmaceutical brands. Asia-Pacific dominates the market with 34–36% share, driven by abundant botanical resources, strong traditional medicine practices, and rising consumer demand for natural health solutions. The region’s large-scale production capabilities and expanding functional nutrition industry position it as the primary growth engine in the global market.
 Market Insights
- The Plant-Based Bioactives Market was valued at USD 4.5 billion in 2024 and is projected to reach USD 9.36 billion by 2032, registering a CAGR of 9.6% during the forecast period.
- Strong demand for natural ingredients, rising use of polyphenols and flavonoids in functional foods, and increasing preference for clean-label nutrition act as key market drivers.
- Trends reflect rapid adoption of advanced extraction technologies, growing interest in personalized nutrition, and expanding applications in dietary supplements, dairy alternatives, and fortified beverages.
- Competitive intensity remains high as ingredient manufacturers and biotech firms invest in bioavailability enhancement, sustainable sourcing, and strategic partnerships, while regulatory complexities and standardization challenges restrain faster growth.
- Asia-Pacific leads with 34–36% share, followed by North America and Europe, while functional foods and beverages remain the dominant segment with the highest share due to widespread incorporation of plant-based bioactives across immunity, metabolic health, and wellness categories.
Access crucial information at unmatched prices!
Request your sample report today & start making informed decisions powered by Credence Research Inc.!
Download Sample
Market Segmentation Analysis:
By Product Type
Polyphenols hold the dominant position in the Plant-Based Bioactives Market, capturing an estimated 34–36% share due to their strong antioxidant capacity, wide availability, and proven role in reducing inflammation and chronic disease risk. Demand strengthens as manufacturers use polyphenols in supplements, fortified foods, and beauty-from-within formulations. Flavonoids and phenolic acids follow, supported by expanding R&D into cardiovascular and metabolic benefits. Growth across single vitamins, lignans, and stilbenes stems from rising clean-label trends, although these segments remain smaller because of limited raw material supply and higher extraction costs.
- For instance, ecovio® IS1335 is a mineral-filled, compostable injection-molding grade certified under DIN EN 13432. Its tensile (Young’s) modulus is about 3,600 MPa at 23 °C; strain at break is approximately 4 %.
By Source
Plant-based sources lead this segment with an estimated 38–40% share, driven by abundant raw materials, scalable extraction processes, and strong consumer preference for natural and minimally processed ingredients. Fruit and vegetable sources rank second, supported by significant adoption in immunity-boosting products and natural colorant applications. Cereals, grains, and oilseeds grow steadily on the back of rising use in fiber-rich and omega-enhanced formulations. Herbs and spices remain niche but fast-growing due to their high bioactive concentration and increasing use in functional beverages, nutraceuticals, and therapeutic herbal blends.
- For instance, Mondi Advantage High Strength sack kraft paper with a basis weight of 80 g/m² reaches a machine-direction (MD) tensile strength of 6.8 kN/m and cross-direction (CD) strength of 5.2 kN/m, per ISO 1924-3.
By Application
Food & Beverages remain the dominant application, accounting for approximately 42–44% share, supported by strong consumer demand for functional nutrition and the adoption of bioactives in everyday consumables. Functional foods and functional beverages expand quickly as brands incorporate polyphenols, flavonoids, and plant extracts for immunity, energy, and digestive health benefits. Bakery, confectionery, and dairy products integrate bioactives for clean-label reformulation and nutritional enhancement. Meat and poultry products show gradual uptake, primarily for natural antioxidants that improve shelf life and reduce synthetic additive use.
Key Growth Drivers
- Rising Consumer Shift Toward Natural and Functional Nutrition
The market benefits from a strong global shift toward natural, plant-derived ingredients that support preventive health, immune strength, and metabolic wellness. Consumers increasingly prefer functional foods enriched with polyphenols, flavonoids, phenolic acids, and lignans due to their antioxidant and anti-inflammatory properties. This transition accelerates demand across dietary supplements, fortified beverages, and clean-label products. Manufacturers incorporate bioactives into everyday consumption formats, strengthening penetration in mainstream nutrition. Expanding awareness of chronic disease prevention further amplifies adoption, positioning plant-based bioactives as essential components in modern health-focused product portfolios.
- For instance, Vegware’s “Close the Loop” service, which provides trade waste collections for customers in Central Belt Scotland, did process 10,000 binloads of used compostable packaging and food waste.
- Advancements in Extraction and Bioavailability Technologies
Innovations in green extraction, nanoencapsulation, and fermentation-based enhancement significantly boost the efficacy and stability of plant-derived bioactives. These technological advancements enable higher purity, controlled release, and improved absorption, making bioactives suitable for high-performance nutraceuticals, functional foods, and pharmaceutical formulations. Companies increasingly invest in R&D to refine solvent-free extraction and optimize yields from herbs, spices, and botanical sources. Enhanced bioavailability directly improves clinical outcomes and consumer acceptance, encouraging broader application across preventive healthcare, weight management, cognitive wellness, and metabolic support categories.
- For instance, Amcor’s Grace head features a 100% polyolefin construction, which makes the entire Wave 2CC pump a mono-material solution designed for recyclability where the appropriate infrastructure exists.
- Strong Expansion in Functional Food and Beverage Applications
Growing integration of plant-based bioactives into functional foods, beverages, dairy alternatives, and bakery products strengthens market expansion. Brands leverage bioactive-rich ingredients to develop products that target immunity, gut health, energy enhancement, and anti-aging benefits, meeting rising consumer expectations for multifunctional and natural offerings. The trend is further supported by lifestyle changes, urbanization, and the increasing adoption of premium wellness products. Widespread availability across supermarkets, online channels, and specialized nutrition outlets accelerates reach, while continuous product innovation ensures sustained market momentum.
Key Trends & Opportunities
- Growing Demand for Clean-Label and Sustainable Ingredient Sourcing
A major trend shaping the market is the rising emphasis on clean-label products that feature minimally processed and sustainably sourced plant ingredients. Consumers increasingly scrutinize supply chains and choose brands that demonstrate transparency, ethical sourcing, and reduced environmental footprints. This trend accelerates opportunities for suppliers adopting regenerative agriculture, organic cultivation, and traceable botanical sourcing. Companies that integrate sustainability certifications, eco-friendly extraction, and responsible harvesting practices gain a competitive edge while appealing to environmentally conscious buyers in global markets.
- For instance, Tetra Pak’s Tray Shrink 30 film-wrapper can handle 40 different tray sizes using a film as thin as 40 µm, aiming to minimize both material usage and electricity consumption.
- Rapid Adoption of Personalized Nutrition and Targeted Health Solutions
The market experiences strong opportunity growth from personalized nutrition platforms that use AI, biomarkers, and genetic insights to recommend bioactive-rich diets and supplements. Plant-based bioactives such as polyphenols, flavonoids, and stilbenes align well with personalized wellness because of their targeted benefits for immunity, inflammation control, metabolic health, and gut microbiome optimization. Brands increasingly offer customized formulations and subscription-based solutions tailored to individual health profiles. This trend strengthens high-value segments and supports premium product development across global markets.
- For instance, Berry’s B Circular Range now includes 35 distinct items (closures, jars, triggers etc.) that can use 30% to 100% post-consumer recycled (PCR) plastic per item.
- Expansion Into Pharmaceutical and Therapeutic Formulations
A growing pipeline of clinical research highlights the therapeutic potential of plant-derived bioactives in chronic disease management, creating new opportunities in pharmaceutical and medical nutrition applications. Bioactives demonstrate promising anti-cancer, anti-diabetic, neuroprotective, and cardioprotective effects, driving interest from drug developers and biomedical researchers. Companies invest in standardized, high-potency extracts and clinical validation to expand their regulatory approvals and therapeutic adoption. This trend positions plant-based bioactives as essential components in next-generation natural therapeutics.
Key Challenges
- Limited Standardization and Variability in Plant-Sourced Compounds
The market faces challenges due to variability in concentration, purity, and potency of bioactive compounds sourced from different plant species, geographies, and cultivation conditions. Inconsistent quality complicates formulation standardization and affects clinical efficacy and consumer trust. Manufacturers must invest in rigorous quality control, advanced analytical chemistry, and standardized extraction protocols to ensure reproducibility. Regulatory authorities also demand consistent specifications, making standardization critical for scaling applications across nutraceutical, food, and pharmaceutical categories.
- Regulatory Complexities and Lack of Harmonized Global Guidelines
Regulatory hurdles across regions pose significant challenges, as plant-based bioactives are governed by varying classifications—dietary ingredients, novel foods, botanical drugs, or functional additives. Differing approval frameworks, labeling requirements, and safety documentation slow product launches and increase compliance costs. Small and mid-sized manufacturers face heightened barriers due to extensive documentation, toxicology testing, and clinical validation needs. The lack of harmonized global guidelines limits cross-border commercialization and complicates the development of globally consistent formulations.
Regional Analysis
North America
North America holds around 32–34% share of the Plant-Based Bioactives Market, supported by strong consumer adoption of functional foods, dietary supplements, and clean-label nutrition products. The region benefits from high awareness of preventive healthcare, strong retail penetration, and rising demand for antioxidant-rich ingredients such as polyphenols, flavonoids, and lignans. Established nutraceutical and food manufacturers integrate bioactives into fortified beverages, plant-based proteins, and wellness formulations. Regulatory support for botanical ingredients and expanding clinical research further enhance market maturity. The presence of major brands and a highly health-conscious population continues to sustain regional leadership.
Europe
Europe accounts for approximately 28–30% share, driven by strong demand for natural ingredients, sustainability-focused sourcing, and strict quality standards that elevate the adoption of plant-derived bioactives. Consumers prefer organic, traceable, and scientifically validated ingredients widely used in supplements, functional bakery items, dairy alternatives, and herbal formulations. Well-established botanical traditions, combined with regulatory frameworks supporting standardized extracts, foster product innovation. The region’s aging population increasingly turns to bioactive-rich products for cardiovascular health, immunity, and anti-inflammatory benefits. Growing investments in advanced extraction technologies and green manufacturing processes enhance Europe’s competitive positioning in the global market.
Asia-Pacific
Asia-Pacific leads with a 34–36% market share, fueled by rapidly expanding functional food consumption, strong herbal medicine heritage, and rising demand for plant-based anti-inflammatory and antioxidant supplements. Countries such as China, India, Japan, and South Korea contribute significantly due to high population density, growing disposable incomes, and strong uptake of botanical ingredients in traditional and modern health products. Manufacturers benefit from abundant raw materials, including herbs, spices, oilseeds, and fruits. The region’s increasing focus on immunity, digestive wellness, and natural therapies accelerates adoption across food, nutraceutical, and pharmaceutical industries, consolidating its regional dominance.
Latin America
Latin America captures about 7–8% share, supported by growing interest in plant-based diets, herbal supplements, and antioxidant-rich beverage formulations. Brazil, Mexico, and Argentina serve as key markets due to strong biodiversity, expanding local nutraceutical manufacturing, and rising consumer inclination toward natural health solutions. Demand increases for bioactives sourced from native plants such as guarana, camu camu, acerola, and yerba mate. However, regulatory complexity and supply chain limitations moderate faster expansion. Investments in sustainable sourcing, improved extraction capabilities, and export-driven production strategies support steady market growth across the region.
Middle East & Africa
The Middle East & Africa region holds around 4–5% share, driven by gradual adoption of functional foods, wellness supplements, and herbal-based nutraceuticals. Rising lifestyle-related health conditions increase consumer focus on natural antioxidants, metabolic health products, and immunity-boosting ingredients. South Africa, UAE, and Saudi Arabia remain the primary growth hubs. Limited domestic manufacturing capacity leads to dependence on imports, but improving retail penetration and expanding health-conscious urban populations support demand growth. Investments in herbal agriculture, sustainable sourcing, and regional distribution networks contribute to a steady upward trajectory despite infrastructural challenges.
Market Segmentations:
By Product Type:
- Single vitamins
- Flavonoids
By Source:
- Fruit & vegetables
- Cereals & grains
By Application:
- Functional foods
- Functional beverages
By Geography
- North America
- Europe
- Germany
- France
- U.K.
- Italy
- Spain
- Rest of Europe
- Asia Pacific
- China
- Japan
- India
- South Korea
- South-east Asia
- Rest of Asia Pacific
- Latin America
- Brazil
- Argentina
- Rest of Latin America
- Middle East & Africa
- GCC Countries
- South Africa
- Rest of the Middle East and Africa
Competitive Landscape
The competitive landscape of the Plant-Based Bioactives Market players such as Bioretec Ltd., Pulpdent Corporation, Medtronic Inc., Arthrex, Inc., Lasak s.r.o, DePuy Synthes, Biomatlante, Zimmer Holding Inc., Bioactive Bone Substitutes Oy, and Stryker Corporation. the Plant-Based Bioactives Market is defined by a growing number of ingredient manufacturers, nutraceutical companies, and biotechnology firms that focus on delivering high-purity, clinically supported botanical compounds. Market participants prioritize innovation in extraction methods, including solvent-free, enzymatic, and supercritical CO₂ technologies, to improve yield, stability, and bioavailability. Companies increasingly invest in research to validate the health benefits of polyphenols, flavonoids, stilbenes, and lignans, enabling broader applications across functional foods, dietary supplements, and therapeutic products. Sustainability also shapes competitive strategies, with suppliers adopting traceable sourcing practices and regenerative agriculture to meet clean-label expectations. Strategic partnerships with food, beverage, and pharmaceutical brands help expand distribution networks and accelerate product commercialization. Continuous advancements in formulation, encapsulation, and customized blends further intensify competition and support differentiation in a rapidly growing global market.
Key Player Analysis
- Bioretec Ltd.
- Pulpdent Corporation
- Medtronic Inc.
- Arthrex, Inc.
- Lasak s.r.o
- DePuy Synthes
- Biomatlante
- Zimmer Holding Inc.
- Bioactive Bone Substitutes Oy
- Stryker Corporation
Recent Developments
- In June 2025, Better Dairy announced it is developing human osteopontin using precision fermentation with yeast strains. The company aims to produce this high-value protein at a competitive price for infant formula and explore applications in women’s health and healthy aging markets.
- In May 2025, FDA approved Galdieria extract blue derived from Galdieria sulphuraria for use in various food categories under good manufacturing practices, following a color additive petition from Fermentalg. The approval demonstrates regulatory progression for novel bioactive ingredients derived from microorganisms.
- In April 2025, California-based Eclipse Foods launched a non-dairy whole milk made from pea and chickpea proteins that aims to replicate the molecular structure of traditional dairy milk. This new product is designed to deliver on flavor, stability, and whiteness, with the ability to foam in both hot and cold temperatures, and is initially targeted towards foodservice partners like coffee shops and cafes.
- In September 2023, Novozymes A/S launched Vertera® ProBite, a biosolution that enhances the texture of plant-based meat alternatives, making them more appealing to consumers. The product addresses key consumer concerns about the texture and lengthy ingredient lists often associated with plant-based options.
Report Coverage
The research report offers an in-depth analysis based on Product Type, Source, Application and Geography. It details leading market players, providing an overview of their business, product offerings, investments, revenue streams, and key applications. Additionally, the report includes insights into the competitive environment, SWOT analysis, current market trends, as well as the primary drivers and constraints. Furthermore, it discusses various factors that have driven market expansion in recent years. The report also explores market dynamics, regulatory scenarios, and technological advancements that are shaping the industry. It assesses the impact of external factors and global economic changes on market growth. Lastly, it provides strategic recommendations for new entrants and established companies to navigate the complexities of the market.
Future Outlook
- The market will expand as consumers increasingly prefer natural, clean-label nutrition solutions for preventive health.
- Functional foods and beverages will integrate more plant-based bioactives as brands target immunity, gut health, and cognitive support.
- Advancements in extraction and encapsulation technologies will improve bioavailability and strengthen product performance.
- Companies will invest in sustainable and traceable sourcing to meet rising environmental and ethical expectations.
- Personalized nutrition platforms will accelerate demand for targeted bioactive formulations tailored to individual health needs.
- Regulatory clarity and harmonization will enhance global commercialization and encourage standardized product development.
- Pharmaceutical and medical nutrition applications will grow as clinical evidence supporting bioactive efficacy increases.
- Partnerships between nutraceutical brands and botanical ingredient suppliers will intensify to expand product portfolios.
- Asia-Pacific will maintain strong momentum due to abundant botanical resources and rising consumer awareness.
- Innovation in multi-functional blends will drive next-generation formulations across wellness, beauty, and therapeutic categories.


