Clear Aligners Market Overview:
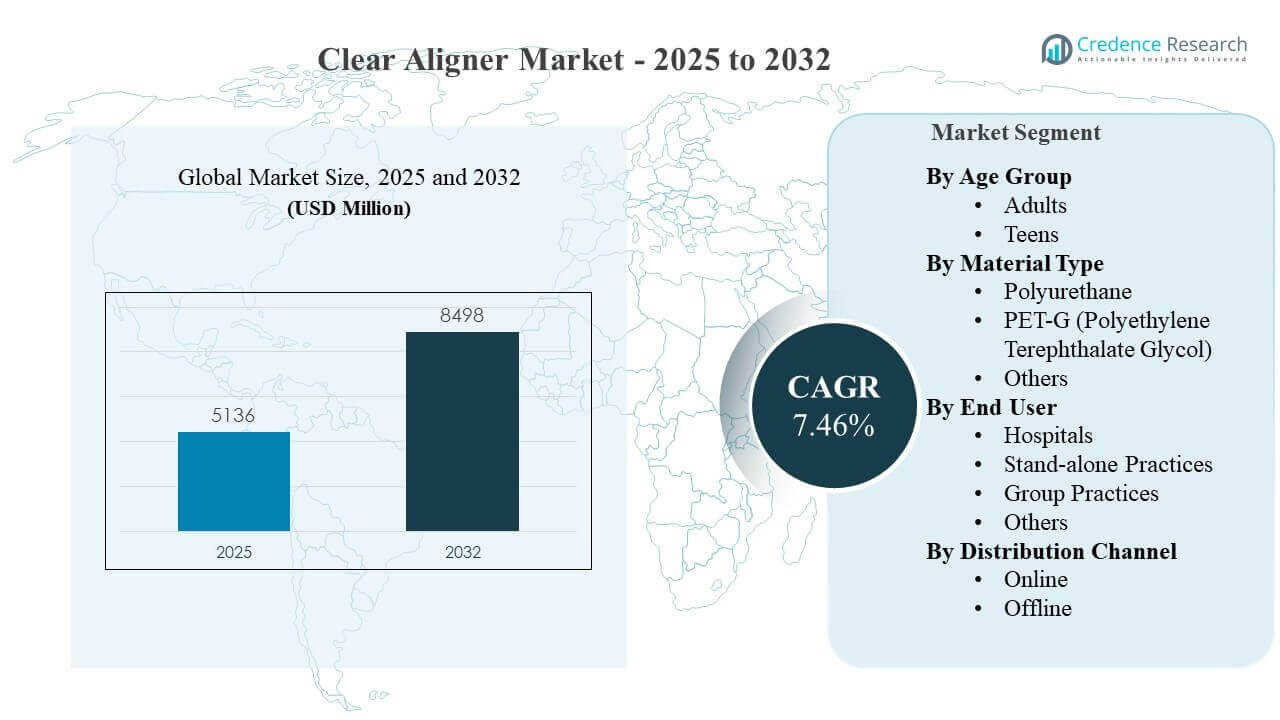
The global Clear Aligners Market size was estimated at USD 5,136 million in 2025 and is expected to reach USD 8,498 million by 2032, growing at a CAGR of 7.46% from 2025 to 2032. Demand is primarily driven by accelerating adoption of aesthetically discreet orthodontic solutions, supported by improvements in digital treatment planning and shorter chair-time workflows in dental practices. North America remains the largest revenue contributor as clinic density, patient affordability, and established orthodontic pathways continue to support higher treatment penetration.
| REPORT ATTRIBUTE | DETAILS |
|---|---|
| Historical Period | 2020-2024 |
| Base Year | 2025 |
| Forecast Period | 2026-2032 |
| Clear Aligners Market Size 2025 | USD 5,136 million |
| Clear Aligners Market, CAGR | 7.46% |
| Clear Aligners Market Size 2032 | USD 8,498 million |
Key Market Trends & Insights
- North America accounted for 41.6% of global revenue in 2025, reflecting stronger clinical adoption and patient willingness to pay for elective orthodontic care.
- Europe represented 27.0% share in 2025, supported by stable demand in adult orthodontics and expanding availability of Clear Aligners offerings across private clinics.
- Adults captured 73.2% share in 2025, as working-age consumers prioritize discreet appearance, predictable outcomes, and flexible appointment scheduling.
- Polyurethane held 65.9% share in 2025, benefiting from material performance characteristics that support consistent force delivery and durability over treatment cycles.
- Offline channels contributed 54.1% share in 2025, since clinician-led scanning, case initiation, and follow-up remain central to aligner therapy workflows.
Segment Analysis
Clear Aligners demand is shaped by a strong preference for discreet orthodontic correction, especially among adult consumers who value aesthetics and convenience across professional and social settings. The market benefits from digitized case workflows-such as intraoral scanning and treatment simulation-which improve acceptance by clarifying expected outcomes and supporting structured monitoring. Price sensitivity remains important, but financing options and broader clinic availability are reducing adoption barriers in mid-income patient pools.
Buyer behavior increasingly reflects a blend of clinic-led decision making and digital engagement, where patients compare treatment timelines, comfort, and confidence in clinician supervision before initiating therapy. Practice-level adoption also depends on throughput efficiency, scanner utilization, and reliable aligner manufacturing turnaround times. As provider networks expand and clinical planning becomes more standardized, demand is expected to broaden across general dentistry and orthodontic specialists.
By Age Group Insights
Adults accounted for the largest share of 73.2% in 2025. Adult demand is anchored in the preference for minimally visible orthodontic correction and treatment options that fit busy schedules. Higher willingness to pay for elective dental aesthetics supports sustained uptake in developed markets. Expanding digital diagnostics and more predictable treatment planning improve adult confidence in outcomes and reduce perceived risk.
By Material Type Insights
Polyurethane accounted for the largest share of 65.9% in 2025. Material leadership is supported by performance characteristics that enable consistent force delivery and durability across wear cycles. Manufacturers and clinics favor materials that balance transparency with mechanical strength to minimize remakes and improve patient satisfaction. Ongoing material engineering and process control also help aligner producers maintain quality consistency at scale.
By End User Insights
Stand-alone Practices accounted for the largest share of 59.8% in 2025. Independent dental and orthodontic practices remain the most common point of care for Clear Aligners initiation due to convenience, continuity, and streamlined case management. Chair-time efficiency and strong patient relationships support case conversion within these settings. Group practices are expanding through scale efficiencies, but adoption varies by market structure and referral patterns.
By Distribution Channel Insights
Offline accounted for the largest share of 54.1% in 2025. Clear Aligners therapy continues to rely on in-person clinical steps such as scans, fitting, adjustments, and compliance monitoring. Offline pathways also reinforce trust and reduce hesitation for first-time orthodontic patients. Online engagement is increasingly influential in lead generation and education, but clinician oversight remains the core decision driver for most treatment starts.
Clear Aligners Market Drivers
Rising demand for aesthetic orthodontics
Growing preference for discreet dental correction is a core driver of Clear Aligners adoption, particularly among adults seeking minimally visible treatment. The Clear Aligners Market benefits from higher acceptance of elective oral aesthetics and broader consumer awareness of aligner options. Treatment planning improvements have helped reduce uncertainty around results, which supports conversion. Greater comfort versus conventional braces also influences patient choice, especially for image-conscious demographics.
Digitization of orthodontic workflows
Wider adoption of intraoral scanners, digital planning, and simulation-driven treatment improves clinical predictability and supports consistent outcomes. Digital workflows reduce manual steps, shorten chair-time, and improve practice throughput, which raises provider willingness to promote aligners. Standardized planning and monitoring routines also support scalable operations across multi-site groups. This driver is especially important as clinics seek efficiency without compromising patient experience.
Expanding clinic networks and service availability
Growth in private dental networks and orthodontic capacity increases access to aligner therapy across urban and peri-urban areas. Stand-alone and group practices continue to widen service offerings to capture aesthetic dentistry demand. Referral pathways between general dentists and orthodontic specialists also improve patient conversion. As availability increases, adoption expands beyond early adopters to mainstream consumer segments.
- For instance, Aspen Dental states that its tech-driven Motto Clear Alignerss are available at 900 independently owned locations across 43 U.S. states, with precision digital scans and onsite lab support designed to let patients begin treatment on the first visit, showing how larger clinic footprints can widen access to aligner therapy.
Product innovation and material performance improvements
Material optimization and manufacturing control improve aligner durability, comfort, and transparency over treatment cycles. Better performance reduces remakes, increases patient satisfaction, and strengthens clinician confidence in predictable delivery. Continuous product refinement also supports broader case suitability and encourages repeat clinic usage. Innovation-led differentiation remains a key lever for competitive positioning across providers.
- For instance, Straumann’s ClearCorrect says its ClearQuartz tri-layer material is 4 times more tear resistant than single-layer polymers and retains 10 times more of its initial force than competitors, while its Performance Trimline is presented as improving treatment predictability versus scalloped designs.
Clear Aligners Market Challenges
Pricing and affordability remain meaningful barriers, especially in markets where orthodontic care is largely out-of-pocket. Treatment costs can delay purchase decisions and reduce conversion among price-sensitive consumers, even when demand is strong. In addition, outcomes depend heavily on patient compliance, and inconsistent wear behavior can lead to prolonged timelines and dissatisfaction. These factors can increase chair-time and follow-up intensity for providers.
- For instance, Align Technology’s Invisalign Full treatment in India typically ranges between ₹1.8 lakh and ₹3.5 lakh (~$2,200–$4,200), which is 2–3× the cost of conventional metal braces, limiting adoption among middle-income patients despite 28% YoY case growth in Tier-1 cities in 2024.
Clinical variability and competitive noise also challenge sustained growth. Differences in case selection, treatment planning quality, and monitoring discipline can create uneven outcomes across providers. Competition across brands and service models can confuse consumers, raising the importance of clinician trust and education. Regulatory and compliance requirements can slow entry into some markets, affecting commercialization timelines and operational scalability.
Clear Aligners Market Trends and Opportunities
Hybrid care models that combine strong digital engagement with clinician oversight are expanding, improving lead generation while maintaining clinical quality. Practices increasingly use digital tools to educate patients, visualize outcomes, and improve treatment acceptance. New opportunities also arise from broader penetration into mid-tier cities as scanning access, clinic presence, and financing options expand. This trend supports growth in regions with rising middle-class populations and expanding private dental infrastructure.
Opportunities are also emerging in workflow integration, where practices prioritize solutions that minimize operational friction and improve throughput. Interoperability with scanners, planning software, and practice management systems improves adoption, particularly for multi-site groups. Material innovation and manufacturing reliability create differentiation opportunities for suppliers targeting consistency, comfort, and transparency. These factors collectively support expansion across both mature and developing markets.
- For instance, Dentsply Sirona reports an internal analysis of more than 150,000 global SureSmile aligner cases (Jan 2021–Jun 2023), and a separate review where no refinements were required in 3 out of 4 SureSmile Aligner cases metrics that directly reflect planning accuracy and repeatability in integrated digital orthodontic workflows.
Regional Insights
North America
North America led the market with an adjusted 41.6% share in 2025, supported by strong orthodontic service availability and higher spending capacity for elective dental aesthetics. High clinic density and established treatment pathways increase patient access and reduce adoption friction. Practices emphasize predictable planning and efficient workflows, which supports case conversion. Innovation adoption is also strong, helping aligners remain a preferred aesthetic alternative to conventional braces.
Europe
Europe held an adjusted 27.0% share in 2025, reflecting stable demand across adult orthodontics and a broad base of private dental clinics. Consumer preference for discreet correction supports continued growth, particularly in urban markets. Adoption is reinforced by improving clinical workflow standardization and expanding availability of aligner therapy through specialists and general dentists. Competitive intensity drives providers to differentiate through patient experience and outcome predictability.
Asia Pacific
Asia Pacific captured an adjusted 19.6% share in 2025, driven by increasing awareness of orthodontic aesthetics and expanding private dental infrastructure. Rising disposable incomes and urbanization strengthen demand for aligner therapy among emerging middle-class consumers. The region’s growth is supported by expanding clinic networks and greater availability of digital diagnostics. Market development is also aided by increased consumer education and broader access to treatment financing options.
Latin America
Latin America accounted for an adjusted 7.3% share in 2025, with growth concentrated in major urban centers where private dental care demand is strongest. Adoption is supported by improving clinic availability and rising aesthetic dentistry awareness. Consumers remain price sensitive, making financing and value positioning important for conversion. Provider-led education and trust play a critical role in increasing uptake.
Middle East & Africa
The Middle East & Africa represented an adjusted 4.5% share in 2025, with adoption concentrated in higher-income urban markets and private healthcare hubs. Demand is supported by expanding dental clinic infrastructure and growing interest in aesthetic oral care. Variability in affordability and service availability remains a constraint in several countries. Growth opportunities are strongest where provider networks and consumer awareness programs are accelerating.
Competitive Landscape
Competition in the Clear Aligners Market is shaped by the ability to deliver predictable clinical outcomes, scale digital workflows, and support providers with efficient planning and manufacturing turnaround. Vendors compete through product performance, treatment planning ecosystems, and service support that reduces operational friction for clinics. Differentiation also depends on brand trust, clinical training, and the breadth of case suitability across patient profiles. Distribution strategy matters as companies balance clinic-first adoption with digital engagement to improve lead conversion.
Align Technology, Inc. is positioned as a leading participant through a large installed base, mature clinical workflow support, and continued investment in treatment planning and product refinement. The company’s approach emphasizes scalable digital orthodontics, supporting consistent case execution across diverse provider settings. Clinic enablement, training, and workflow efficiency remain central to sustaining adoption. Ongoing innovation also supports differentiation as competitors pursue improvements in materials, planning, and service models.
The industry research and growth report includes detailed analyses of the competitive landscape of the market and information about key companies, including:
- Align Technology, Inc.
- Straumann Group
- Dentsply Sirona
- Envista
- Henry Schein, Inc.
- Angelalign Technology Inc.
- 3M
- Patterson Companies, Inc.
- 3Shape A/S
- Shanghai Smartee Denti-Technology Co., Ltd.
- Graphy Inc.
- Argen Corporation
- TP Orthodontics, Inc.
- Scheu-Dental GmbH
Qualitative and quantitative analysis of companies has been conducted to help clients understand the wider business environment as well as the strengths and weaknesses of key industry players. Data is qualitatively analyzed to categorize companies as pure play, category-focused, industry-focused, and diversified; it is quantitatively analyzed to categorize companies as dominant, leading, strong, tentative, and weak.
Recent Developments
- In November 2025, Straumann Group expanded its existing collaboration with DentalMonitoring to integrate AI-powered remote treatment monitoring into ClearCorrect's platform. The first joint product ClearCorrect RemoteCare powered by DentalMonitoring was piloted at the end of 2025, with a global rollout planned for 2026.
- In October 2025, Shanghai Smartee Denti-Technology Co. Ltd. and Straumann Group announced a landmark strategic partnership aimed at co-developing a next-generation orthodontics platform. The collaboration includes joint innovation in Clear Aligners technologies, transfer of EMEA and APAC Clear Aligners manufacturing to Smartee to optimize Straumann's global production network, and a single-digit percentage equity investment by Straumann into Smartee.
- In April 2025, Ormco Corporation and DentalMonitoring launched an expanded partnership program, officially unveiled at the AAO 2025 Annual Session. Under this agreement, Ormco providers in North America using DentalMonitoring receive a 25% reduction in monitoring fees for newly initiated Ormco cases across all product categories, including the Spark Clear Aligners System.
Report Scope
| Report Attribute | Details |
| Market size value in 2025 | USD 5136 million |
| Revenue forecast in 2032 | USD 8498 million |
| Growth rate (CAGR) | 7.46% (2025–2032) |
| Base year | 2025 |
| Forecast period | 2026-2032 |
| Quantitative units | USD million |
| Segments covered | By Age Group Outlook: Adults, Teens; By Material Type Outlook: Polyurethane, PET-G (Polyethylene Terephthalate Glycol), Others; By End User Outlook: Hospitals, Stand-alone Practices, Group Practices, Others; By Distribution Channel Outlook: Online, Offline |
| Regional scope | North America, Europe, Asia Pacific, Latin America, Middle East & Africa |
| Key companies profiled | Align Technology, Inc.; Straumann Group; Dentsply Sirona; Envista; Henry Schein, Inc.; Angelalign Technology Inc.; 3M; Patterson Companies, Inc.; 3Shape A/S; Shanghai Smartee Denti-Technology Co., Ltd.; Graphy Inc.; Argen Corporation; TP Orthodontics, Inc.; Scheu-Dental GmbH |
| No. of Pages | 328 |
By Segmentation
By Age Group
- Adults
- Teens
By Material Type
- Polyurethane
- PET-G (Polyethylene Terephthalate Glycol)
- Others
By End User
- Hospitals
- Stand-alone Practices
- Group Practices
- Others
By Distribution Channel
- Online
- Offline
By Region
- North America
- U.S.
- Canada
- Mexico
- Europe
- Germany
- France
- U.K.
- Italy
- Spain
- Rest of Europe
- Asia Pacific
- China
- Japan
- India
- South Korea
- South-east Asia
- Rest of Asia Pacific
- Latin America
- Brazil
- Argentina
- Rest of Latin America
- Middle East & Africa
- GCC Countries
- South Africa
- Rest of the Middle East and Africa

Request a Free Sample
Fill in your details and we'll send you a free sample report.
- Sample data tables & charts
- Research methodology
Need a Custom Version of This Report?
Tailor the scope, geography, or segments to your exact requirements.
- Custom geography or segment scope
- Direct access to our analyst team
Frequently Asked Questions
What is the market size and forecast for the Clear Aligners Market?
What is the CAGR of the Clear Aligners Market?
Which segment holds the largest share in the Clear Aligners Market?
What factors are driving growth in the Clear Aligners Market?
Who are the leading companies in the Clear Aligners Market?
Which region commanded the largest share of the Clear Aligners Market in 2024?
Which region leads the Clear Aligners Market?
Table of Content
Chapter 1 Market Segmentation
- 1.1 Segmentation Framework
- 1.1.1 Product and Service Classification
- 1.1.2 Application and End-Use Classification
- 1.1.3 Technology and Solution Classification
- 1.1.4 Customer and Distribution Channel Classification
- 1.1.5 Geographic Segmentation
- 1.1.6 Market Segment Definitions and Boundaries
Chapter 2 Introduction
- 2.1 Report Objectives and Scope
- 2.2 Product Definition and Industry Terminology
- 2.3 Market Inclusions and Exclusions
- 2.4 Research Process
- 2.4.1 Primary Research and Expert Interviews
- 2.4.2 Secondary Research and Source Review
- 2.4.3 Top-Down and Bottom-Up Estimation
- 2.4.4 Data Triangulation and Verification
- 2.5 Market Size Measurement Basis
- 2.5.1 2025: USD 5,136 million → 2032: USD 8,498 million
- 2.6 Historical and Forecast Reference Periods
- 2.6.1 Base Year: 2025
- 2.6.2 Forecast Period: 2025-2032
- 2.7 Research Assumptions and Limitations
Chapter 3 Executive Summary
- 3.1 Market Snapshot and Key Findings
- 3.2 Base-Year Market Size, 2025
- 3.3 Forecast Market Size, 2032
- 3.4 Revenue and Volume Growth Outlook
- 3.5 Key Demand and Supply Indicators
- 3.6 Leading Market Segments
- 3.7 Fastest-Growing Market Opportunities
- 3.8 Regional Performance Highlights
- 3.9 Technology and Industry Transformation
- 3.10 Competitive Landscape Summary
- 3.11 Analyst View and Strategic Implications
Chapter 4 Global Clear Aligners Market Market Trends and Developments
- 4.1 Historical Industry Development
- 4.2 Recent Market Trends and Developments
- 4.3 Demand and Customer Behavior Trends
- 4.4 Technology and Product Innovation
- 4.5 Artificial Intelligence, Automation and Digitalization
- 4.6 Local Manufacturing and Supply Chain Realignment
- 4.7 Industry Partnerships, Mergers and Acquisitions
- 4.8 Sustainability and Circular Economy Developments
- 4.9 Government and Private Sector Investment Trends
- 4.10 Emerging Business Models and Commercialization
- 4.11 Industry Developments and Announcements
Chapter 5 Global Clear Aligners Market Market Production, Supply and Demand Analysis
- 5.1 Demand Trend and Consumption Analysis
- 5.2 Demand Forecast, 2025-2032
- 5.3 Production and Output Trend
- 5.4 Production and Output Forecast, 2025-2032
- 5.5 Installed Capacity and Capacity Utilization
- 5.6 Company-Wise Production Plants and Statistics
- 5.6.1 Installed Production Capacity
- 5.6.2 Actual Production
- 5.6.3 Planned Capacity and Expansion Targets
- 5.7 Supply Chain Structure and Procurement Trends
- 5.8 Supply-Demand Gap and Bottlenecks
- 5.9 Import Dependence and Sourcing Structure
- 5.10 Contract Manufacturing and Outsourcing
- 5.11 Regional Supply and Demand Concentration
Chapter 6 Global Clear Aligners Market Market Pricing Analysis
- 6.1 Pricing Structure and Measurement
- 6.2 Historical Pricing Trends
- 6.3 Pricing Outlook, 2025-2032
- 6.4 Average Selling Price and Unit Economics
- 6.5 Pricing by Product and Market Segment
- 6.6 Geographic Pricing Differences
- 6.7 Key Input, Energy, Labor and Logistics Costs
- 6.8 Contract Pricing and Purchasing Models
- 6.9 Pricing Sensitivity and Competitive Positioning
- 6.10 Price, Margin and Profitability Implications
Chapter 7 Global Clear Aligners Market Market Dynamics
- 7.1 Market Growth Drivers
- 7.1.1 Demand-Side Drivers
- 7.1.2 Technology and Innovation Drivers
- 7.1.3 Infrastructure and Investment Drivers
- 7.1.4 Regulatory and Policy Drivers
- 7.2 Market Restraints
- 7.2.1 Cost and Affordability Constraints
- 7.2.2 Technology and Adoption Barriers
- 7.2.3 Supply Chain and Operational Constraints
- 7.3 Market Challenges
- 7.3.1 Competitive Pressure and Margin Erosion
- 7.3.2 Skills, Infrastructure and Implementation Gaps
- 7.4 Emerging Market Opportunities
- 7.5 Market Dynamics Impact and Time-Horizon Assessment
Chapter 8 Global Clear Aligners Market Value Chain Analysis
- 8.1 Industry Value Chain Overview
- 8.2 Upstream Suppliers and Critical Inputs
- 8.3 Technology and Component Providers
- 8.4 Manufacturing or Service Delivery
- 8.5 Distribution, Channel Partners and Integrators
- 8.6 Downstream Applications and End Users
- 8.7 Value Addition and Profit Pools
- 8.8 Vertical Integration and Outsourcing
- 8.9 Supplier Concentration and Risk
- 8.10 Supply Chain Localization and Resilience
Chapter 9 Global Clear Aligners Market Market Regulations and Policies
- 9.1 Relevant Laws, Standards and Compliance Frameworks
- 9.2 Product, Service, Safety and Quality Requirements
- 9.3 Government Policies, Incentives and Subsidies
- 9.4 Imports, Exports and Trade Barriers
- 9.5 Public Procurement and Local Content Requirements
- 9.6 Environmental and Sustainability Compliance
- 9.7 Upcoming Policy Changes and Market Implications
Chapter 10 Global Clear Aligners Market Market Hotspots and Opportunities
- 10.1 Market Opportunity Mapping and Growth Hotspots
- 10.2 High-Growth Applications and Customer Groups
- 10.3 Underserved Markets and White-Space Opportunities
- 10.4 Emerging Technology and Product Opportunities
- 10.5 New Capacity and Investment Hotspots
- 10.6 Market Entry and Expansion Opportunities
- 10.7 Distribution and Partnership Opportunities
- 10.8 Near-Term and Long-Term Commercial Potential
- 10.9 Opportunity Attractiveness and Execution Risks
Chapter 11 Global Clear Aligners Market Market Outlook, 2025-2032
- 11.1 Market Size and Analysis
- 11.1.1 Revenue (Market Measurement: 2025: USD 5,136 million → 2032: USD 8,498 million)
- 11.1.2 Market Volume and Quantity Sold
- 11.1.3 Historical Market Size
- 11.1.4 Base-Year Market Size, 2025
- 11.2 Market Forecast, 2025-2032
- 11.2.1 Revenue Forecast to 2032
- 11.2.2 Volume Forecast to 2032
- 11.2.3 CAGR and Year-on-Year Growth
- 11.2.4 Incremental Revenue Opportunity
- 11.3 Forecast Assumptions and Scenario Analysis
- 11.3.1 Base-Case Forecast
- 11.3.2 Optimistic and Conservative Scenarios
- 11.3.3 Technology, Pricing and Policy Sensitivities
- 11.4 Market Attractiveness and Growth Outlook
Chapter 12 Global Clear Aligners Market Market Segmentation and Outlook
- 12.1 Segmentation Summary and Market Shares, 2025
- 12.2 Largest and Fastest-Growing Segments
- 12.3 Segment Growth Comparison
- 12.4 Segment Attractiveness and Priority Matrix
Chapter 13 Global Clear Aligners Market Geographic Market Outlook, 2025-2032
- 13.1 Regional Market Size and Share, 2025
- 13.2 Regional Market Forecast, 2025-2032
- 13.3 Regional Pricing, Production and Demand Differences
- 13.4 North America
- 13.4.1 United States
- 13.4.2 Canada
- 13.4.3 Mexico
- 13.5 Europe
- 13.5.1 Germany
- 13.5.2 France
- 13.5.3 Italy
- 13.5.4 United Kingdom
- 13.5.5 Spain
- 13.5.6 Poland
- 13.5.7 Russia
- 13.5.8 Netherlands
- 13.5.9 Belgium
- 13.5.10 Sweden
- 13.5.11 Denmark
- 13.5.12 Norway
- 13.5.13 Rest of Europe
- 13.6 Asia Pacific
- 13.6.1 China
- 13.6.2 India
- 13.6.3 Japan
- 13.6.4 South Korea
- 13.6.5 Thailand
- 13.6.6 Indonesia
- 13.6.7 Vietnam
- 13.6.8 Malaysia
- 13.6.9 Australia
- 13.6.10 Rest of Asia Pacific
- 13.7 Latin America
- 13.7.1 Brazil
- 13.7.2 Argentina
- 13.7.3 Colombia
- 13.7.4 Chile
- 13.7.5 Rest of Latin America
- 13.8 Middle East
- 13.8.1 Saudi Arabia
- 13.8.2 United Arab Emirates
- 13.8.3 Turkey
- 13.8.4 Israel
- 13.8.5 Iran
- 13.8.6 Rest of the Middle East
- 13.9 Africa
- 13.9.1 South Africa
- 13.9.2 Egypt
- 13.9.3 Nigeria
- 13.9.4 Morocco
- 13.9.5 Rest of Africa
- 13.10 Regional Investment, Policy and Supply Chain Differences
- 13.11 Regional Competitive Landscape
- 13.12 Geographic Growth Hotspots
Chapter 14 Global Clear Aligners Market Technology, Innovation and Sustainability Outlook
- 14.1 Technology Landscape and Maturity
- 14.2 Product, Process and Service Innovation
- 14.3 AI, Automation and Digital Tools in the Industry
- 14.4 Technology Adoption and Performance Benchmarking
- 14.5 Innovation Pipeline and R&D Investment
- 14.6 Patent and Intellectual Property Trends
- 14.7 Energy Efficiency and Resource Management
- 14.8 Sustainability, Recycling and Circularity
- 14.9 Technology Roadmap, 2025-2032
- 14.10 Risks of Obsolescence and Technology Substitution
Chapter 15 Global Clear Aligners Market Market Key Strategic Imperatives
- 15.1 Growth and Market Entry Priorities
- 15.2 High-Return Products and Segments
- 15.3 Pricing, Profitability and Cost Optimization
- 15.4 Technology Investment and Product Differentiation
- 15.5 Supply Chain Localization and Resilience
- 15.6 Distribution and Customer Acquisition
- 15.7 Partnership, Acquisition and Capacity Strategy
- 15.8 Regional Expansion Priorities
- 15.9 Short-, Medium- and Long-Term Actions
Chapter 16 Competition Outlook
- 16.1 Industry Competition Characteristics
- 16.2 Market Structure and Concentration
- 16.3 Market Share and Competitive Positioning, 2025
- 16.4 Company-Wise Revenue and Product Benchmarking
- 16.5 Production and Service Capacity Benchmarking
- 16.6 Technology, Pricing and Differentiation
- 16.7 Regional Footprint and Distribution Strength
- 16.8 Mergers, Acquisitions and Strategic Alliances
- 16.9 New Entrants and Competitive Threats
- 16.10 Porter's Five Forces and Industry Attractiveness
- 16.11 Competitive Outlook, 2025-2032
Chapter 17 Company Profiles
- 17.1 Company Coverage and Selection Criteria
- 17.2 Leading Market Participants – Standard Profile Structure
- 17.2.1 Business Description
- 17.2.2 Company Ownership and Geographic Presence
- 17.2.3 Product and Service Portfolio
- 17.2.4 Manufacturing and Operating Footprint
- 17.2.5 Production Capacity and Expansion Plans
- 17.2.6 Financial Performance and Investment
- 17.2.7 Market Share and Competitive Position
- 17.2.8 Technology and Innovation Capabilities
- 17.2.9 Strategic Alliances or Partnerships
- 17.2.10 Recent Developments
- 17.2.11 Growth Strategy and Outlook
- 17.3 Other Relevant Market Participants
Note: Every listed company is profiled on the structure shown under the first company. The company list is preliminary and may change based on research findings, market developments, data availability and client requirements.
Chapter 18 Disclaimer
- 18.1 Research and Forecast Disclaimer
- 18.2 Data Source and Estimation Limitations
Note: The depth of individual sections depends on data availability for this market. Volume, capacity, trade and other unit-based metrics are included where applicable.