Market Overview:
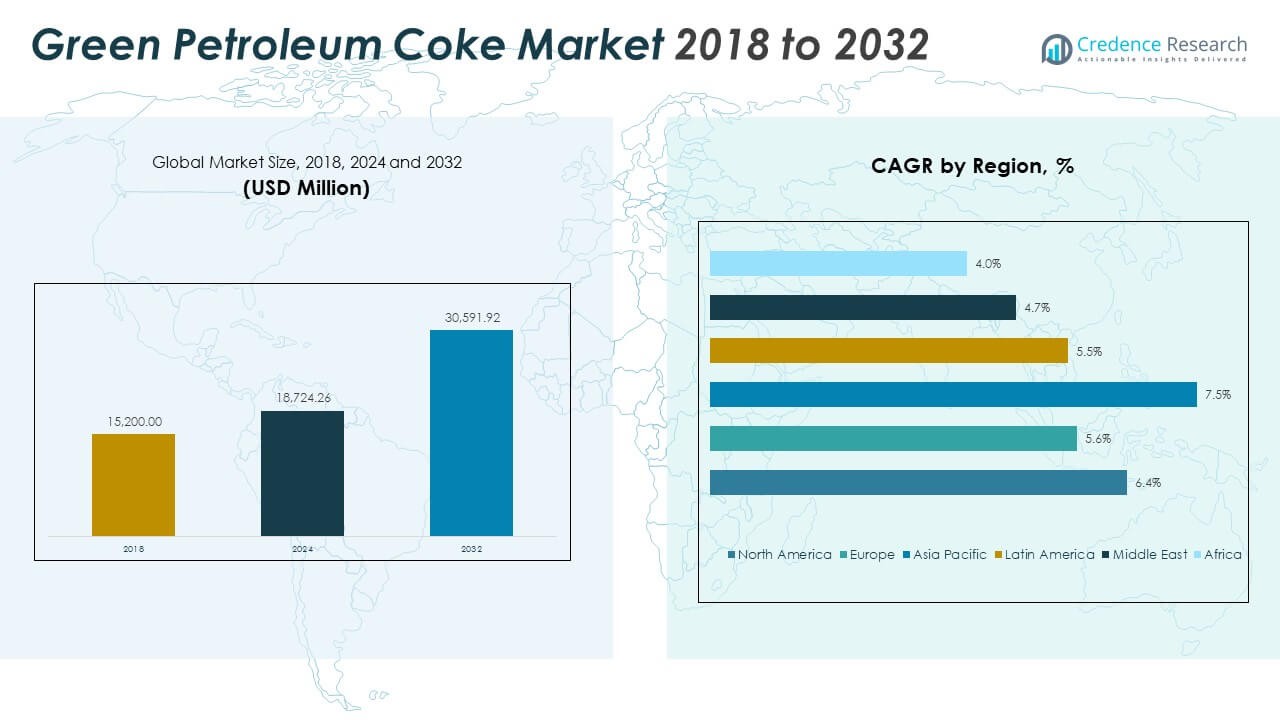
The Green Petroleum Coke Market size was valued at USD 15,200.00 million in 2018 to USD 18,724.26 million in 2024 and is anticipated to reach USD 30,591.92 million by 2032, at a CAGR of 6.40% during the forecast period.
| REPORT ATTRIBUTE |
DETAILS |
| Historical Period |
2020-2023 |
| Base Year |
2024 |
| Forecast Period |
2025-2032 |
| Green Petroleum Coke Market Size 2024 |
USD 18,724.26 Million |
| Green Petroleum Coke Market, CAGR |
6.40% |
| Green Petroleum Coke Market Size 2032 |
USD 30,591.92 Million |
Market growth is driven by increasing demand for aluminum, steel, and cement production. Green petroleum coke plays a key role as a fuel and carbon additive in these sectors. Industries prefer it for its high carbon content, low ash, and strong thermal efficiency. Rising infrastructure development, energy-intensive manufacturing, and the expansion of refining capacity further enhance production and utilization. Ongoing investment in low-sulfur, eco-friendly grades supports compliance with environmental standards and ensures sustainable industrial growth.
Asia Pacific leads the market due to rapid industrialization and strong demand from China and India. North America follows, supported by advanced refining infrastructure and consistent exports. Europe shows steady growth driven by strict environmental regulations and increasing demand for low-sulfur fuel alternatives. Emerging markets in Latin America, the Middle East, and Africa are expanding as industrialization, energy projects, and metal production accelerate, strengthening their contribution to global market development.
Access crucial information at unmatched prices!
Request your sample report today & start making informed decisions powered by Credence Research Inc.!
Download Sample
Market Insights:
- The Green Petroleum Coke Market was valued at USD 15,200.00 million in 2018, reached USD 18,724.26 million in 2024, and is projected to attain USD 30,591.92 million by 2032, growing at a CAGR of 6.40% during the forecast period.
- Asia Pacific leads with a 30.7% share due to industrial expansion in China and India supported by large aluminum, cement, and power generation capacities.
- North America follows with 31.9% share, driven by advanced refining infrastructure and strong export activity across the United States and Canada. Europe holds 25.2% share, supported by low-sulfur fuel demand and environmental regulations.
- Asia Pacific is the fastest-growing region, supported by refinery modernization, manufacturing investments, and infrastructure development across emerging economies.
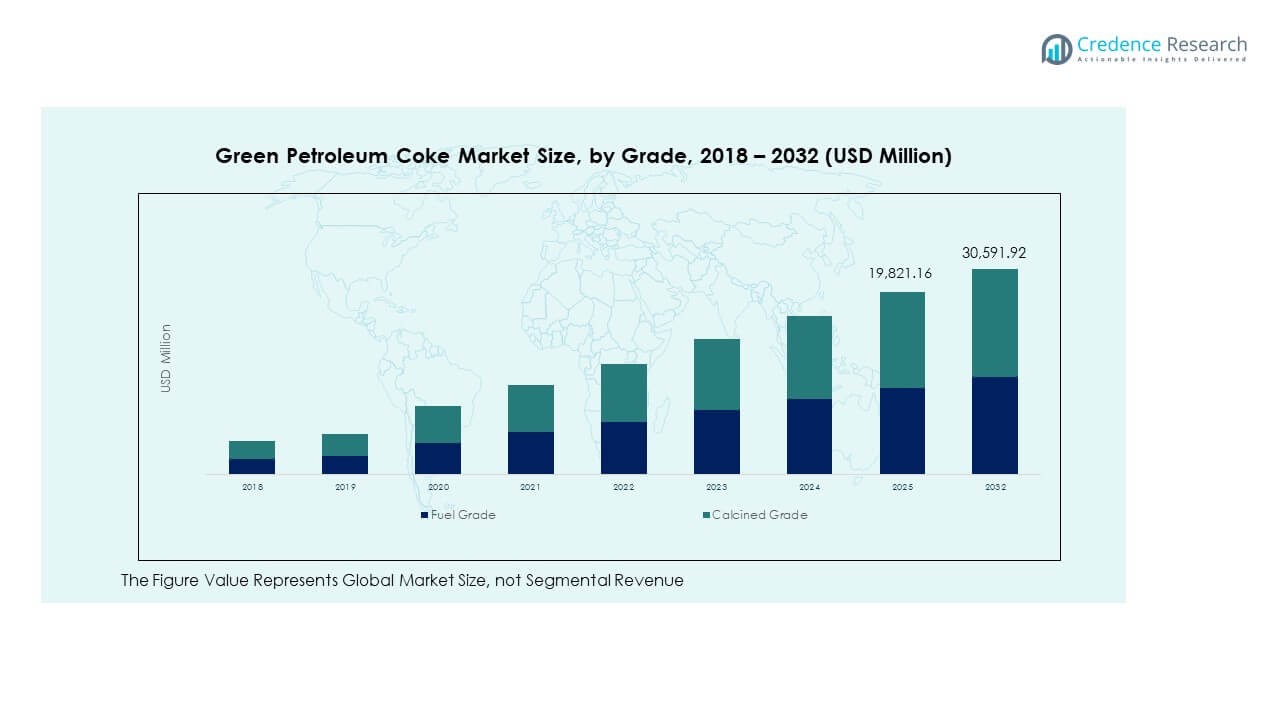
- Based on grade segmentation, fuel grade accounts for roughly 55% of total market revenue, while calcined grade represents 45%, reflecting rising demand for high-purity carbon materials in industrial applications.
Market Drivers
Rising Aluminum Production Driving Fuel and Carbon Demand
Expanding aluminum production acts as a key growth driver for the Green Petroleum Coke Market. It is extensively used as a carbon additive and fuel in anode manufacturing for aluminum smelting. The growing demand for lightweight automotive components and electric vehicles drives aluminum consumption worldwide. Industries rely on calcined green coke due to its high carbon purity and low ash content. Increasing production efficiency in smelters strengthens long-term market adoption. The availability of low-cost petroleum coke supports economic feasibility in large-scale operations. Major aluminum-producing countries like China and India continue to expand refining capacity. Global infrastructure investment further enhances material demand for construction and transportation sectors.
- For example, the commissioning of the 400,000-ton-per-year green aluminum smelter by Aluminum Corporation of China Limited (CHALCO) in Yunnan Province in early 2024 is authentic. This project is part of China’s initiative to enhance sustainable aluminum production, utilizing Yunnan’s abundant hydropower resources.
Rising Demand in Cement and Power Generation Industries
The cement and power generation industries remain crucial contributors to the Green Petroleum Coke Market. Cement kilns utilize high-carbon green coke as a cost-effective alternative to coal. The fuel’s strong thermal properties improve energy conversion efficiency and kiln temperature stability. Power plants integrate green coke into mixed-fuel systems to reduce costs and emissions. Increased urbanization drives cement consumption across developing economies. Rapid construction of residential and industrial buildings elevates clinker production. The growing shift toward alternative fuels promotes utilization of petroleum coke in energy generation. Governments supporting industrial energy optimization aid sustained market growth.
Expansion of Global Refining Capacity and Product Availability
Expanding global refining capacity strengthens supply stability for the Green Petroleum Coke Market. Modern refineries invest in delayed coking units that enhance conversion efficiency. These upgrades generate higher yields of low-sulfur, high-quality green coke. The integration of automated process monitoring ensures consistent product characteristics. Refining advancements in Asia and the Middle East improve operational flexibility. The rising number of complex refineries diversifies product grades suited for varied applications. It benefits both domestic use and exports to high-demand regions. Enhanced refinery throughput supports steady long-term supply reliability for downstream users.
Environmental Regulations Promoting Cleaner Industrial Fuels
Growing environmental awareness promotes adoption of cleaner fuels in heavy industries, driving the Green Petroleum Coke Market. Industries seek carbon-efficient options with lower sulfur emissions. Green coke processed through desulfurization technologies meets stricter emission norms. Stringent government regulations in Europe and North America enforce cleaner production standards. Refiners implement advanced scrubbing systems to minimize environmental impact. The focus on circular carbon economy encourages recycling of refinery byproducts into valuable energy sources. Continuous R&D investment ensures eco-friendly utilization without compromising fuel efficiency. Sustainability-driven initiatives by major refineries improve global acceptance of green coke in industrial applications.
- For instance, in September 2025, ExxonMobil signed a 15-year agreement with AtmosClear for carbon capture and storage at its Baton Rouge facility. This partnership will store up to 680,000 metric tons of biogenic CO₂ annually by 2029. The agreement supports ExxonMobil’s progress with large-scale decarbonization infrastructure and helps meet evolving environmental regulations.
Market Trends
Integration of Calcined Coke in Electric Vehicle Battery Manufacturing
The integration of calcined green coke in EV battery production represents a major trend in the Green Petroleum Coke Market. Manufacturers use it as a key carbon precursor in anode materials for lithium-ion batteries. The shift toward renewable mobility increases demand for carbon-rich conductive materials. Battery makers prioritize coke with low impurity content to ensure long cycle life. Refineries are investing in precision calcination and material purification technologies. It aligns with the global push for cleaner mobility solutions. Partnerships between refineries and battery producers strengthen raw material traceability. Technological synergies across refining and energy storage sectors create new commercial avenues.
Growing Adoption of AI-Based Refining and Product Quality Control
AI-based process optimization is transforming production and quality management in the Green Petroleum Coke Market. Refineries deploy predictive analytics to monitor temperature, sulfur levels, and density in real time. Intelligent control systems minimize deviations and energy losses during coking. This ensures consistent fuel performance for industrial end users. Data-driven optimization reduces waste and enhances energy recovery from feedstock. Manufacturers implement digital twins to simulate and refine production parameters. Automation improves workforce efficiency and predictive maintenance scheduling. The adoption of such technologies reduces downtime and operational costs. Digital transformation strengthens competitiveness among global refining companies.
- For instance, ExxonMobil implemented digital twin and AI-driven data lake technologies in its refineries across 2024, enabling real-time analysis of over 6 trillion operational data points and achieving a 10% reduction in energy use and notable maintenance cost savings in their “smart refinery” initiative.
Shift Toward Low-Sulfur and Environmentally Compliant Grades
The shift toward low-sulfur, environmentally compliant grades continues to shape the Green Petroleum Coke Market. Environmental norms across multiple regions limit emissions from heavy fuels. Producers focus on advanced desulfurization processes and improved feedstock blending. These practices enhance product acceptance among eco-conscious industries. Cement and metal producers prefer low-sulfur coke to meet sustainability targets. Market participants explore hydrotreatment and gasification technologies to reduce contaminants. Strategic investments in emission control infrastructure improve compliance. The preference for greener fuel substitutes drives innovation in coke processing. Regulatory incentives for low-emission production reinforce long-term demand for premium-grade coke.
- For instance, Phillips 66 Company’s Lake Charles Refinery reduced sulfur dioxide (SO₂) emissions through investments in flare gas recovery systems and sulfur recovery units. These efforts support the long-term supply of low-sulfur coke, meeting federal emission standards and contributing to the growing demand for green petroleum coke in industrial applications.
Increased Cross-Border Trade and Refining Integration
The growing integration of global refining and export trade influences the Green Petroleum Coke Market. Countries with large refining bases expand exports to meet global demand for industrial fuel. Strategic alliances between refiners and logistics firms improve supply chain efficiency. Port infrastructure modernization enables faster coke handling and distribution. Export-oriented refineries in Asia and the Middle East gain market share. Rising international demand from aluminum and cement sectors enhances trade volumes. Governments invest in refining hubs to strengthen export competitiveness. The trend promotes regional interdependence in energy markets. It also supports diversified sourcing for industrial consumers worldwide.
Market Challenges Analysis
Stringent Environmental Regulations and Emission Control Mandates
Stringent emission control mandates remain a major challenge for the Green Petroleum Coke Market. Regulatory authorities in developed economies impose strict sulfur and carbon emission limits. Compliance costs increase as producers install advanced filtration and desulfurization systems. These measures elevate operational expenditure and affect refinery profitability. Limited availability of low-sulfur crude restricts high-grade coke production. Energy-intensive processes further complicate sustainable production efforts. The transition to cleaner energy sources intensifies competition with alternative fuels. Smaller refineries struggle to meet compliance standards within tight deadlines. Continuous monitoring and certification requirements extend the regulatory burden on producers.
Fluctuating Feedstock Prices and Volatile Global Oil Market
Fluctuating feedstock prices and oil market instability pose risks to the Green Petroleum Coke Market. Refining margins depend on crude availability and global demand-supply dynamics. Price volatility disrupts production planning and export contracts. Economic slowdowns reduce industrial fuel demand across end-use sectors. Currency fluctuations impact profitability in international trade transactions. The dependence on refinery byproducts links market stability to crude oil trends. Limited storage and transport infrastructure further restrict inventory management flexibility. Industry participants adopt hedging strategies to mitigate financial risk exposure. Supply inconsistencies in oil-producing nations continue to create uncertainty in long-term planning.
Market Opportunities
Advancements in Carbon Processing Technologies and Material Utilization
Technological advancements in carbon processing create new opportunities in the Green Petroleum Coke Market. Innovations in calcination, gasification, and purification enhance product value and reduce emissions. Integration of waste heat recovery systems improves production efficiency. Carbon nanomaterial development from green coke opens pathways in high-performance composites. Growing investment in R&D strengthens downstream application diversity. Collaborations between chemical and energy firms expand carbon utilization ecosystems. Emerging carbon-neutral refining technologies attract sustainability-focused investors. This transition supports profitable growth aligned with environmental standards.
Emerging Demand in Developing Economies and Infrastructure Expansion
Rising industrialization in developing nations offers strong opportunities for the Green Petroleum Coke Market. Expanding steel, cement, and power generation sectors drive large-scale consumption. Government-backed infrastructure projects across Asia and Africa elevate long-term fuel requirements. Refinery modernization programs improve production capacity and product quality. Strategic investments by global players support local supply chains. The integration of green coke in renewable energy and metallurgy enhances its industrial relevance. Regional partnerships for technology sharing and sustainable fuel adoption promote competitive market positioning. This dynamic growth environment ensures expanding opportunities across emerging economies.
Market Segmentation Analysis:
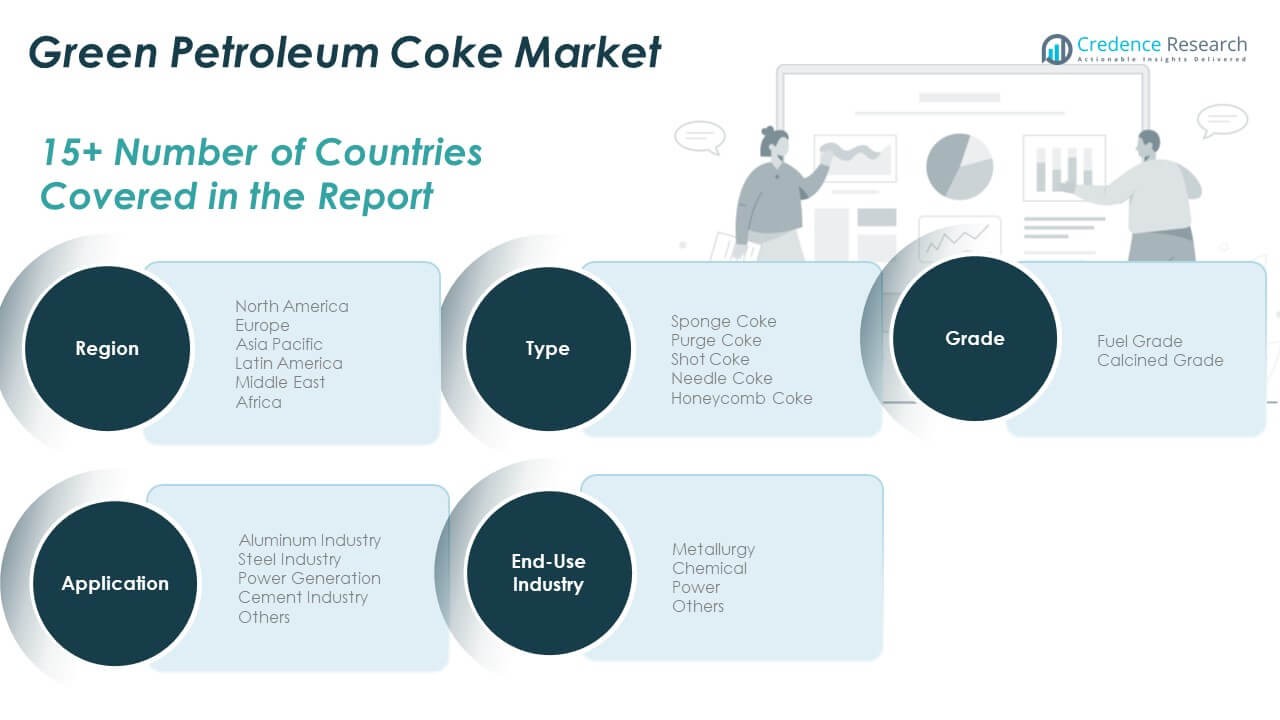
The Green Petroleum Coke Market is divided into segments by type, application, end-use industry, and grade.
By type, sponge coke dominates due to its high carbon concentration and low impurity level, which make it ideal for aluminum smelting. Purge and shot coke are widely used in cement and power sectors for fuel applications, while needle coke remains essential for electrode manufacturing in steel production. Honeycomb coke supports niche uses requiring structural stability and heat resistance. Each type caters to specific industrial needs, ensuring broad product utilization across energy and metallurgical processes.
- For instance, Rain Carbon Inc. is a leading global supplier of calcined petroleum coke (CPC), providing critical raw materials for aluminum smelters, including consistent high-purity CPC used in anodes for the electrolytic smelting process required to produce primary aluminum.
By application, the aluminum industry leads demand, followed by steel, where calcined-grade coke is a key input for electrode production. Power generation and cement industries use fuel-grade coke for energy-efficient operations, while other sectors adopt it for cost-effective heating.
- For instance, in May 2025, ADNOC and Emirates Global Aluminium (EGA) signed a five-year, $500 million agreement for the supply of up to 1.5 million tonnes of calcined petroleum coke from ADNOC’s Ruwais Refinery—covering at least 30% of EGA’s petcoke requirements and securing supply for EGA’s aluminum smelting operations in the UAE.
By end-use industry, metallurgy dominates consumption, with chemical and power industries contributing steadily.
By grade, fuel-grade coke leads in volume, while calcined-grade coke gains traction in high-purity applications requiring superior conductivity and performance.
Segmentation:
By Type
- Sponge Coke
- Purge Coke
- Shot Coke
- Needle Coke
- Honeycomb Coke
By Application
- Aluminum Industry
- Steel Industry
- Power Generation
- Cement Industry
- Others
By End-Use Industry
- Metallurgy
- Chemical
- Power
- Others
By Grade
- Fuel Grade
- Calcined Grade
By Region
- North America
- Europe
- Germany
- France
- U.K.
- Italy
- Spain
- Rest of Europe
- Asia Pacific
- China
- Japan
- India
- South Korea
- South-east Asia
- Rest of Asia Pacific
- Latin America
- Brazil
- Argentina
- Rest of Latin America
- Middle East & Africa
- GCC Countries
- South Africa
- Rest of the Middle East and Africa
Regional Analysis
North America
The North America Green Petroleum Coke Market size was valued at USD 4,924.80 million in 2018 to USD 5,984.16 million in 2024 and is anticipated to reach USD 9,761.94 million by 2032, at a CAGR of 6.4% during the forecast period. North America accounts for nearly 31.9% of the global market share. The region’s growth is driven by strong refining capacity and high demand from the aluminum and steel industries. The United States leads production, supported by advanced coking technologies and export-oriented refining operations. Canada contributes through steady expansion in energy and metallurgical applications. The region’s emphasis on low-sulfur, fuel-grade coke enhances market sustainability. Investments in refinery modernization and environmental compliance promote long-term competitiveness. It benefits from proximity to major end-use industries, ensuring consistent consumption and trade growth across key industrial hubs.
Europe
The Europe Green Petroleum Coke Market size was valued at USD 3,935.28 million in 2018 to USD 4,656.21 million in 2024 and is anticipated to reach USD 7,178.48 million by 2032, at a CAGR of 5.6% during the forecast period. Europe holds a 25.2% share of the global market. The region’s growth is shaped by the demand for calcined coke in steel and aluminum industries. Countries like Germany, France, and Italy lead consumption due to established metallurgical facilities. Refinery upgrades improve coke quality and reduce sulfur emissions. Stringent environmental policies encourage the use of cleaner, energy-efficient fuel grades. It benefits from an integrated supply network linking major industrial clusters. European manufacturers focus on sustainable refining practices to align with regional emission standards. Ongoing industrial decarbonization efforts continue to shape product demand across the continent.
Asia Pacific
The Asia Pacific Green Petroleum Coke Market size was valued at USD 4,514.40 million in 2018 to USD 5,764.18 million in 2024 and is anticipated to reach USD 10,226.90 million by 2032, at a CAGR of 7.5% during the forecast period. The region dominates with a 30.7% share of the global market. China and India drive growth through massive aluminum, cement, and power generation capacities. Rising infrastructure projects and industrialization amplify demand for fuel and calcined grades. Japan and South Korea adopt advanced refining technologies to improve product consistency. It benefits from large-scale investments in refining and smelting operations. Regional producers leverage export advantages to meet global industrial demand. Strong policy support for manufacturing expansion strengthens the region’s market presence. Rapid economic development across Southeast Asia further supports long-term growth.
Latin America
The Latin America Green Petroleum Coke Market size was valued at USD 1,033.60 million in 2018 to USD 1,261.83 million in 2024 and is anticipated to reach USD 1,923.31 million by 2032, at a CAGR of 5.5% during the forecast period. Latin America represents 6.3% of the global market share. Brazil dominates regional production, driven by its growing steel and cement sectors. Refineries in Mexico and Argentina enhance output through process efficiency improvements. Expanding construction and industrial activity fuel demand for energy-efficient fuels. It benefits from regional initiatives to optimize refinery operations and export performance. Integration of petroleum coke in power and metallurgical industries supports economic diversification. The rise in infrastructure investments across urban centers promotes steady consumption growth. Sustainable industrialization policies ensure continued regional market advancement.
Middle East
The Middle East Green Petroleum Coke Market size was valued at USD 471.20 million in 2018 to USD 535.39 million in 2024 and is anticipated to reach USD 768.03 million by 2032, at a CAGR of 4.7% during the forecast period. The region contributes 4.1% to the global market share. GCC countries lead production through heavy investment in refining infrastructure. Saudi Arabia and the UAE strengthen supply chains with integrated petrochemical facilities. It benefits from increasing demand for high-carbon fuels in aluminum and power industries. Regional refiners focus on upgrading delayed coking units for enhanced product yield. Ongoing diversification of downstream industries supports broader consumption. Competitive production costs improve export prospects across global markets. Policy initiatives supporting industrial expansion continue to sustain market growth.
Africa
The Africa Green Petroleum Coke Market size was valued at USD 320.72 million in 2018 to USD 522.48 million in 2024 and is anticipated to reach USD 733.27 million by 2032, at a CAGR of 4.0% during the forecast period. The region holds a 1.8% share of the global market. South Africa leads demand due to its growing metallurgy and cement sectors. Egypt contributes through energy and power projects using fuel-grade coke. Limited refining capacity restricts large-scale production, creating import dependency. It benefits from rising regional investments in industrial energy solutions. Infrastructure growth and urban development drive incremental fuel demand. Global partnerships aid technology transfer to improve refining efficiency. Government-backed initiatives for industrial modernization stimulate gradual market expansion across the continent.
Shape Your Report to Specific Countries or Regions & Enjoy 30% Off!
Key Player Analysis:
- Oxbow Corporation
- AMINCO Resources LLC
- Asbury Carbons
- Aluminium Bahrain (Alba)
- Atha Group
- Carbograf Industrial S.A. de C.V.
- Rain Carbon Inc.
- Minmat Ferro Alloys Private Limited
- Shandong KeYu Energy Co., Ltd.
- Weifang Lianxing New Material Technology Co., Ltd.
- Linyi Zhenhua Carbon Technology Co., Ltd.
- Sinoway Carbon Co., Ltd.
- BP America, Inc.
- CNOOC Limited
Competitive Analysis:
The Green Petroleum Coke Market features strong competition among global and regional producers focusing on product quality, technological efficiency, and supply reliability. Leading players such as Oxbow Corporation, Rain Carbon Inc., BP America Inc., Aluminium Bahrain (Alba), and AMINCO Resources LLC dominate through extensive refining integration and global export networks. It emphasizes advancements in delayed coking technologies and desulfurization processes to achieve high-purity grades. Companies expand calcination capacity to serve aluminum and steel industries with consistent carbon output. Strategic mergers and partnerships enhance refinery throughput and strengthen global distribution. Regional firms in China and India gain presence through cost-effective production and long-term supply contracts. Product diversification, compliance with emission norms, and customer-focused supply models define competitive positioning. Continuous investment in cleaner production and digital refinery control systems ensures sustained leadership in evolving industrial markets.
Recent Developments:
- In October 2025, Shandong KeYu Energy Co., Ltd. implemented a price increase for its petroleum coke products on October 27, marking a key market move to adjust for growing demand and operational inputs. This price adjustment was documented across industry reports and aligns with the rise in demand for low-sulfur green petroleum coke in advanced manufacturing sectors throughout Asia.
- In September 2025, Fastmarkets launched two new low-sulfur green petroleum coke price assessments for the Europe and India regions. These developments provide manufacturers, such as Rain Carbon Inc. and Shandong KeYu Energy Co., Ltd., with enhanced pricing transparency for sourcing high-purity, low-sulfur raw materials required by battery, electrode, and specialty metals producers.
Report Coverage:
The research report offers an in-depth analysis based on Type, Application, End-Use Industry and Grade. It details leading market players, providing an overview of their business, product offerings, investments, revenue streams, and key applications. Additionally, the report includes insights into the competitive environment, SWOT analysis, current market trends, as well as the primary drivers and constraints. Furthermore, it discusses various factors that have driven market expansion in recent years. The report also explores market dynamics, regulatory scenarios, and technological advancements that are shaping the industry. It assesses the impact of external factors and global economic changes on market growth. Lastly, it provides strategic recommendations for new entrants and established companies to navigate the complexities of the market.
Future Outlook:
- Global refining advancements will continue improving yield and quality consistency in green petroleum coke production.
- Expanding aluminum smelting capacity will sustain long-term demand for calcined-grade coke worldwide.
- Growing steel manufacturing in Asia will strengthen trade flows for electrode-grade coke.
- Rising investments in clean fuel technologies will push refiners toward low-sulfur production methods.
- Integration of carbon recovery systems will enhance refinery energy efficiency and reduce emissions.
- Digital refinery management will optimize production costs and improve traceability across supply chains.
- Strategic mergers between refinery operators and carbon processors will expand market reach.
- Increasing infrastructure and industrialization projects in emerging economies will boost regional consumption.
- Circular economy initiatives will promote utilization of petroleum coke byproducts in sustainable industries.
- Continuous innovation in calcination and purification will strengthen competitiveness in high-value industrial sectors.


