Market Overview
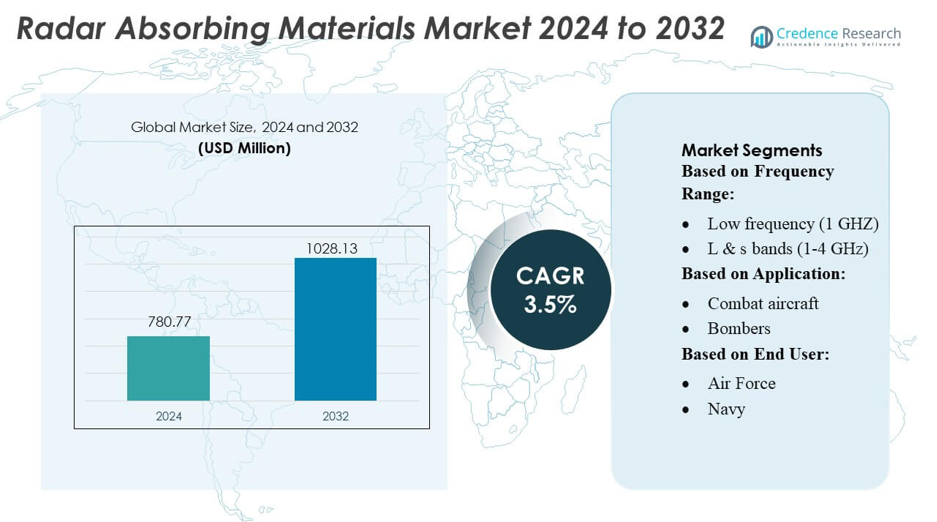
Radar Absorbing Materials Market size was valued USD 780.77 million in 2024 and is anticipated to reach USD 1028.13 million by 2032, at a CAGR of 3.5% during the forecast period.
| REPORT ATTRIBUTE |
DETAILS |
| Historical Period |
2020-2023 |
| Base Year |
2024 |
| Forecast Period |
2025-2032 |
| Radar Absorbing Materials Market Size 2024 |
USD 780.77 million |
| Radar Absorbing Materials Market, CAGR |
3.5% |
| Radar Absorbing Materials Market Size 2032 |
USD 1028.13 million |
The Radar Absorbing Materials market is dominated by key players including UES Promura, EP Minerals, Jaycot Industries, Fentex Ltd., ANSELL LTD, Meltblown Technologies Inc., Complete Environmental Products, Kimberly-Clark, TOLSA, and Johnson Matthey. These companies focus on continuous innovation, strategic collaborations, and development of advanced multi-band and broadband RAM solutions to strengthen their market positions. North America emerges as the leading region, accounting for approximately 28% of the global market, driven by substantial defense spending, advanced military platforms, and high R&D investment. The region’s strong demand for stealth technologies in aerospace and naval applications, coupled with technological advancements in lightweight composites and nanomaterials, ensures sustained growth. Leading players leverage their technical expertise, strategic partnerships, and product quality differentiation to maintain competitiveness and address diverse defense, aerospace, and industrial applications across North America and other key markets.
Market Insights
- The Radar Absorbing Materials market was valued at USD 780.77 million in 2024 and is projected to reach USD 1028.13 million by 2032, growing at a CAGR of 3.5% during the forecast period.
- North America holds the largest market share at approximately 28%, driven by high defense spending, advanced military platforms, and strong R&D investment, while Asia-Pacific is the fastest-growing region due to increasing defense modernization and aerospace initiatives.
- Multi-band and broadband RAM solutions are trending, with lightweight composites, carbon-based materials, and nanomaterials gaining adoption across aerospace, naval, and defense sectors.
- Market growth is supported by continuous innovation, strategic collaborations, and partnerships among leading players to strengthen product portfolios and technological capabilities, while stringent cost and manufacturing complexities act as restraints.
- Key market segments by application include aerospace, defense, and industrial uses, with growing demand for stealth technologies and advanced radar cross-section reduction solutions driving adoption globally.
Access crucial information at unmatched prices!
Request your sample report today & start making informed decisions powered by Credence Research Inc.!
Download Sample
Market Segmentation Analysis:
By Frequency Range
The radar-absorbing materials market shows strongest demand in the X-band (8–12 GHz), which accounts for the dominant share as it supports advanced fire-control, missile-guidance, and surveillance systems. Its leadership stems from widespread integration in modern fighter aircraft, naval radars, and precision-guided munitions. Growing adoption of Ku, K & Ka bands (12–40 GHz) further accelerates market activity as high-frequency stealth coatings enhance target discrimination and reduce backscatter in compact platforms. Millimeter-wave (>40 GHz) materials gain traction in next-generation seekers and imaging radars, driven by miniaturisation needs and low-observable performance across broad operational environments.
- For instance, Ku, K & Ka bands (12–40 GHz) further accelerates market activity as high-frequency stealth coatings enhance target discrimination and reduce backscatter in compact platforms.
By Application
Military aircraft remain the dominant application segment, holding the largest market share due to extensive use of RAM in combat aircraft and UAVs to reduce radar cross-section and enhance survivability in contested airspace. Demand intensifies with upgrades to bombers and advanced unmanned platforms requiring lightweight, thermally stable absorbers. Naval vessels—particularly surface ships with integrated mast systems—also adopt multilayer RAM to minimise detectability. Ground systems and missiles utilise thin-film absorbers for signature suppression, while civilian applications such as EMI/RFI shielding and anechoic chambers steadily expand due to rising electromagnetic compliance requirements.
- For instance, ISRO satellite such as GSAT-2 weighed approximately 1,825 kg at launch, while satellites in the INSAT-4 series (e.g., INSAT-4B) weighed over 3,000 kg at launch. Both classes of satellites commonly employed a 440 N liquid apogee motor along with sixteen 22-N reaction control thrusters for both orbit-raising and attitude control tasks.
By End User
Defense end users—led by the Air Force—hold the largest share, driven by continuous procurement of stealth-enhanced aircraft, UAVs, and precision weapons requiring high-performance RAM. The Navy follows with investments in low-observable coatings for surface combatants and submarine masts to reduce detection range. The Army increases adoption in mobile radar systems and armoured vehicles for battlefield signature management. In aerospace, military programs dominate, while commercial aerospace uses RAM for antenna isolation and EMI reduction. Space applications grow as satellite payloads integrate lightweight absorbers to manage signal reflections and thermal stresses in high-frequency bands.
Key Growth Drivers
Increasing Defense Modernization and Stealth Programs
The rising emphasis on defense modernization and stealth technology is a primary driver for the radar-absorbing materials (RAM) market. Nations are investing heavily in next-generation combat aircraft, UAVs, and naval vessels to achieve low observability against advanced radar systems. For instance, advanced multilayer RAM coatings are integrated into fighter jets and submarines to reduce radar cross-section, enhancing survivability in contested environments. Continuous upgrades and retrofitting of existing platforms further boost demand, positioning RAM as a critical material in modern defense and aerospace programs worldwide.
For instance, Siemens’ digital twin and model‐based systems engineering (MBSE) solution for aerospace reports a 96% on-time delivery rate and a 90% reduction in labor hours during conceptual design.
Technological Advancements in Material Science
Rapid innovations in nanomaterials, carbon-based composites, and metamaterials drive the RAM market by offering superior absorption efficiency, thermal stability, and lightweight designs. Advanced polymer composites and ferrite-based absorbers enable broader frequency coverage and enhanced stealth performance, supporting multiple operational scenarios. Manufacturers focus on integrating RAM with minimal impact on platform weight, fuel efficiency, and structural integrity. These technological breakthroughs not only expand applications in military systems but also open avenues in aerospace, space, and civilian electromagnetic interference (EMI) shielding, stimulating market growth across industries.
For instance, OMRON announced its NX 502 automation controller features data-collection jitter of 1 µs or less and a data-transfer capacity roughly 4× that of its prior equivalent class.
Expanding Civil and Aerospace Applications
Beyond defense, growth is fueled by increasing civilian and aerospace applications. EMI/RFI shielding in telecommunications, anechoic chambers for testing, and radar isolation in commercial aircraft create significant demand for RAM solutions. Satellites and space systems increasingly incorporate lightweight absorbers to manage signal reflections and thermal challenges in high-frequency bands. This cross-industry adoption diversifies the market base, allowing manufacturers to leverage both defense and commercial opportunities. The convergence of military-grade performance with commercial requirements drives innovation, scale, and higher deployment of radar-absorbing materials globally.
Key Trends & Opportunities
Development of Broadband and Multi-Band Absorbers
A prominent trend is the development of broadband and multi-band RAM capable of operating across diverse frequency ranges. This allows a single material solution to enhance stealth across X, Ku, K, and Ka bands, reducing the need for multiple coatings and simplifying maintenance. Multi-frequency absorbers are increasingly adopted in advanced UAVs, naval vessels, and missile systems to counter evolving radar threats. Opportunities lie in leveraging nanotechnology and metamaterials to optimize absorption efficiency, weight reduction, and thermal resilience, thereby meeting both military and aerospace platform requirements.
For instance, Emerson’s Paine™ 212 miniature-satellite pressure transmitter has a low mass of just 75 grams (2.64 ounces) maximum. It is designed to operate up to 5,000 psia (344 bar). The device is specifically designed for orbital environments with a radiation hardening/rating to 100 kRad (Si) total dose.
Integration with Lightweight and Flexible Composites
RAM manufacturers increasingly focus on lightweight, flexible composites suitable for complex geometries and unmanned platforms. Thin-film absorbers, flexible polymer layers, and carbon-based materials offer adaptability without compromising structural integrity. This trend supports integration into next-generation fighter jets, drones, and mobile radar systems, where weight and aerodynamics are critical. The opportunity exists for further innovation in conformal coatings and deployable absorbers that enhance performance while reducing installation and operational costs, strengthening market growth potential across multiple defense and aerospace applications.
For instance, Honeywell’s next-generation Reaction Wheel Assembly (HC-RWA) supports spacecraft from 150 kg to 700 kg and builds on more than 2,500 small-satellite units already in flight.
Expansion into Space and Satellite Systems
RAM adoption in space and satellite systems is emerging as a lucrative opportunity. Lightweight, thermally stable absorbers reduce reflections, enhance signal integrity, and support high-frequency communications in satellite payloads. With increasing satellite launches for communication, navigation, and defense purposes, manufacturers can cater to specialized space-grade requirements, including extreme temperature resistance and minimal outgassing. The trend toward miniaturized satellite constellations further drives demand for compact, high-efficiency RAM, creating new avenues for research, product differentiation, and strategic partnerships between defense and commercial aerospace sectors.
Key Challenges
High Production and Material Costs
One of the primary challenges in the RAM market is the high cost of raw materials, advanced composites, and specialized manufacturing processes. Carbon-based nanomaterials, ferrites, and metamaterials require precise fabrication and quality control, which increases production expenses. This cost factor can limit adoption, particularly for budget-constrained defense projects or commercial applications. Balancing performance with cost-efficiency remains critical, necessitating innovation in scalable manufacturing techniques, alternative materials, and recycling methods to maintain profitability while meeting stringent operational requirements.
Technical Complexity and Integration Issues
Integrating radar-absorbing materials into complex platforms presents technical challenges, including maintaining structural integrity, thermal stability, and aerodynamic performance. Multi-layered coatings, thickness variations, and conformal designs require precise engineering and extensive testing. Additionally, RAM performance can degrade under extreme environmental conditions, reducing reliability. Addressing these integration complexities demands advanced simulation tools, rigorous quality assurance, and collaborative design between material scientists and system engineers. Overcoming these challenges is essential to ensure consistent performance, extend service life, and support widespread adoption in defense, aerospace, and commercial sectors.
Regional Analysis
North America:
The North American RAM market is estimated to hold approximately 28% of the global market, driven by robust defense budgets in the U.S. and Canada. Advanced military platforms, including stealth aircraft and naval vessels, are increasing demand for high-performance RAM solutions. Significant investments in research and development are fostering innovation in lightweight and broadband materials, enabling enhanced radar cross-section reduction. Strategic collaborations between defense contractors and material manufacturers further accelerate market growth. Technological advancements, particularly in composite-based and nanomaterial RAM, are positioning North America as a dominant player, with ongoing procurement programs ensuring sustained demand through 2035.
Europe:
Europe accounts for roughly 22% of the global RAM market, fueled by defense modernization initiatives across NATO countries and growing aerospace applications. Nations such as the U.K., Germany, and France are investing in next-generation stealth systems, including fighter jets and naval assets, which require advanced radar-absorbing coatings and composites. The market is also supported by collaborations among European material research institutes and defense contractors, accelerating innovation in multi-band and lightweight RAM. Environmental regulations are prompting the development of eco-friendly, recyclable materials without compromising electromagnetic performance, ensuring Europe maintains a strategic edge in high-performance RAM deployment across military and civilian aerospace sectors.
Asia-Pacific:
Asia-Pacific is emerging as a significant RAM market, capturing approximately 30% of global share, driven by expanding defense spending in China, India, South Korea, and Japan. Rapid military modernization, indigenous stealth aircraft programs, and naval vessel upgrades are fueling demand for advanced RAM solutions. The region benefits from increasing collaborations between domestic manufacturers and global technology providers to produce broadband and multi-layered RAM. Additionally, rising investments in aerospace and defense R&D are fostering innovation in carbon-based and metamaterial RAM. Government support, strategic partnerships, and indigenous production initiatives position Asia-Pacific as the fastest-growing regional market for radar-absorbing technologies.
Middle East & Africa (MEA):
The MEA RAM market accounts for an estimated 12% of global share, driven by increasing defense modernization programs in the Gulf Cooperation Council (GCC) countries. Rising procurement of advanced fighter jets, unmanned aerial vehicles, and naval vessels is accelerating adoption of radar-absorbing coatings and composites. Strategic partnerships with European and U.S. defense manufacturers enhance technological capabilities in the region. Investments in localized production facilities and training programs are supporting long-term growth. Furthermore, regional geopolitical dynamics and the need for advanced stealth technologies in border and maritime security applications ensure sustained demand, making MEA an increasingly strategic market for radar-absorbing material solutions.
Latin America:
Latin America represents approximately 8% of the global RAM market, with growth driven primarily by military modernization initiatives in Brazil, Chile, and Mexico. Demand for stealth-capable platforms, including naval and airborne systems, supports the adoption of radar-absorbing coatings and composite materials. Government focus on domestic defense manufacturing and technological collaborations with North American and European material suppliers is fostering market development. Limited regional R&D infrastructure is being offset by partnerships with global material technology companies. Despite slower growth compared to Asia-Pacific and North America, Latin America continues to invest strategically in RAM solutions to enhance its defense capabilities and ensure operational readiness across diverse terrains and maritime domains.
Shape Your Report to Specific Countries or Regions & Enjoy 30% Off!
Market Segmentations:
By Frequency Range:
- Low frequency (1 GHZ)
- L & s bands (1-4 GHz)
By Application:
By End User:
By Geography
- North America
- Europe
- Germany
- France
- U.K.
- Italy
- Spain
- Rest of Europe
- Asia Pacific
- China
- Japan
- India
- South Korea
- South-east Asia
- Rest of Asia Pacific
- Latin America
- Brazil
- Argentina
- Rest of Latin America
- Middle East & Africa
- GCC Countries
- South Africa
- Rest of the Middle East and Africa
Competitive Landscape
The Radar Absorbing Materials market include UES Promura, EP Minerals, Jaycot Industries, Fentex Ltd., ANSELL LTD, Meltblown Technologies Inc., Complete Environmental Products, Kimberly-Clark, TOLSA, and Johnson Matthey. The Radar Absorbing Materials market is highly competitive, driven by continuous innovation and the growing demand for advanced stealth and defense solutions. Companies are focusing on developing multi-band and broadband RAM with enhanced electromagnetic performance, lightweight composites, and cost-efficient production techniques. Strategic initiatives such as mergers, acquisitions, and technology partnerships are being employed to expand market presence and gain access to emerging regions. Additionally, investment in research and development for nanomaterials, carbon-based composites, and environmentally friendly coatings is intensifying. Differentiation through product quality, customization, and technical support remains critical, enabling firms to address diverse applications in aerospace, defense, and industrial sectors while maintaining a strong competitive edge in a rapidly evolving market.
Key Player Analysis
- UES Promura
- EP Minerals
- Jaycot Industries
- Fentex Ltd.
- ANSELL LTD
- Meltblown Technologies Inc.
- Complete Environmental Products
- Kimberly-Clark
- TOLSA
- Johnson Matthey
Recent Developments
- In April 2025, Wafr Technologies launched in Canada, aiming to build net-zero AI data centres using a proprietary PCM-based passive liquid cooling system, which reportedly offers over 80% energy savings by eliminating chillers and refrigerants.
- In February 2025, Plaksha University and Tabreed India began a pilot project implementing PCM-thermal energy storage (TES) for sustainable night-cooling, storing cooling energy during the day and discharging at night to reduce grid dependence and emissions.
- In August 2024, SCGC launched a decarbonization solution in Thailand, deploying PCM-based thermal energy storage to cut carbon emissions and enable sustainable cooling in industrial and commercial sectors.
- In January 2023, Chrono Chape, one of the leading independent providers of on-site self-leveling screeds in France, has been acquired by Holcim. These fluid functions create a smooth foundation upon which builders can lay the floor’s finish such as tile or carpet.
Report Coverage
The research report offers an in-depth analysis based on Frequency Range, Application, End-User and Geography. It details leading market players, providing an overview of their business, product offerings, investments, revenue streams, and key applications. Additionally, the report includes insights into the competitive environment, SWOT analysis, current market trends, as well as the primary drivers and constraints. Furthermore, it discusses various factors that have driven market expansion in recent years. The report also explores market dynamics, regulatory scenarios, and technological advancements that are shaping the industry. It assesses the impact of external factors and global economic changes on market growth. Lastly, it provides strategic recommendations for new entrants and established companies to navigate the complexities of the market.
Future Outlook
- Demand for advanced RAM solutions will increase with rising defense modernization programs globally.
- Multi-band and broadband materials will gain prominence to meet diverse operational requirements.
- Development of lightweight and flexible composites will drive adoption across aerospace and naval platforms.
- Investments in nanomaterials and metamaterials will enhance RAM performance and efficiency.
- Emerging economies will contribute to significant market growth due to expanding military capabilities.
- Strategic collaborations and partnerships will accelerate innovation and market penetration.
- Eco-friendly and sustainable materials will see growing adoption in response to environmental regulations.
- Technological advancements will support next-generation stealth aircraft, drones, and naval vessels.
- Integration of RAM with smart sensors and electronic systems will create new application opportunities.
- Continuous R&D efforts will maintain competitive differentiation and stimulate long-term market expansion.


