
Air Quality Monitoring System Market Overview:
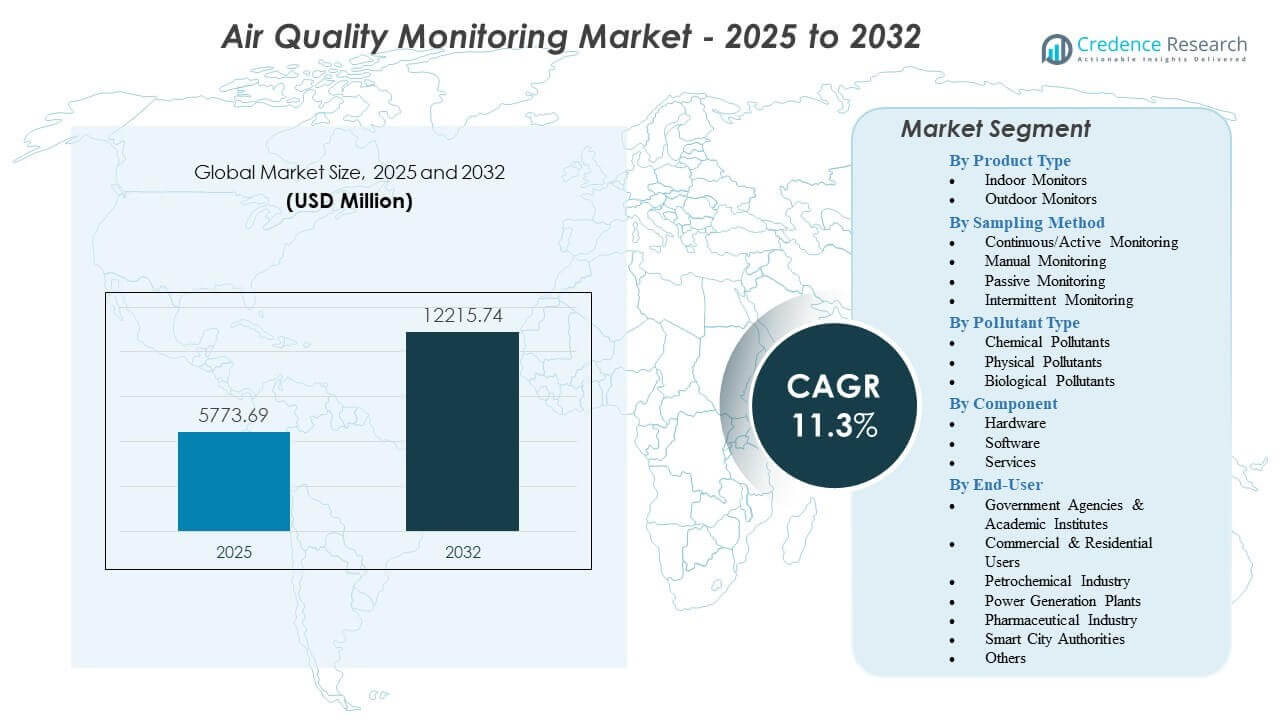
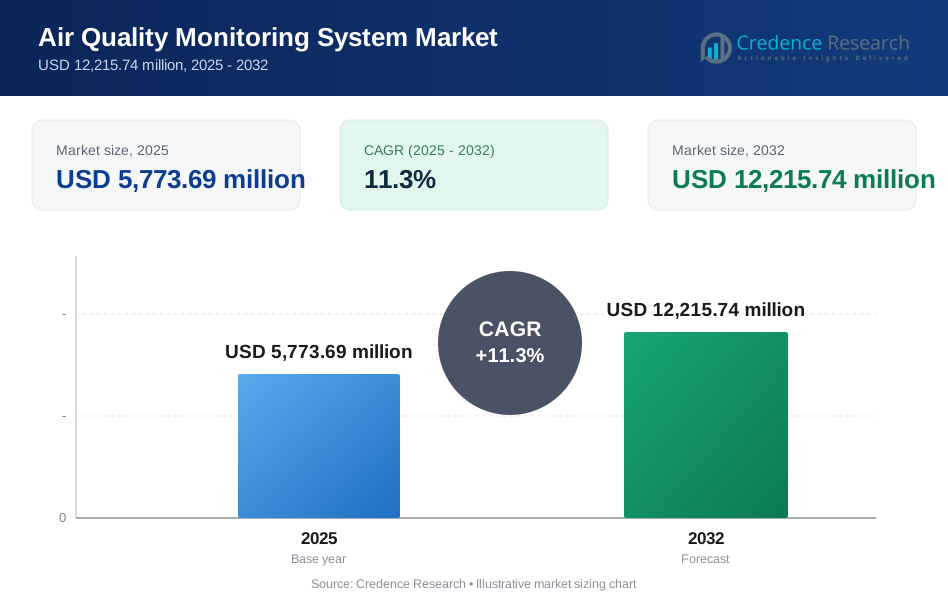
The Air Quality Monitoring System Market is projected to grow from USD 5,773.69 million in 2025 to an estimated USD 12,215.74 million by 2032, with a compound annual growth rate (CAGR) of 11.3% from 2025 to 2032.
| REPORT ATTRIBUTE | DETAILS |
|---|---|
| Historical Period | 2020-2023 |
| Base Year | 2024 |
| Forecast Period | 2025-2032 |
| Air Quality Monitoring System Market Size 2025 | USD 5,773.69 million |
| Air Quality Monitoring System Market , CAGR | 11.3% |
| Air Quality Monitoring System Market Size 2032 | USD 12,215.74 million |
Strong drivers support expansion as pollution levels rise and urbanization increases exposure to harmful pollutants. Governments enforce emission limits and require continuous reporting, which leads industries to modernize legacy systems. Adoption grows as digital platforms offer automated insights that improve decision-making for compliance and environmental planning. Public health concerns encourage households, schools, and hospitals to install compact sensors for safer indoor environments. Smart city development strengthens deployments of interconnected monitoring networks that support early warnings and risk mitigation efforts.
North America leads the market due to strong regulations, established monitoring networks, and early adoption of high-precision systems across industrial and urban settings. Europe follows with strict emission standards and broader implementation of national environmental surveillance programs. Asia-Pacific emerges as the fastest-growing region as rapid industrialization and rising pollution levels encourage governments to expand air quality infrastructure. Latin America and the Middle East show growing adoption driven by urban population growth and increased investment in environmental protection initiatives.
Air Quality Monitoring System Market Insights:
- The Air Quality Monitoring Market is projected to grow from USD 5,773.69 million in 2025 to USD 12,215.74 million by 2032 at an 11.3% CAGR, driven by rising deployment across public, industrial, and residential settings.
- Growing regulatory pressure, real-time reporting needs, and higher pollution exposure encourage wider use of advanced indoor and outdoor monitoring systems.
- High installation costs, calibration requirements, and limited technical capacity in developing regions continue to restrict broader adoption.
- North America leads the market due to strong enforcement and established monitoring grids, while Europe maintains steady growth with strict emission standards.
- Asia-Pacific emerges as the fastest-growing region driven by industrial expansion, rising pollution levels, and large-scale government investments in monitoring infrastructure.
Air Quality Monitoring System Market Drivers
Growing Regulatory Enforcement and Compliance Pressure Across Industrial and Urban Environments
Stricter environmental rules strengthen market adoption across major economies. Governments require industries to track pollutants with higher accuracy and transparent reporting. Many facilities upgrade legacy systems to avoid penalties and maintain certification. The Air Quality Monitoring Market gains strong momentum from this regulatory push. Real-time reporting tools support compliance teams that handle emission audits. Public agencies expand national monitoring grids to track pollution events. Urban authorities deploy roadside stations to measure traffic emissions. Industries use these systems to support risk management and operational planning. Regulators push firms to adopt continuous monitoring instead of periodic checks.
- For instance, Teledyne API’s T640 PM analyzer is approved as a S. EPA Federal Equivalent Method (FEM) and provides 1-minute continuous PM data, enabling facilities to meet strict compliance audits.
Rising Health Concerns Linked to Pollution Exposure Across Urban and Rural Populations
Growing awareness of pollution-related illness drives strong demand for monitoring systems. Respiratory disorders rise in cities facing traffic congestion and industrial growth. Rural zones experience higher exposure during seasonal burning and dust events. Consumers demand real-time data that supports personal health decisions. The Air Quality Monitoring Market benefits from wider interest in pollution prevention tools. Healthcare agencies rely on monitoring outputs to develop public health alerts. Community groups request air quality insights to guide local programs. Schools and residential buildings install low-cost sensors to improve safety. Governments invest in dense sensor networks to track vulnerable zones.
Expansion of Smart City Programs and Digital Infrastructure Supporting Integrated Pollution Surveillance
Smart city initiatives encourage deployment of connected air monitoring systems. Urban planners use advanced sensors to support mobility, waste control, and climate goals. Digital dashboards collect large datasets that guide policy and enforcement. The Air Quality Monitoring Market supports integrated platforms across multiple city functions. Edge devices help local agencies respond faster to pollution spikes. IoT-enabled stations reduce manual maintenance needs. Smart poles and street assets host compact sensors that cover wider areas. Data-driven planning supports long-term investment decisions. Authorities adopt these technologies to build resilient and healthier cities.
- For instance, Siemens’ City Performance Tool integrates sensor inputs and models urban emissions to evaluate over 70 environmental KPIs, helping cities optimize mobility and air quality interventions.
Advancements in Sensor Technologies and Analytics Improving Accuracy and System Efficiency
Modern sensors provide stronger sensitivity and longer operational life. Cloud analytics help users extract insights that improve environmental planning. Machine learning models support pollution forecasting and source identification. The Air Quality Monitoring Market gains value from this technological progress. Mobile sensors create flexible options for field teams. Wearable devices track personal exposure levels with high precision. Compact samplers extend usage to indoor and confined environments. Firms reduce downtime due to automated calibration features. Technology providers expand offerings to serve industrial and community customers.
Air Quality Monitoring System Market Trends
Shift Toward Low-Cost Sensors and Distributed Monitoring Networks in Urban and Industrial Zones
Low-cost sensors support wider adoption across community groups and small firms. Cities deploy dense grids to reduce data gaps between fixed stations. Distributed networks improve understanding of localized pollution patterns. The Air Quality Monitoring Market reflects strong movement toward compact devices. Industries use low-cost units to support internal audits and early alerts. Schools, offices, and homes deploy these systems for indoor safety. Municipal programs expand citizen-led pollution mapping initiatives. Cloud platforms help merge data from multiple sensor types. This shift supports broader accessibility across developing markets.
- For instance, Aeroqual’s low-cost AQY Micro Sensor provides minute-by-minute PM2.5 and NO₂ readings, validated to meet S. EPA guideline performance levels, enabling dense urban deployments.
Growing Integration of AI and Predictive Analytics for Real-Time Pollution Management
AI tools help identify pollution sources with higher precision. Predictive models estimate changes linked to traffic flow, climate shifts, and industrial cycles. Real-time analytics help authorities implement quick response measures. The Air Quality Monitoring Market benefits from platforms that support automated insights. Industrial facilities use predictive alerts to prevent emission breaches. Urban teams use forecasting models to plan mobility restrictions. AI-driven dashboards help improve public messaging strategies. Integration with weather models increases accuracy across regions. Organizations value systems that reduce manual interpretation.
- For instance, BreezoMeter’s AI-driven dispersion engine processes over 680 million pollution data points daily to deliver street-level AQI with predictive alerts for urban planners and health agencies.
Increasing Adoption of Mobile, Portable, and Wearable Monitoring Solutions Across New User Groups
Portable devices support flexible deployment across outdoor events, construction zones, and emergency operations. Wearables gain acceptance among athletes, commuters, and vulnerable groups. Mobile stations help researchers study pollution hotspots in detail. The Air Quality Monitoring Market expands with such user-focused innovations. Emergency teams rely on portable monitors during fire or chemical events. Construction firms use handheld meters to manage worker exposure. Survey teams use mobile carts for high-resolution mapping. Portable designs reduce dependency on fixed stations. These products attract interest due to lower setup time.
Rise of Indoor Air Quality Monitoring in Commercial, Residential, and Institutional Buildings
Indoor monitoring grows due to higher awareness of VOC exposure and ventilation needs. Offices adopt smart HVAC-linked sensors to maintain safe environments. Homes deploy compact units that support consumer well-being. The Air Quality Monitoring Market reflects strong adoption across indoor applications. Hospitals use advanced sensors to protect sensitive zones. Schools track pollutants to protect children in crowded spaces. Hotels integrate IAQ systems to improve guest satisfaction. Facility managers use real-time dashboards to guide maintenance actions. Indoor systems gain momentum due to strong health focus.
Air Quality Monitoring System Market Challenges Analysis
High Deployment Costs, Calibration Needs, and Infrastructure Gaps Limiting Wider Adoption
Many buyers face difficulty funding large-scale deployment of monitoring systems. Advanced analyzers require costly calibration and routine servicing. Small industries struggle to maintain skilled teams for system upkeep. The Air Quality Monitoring Market encounters adoption barriers in low-income regions. Indoor buyers face confusion due to varied product quality. Rural areas lack power and connectivity to support continuous tracking. Some systems generate complex data that requires trained staff. Public agencies struggle to secure long-term maintenance budgets. These gaps reduce adoption speed in several markets.
Data Reliability Concerns and Integration Issues Across Diverse Sensor Platforms and Networks
Low-cost sensors produce variable accuracy under harsh conditions. Integration of multiple sensor types creates mismatched datasets. Users struggle to validate readings without reference-grade benchmarks. The Air Quality Monitoring Market deals with uncertainty around data trust. Many networks lack strong protocols to ensure consistent output. Some cities face difficulty linking sensor data with traffic or climate platforms. Weak cybersecurity practices create risk for cloud-linked systems. Organizations require training to interpret mixed-source datasets. These issues slow adoption across advanced programs.
Air Quality Monitoring System Market Opportunities
Growth of Smart Infrastructure, Climate Innovation, and Connected Ecosystems Creating New Deployment Models
Smart city programs expand space for integrated sensor networks. Climate action plans encourage investment in continuous emission tracking. Connected ecosystems link air quality systems with mobility, energy, and public health platforms. The Air Quality Monitoring Market gains new growth paths from these initiatives. Firms deliver solutions bundled with predictive analytics and automation. Governments test cross-sector applications using shared datasets. Businesses use monitoring data to strengthen sustainability goals. Regional alliances invest in cross-border pollution mapping. These factors support strong demand across global markets.
Rising Demand for Indoor Monitoring, Personal Exposure Tracking, and Health-Oriented Solutions
Indoor environments gain priority due to growing focus on occupant well-being. Consumer awareness strengthens demand for compact and affordable devices. Health groups rely on exposure data to support vulnerable populations. The Air Quality Monitoring Market benefits from expanding household and commercial adoption. Device makers offer hybrid indoor-outdoor systems to widen reach. Employers use IAQ tools to support safety strategies. Hospitals and clinics deploy advanced sensors for critical zones. Real estate projects integrate IAQ solutions to raise building value. This opportunity supports long-term market expansion.
Air Quality Monitoring System Market Segmentation Analysis:
By Product Type
Indoor and outdoor monitors create the largest demand base in the Air Quality Monitoring Market. Indoor systems gain traction in homes, offices, and institutional buildings due to heightened focus on occupant health and tighter ventilation standards. Outdoor monitors support regulatory compliance, traffic emission studies, and industrial perimeter control. Remote sensing tools extend coverage across large zones with minimal infrastructure. Wearable and portable devices gain interest from consumers and researchers seeking personal exposure insights. Dust and particulate monitors strengthen usage in pollution-prone regions. AQM stations provide reference-grade measurements for national networks. Each product category contributes to stronger monitoring density across regions.
- For instance, the Honeywell HPM Series particulate sensors achieve ±15% accuracy for PM2.5 detection, which supports precise indoor monitoring.
By Sampling Method
Continuous or active monitoring commands strong adoption due to its ability to deliver real-time pollutant data. Manual and passive methods remain relevant for periodic assessments, low-budget installations, and rural surveys. Passive systems support long-duration sampling without power needs, which benefits remote locations. Intermittent monitoring solutions fill operational gaps where full-time stations are unnecessary. The Air Quality Monitoring Market reflects demand for flexible sampling tools that support compliance, research, and community reporting. Continuous systems gain priority in urban centers due to rising pollution events. Organizations select methods based on cost, sensitivity, and data frequency needs. Hybrid deployments combine multiple sampling modes to improve accuracy.
- For instance, Siemens LDS 6 analyzers support continuous in-situ gas monitoring with millisecond response times, enabling high-frequency emission control.
By Pollutant Type
Chemical pollutant monitoring maintains strong usage across industrial and urban networks. Nitrogen dioxide, sulfur dioxide, and carbon monoxide measurement supports emission control programs. Physical pollutant tracking of PM2.5 and PM10 gains priority due to health risks linked to particulate exposure. Biological pollutant monitoring expands with rising concern around airborne pathogens, mold growth, and allergens. The Air Quality Monitoring Market benefits from advanced sensors designed to detect multiple pollutants simultaneously. Indoor environments require tighter monitoring of VOCs and particulate load. Industrial locations depend on chemical pollutant tracking for safety and compliance. Broader pollutant coverage improves decision-making for public health agencies.
By Component
Hardware dominates due to strong demand for sensors, processors, and output modules that support continuous data capture. Software platforms gain traction through analytics, visualization, and forecasting capabilities. Service offerings expand to include system integration, calibration, maintenance, and remote diagnostics. The Air Quality Monitoring Market relies on each component group to ensure reliable measurement and efficient system management. Hardware upgrades improve accuracy, while software enhances interpretation. Service support reduces downtime in large monitoring networks. Buyers select integrated solutions that combine strong hardware with advanced digital tools. Component development continues to strengthen system performance across industries.
By End-User
Government agencies and academic institutes form a major user base due to their focus on regulatory measurement, research programs, and national surveillance. Commercial and residential users show greater interest in indoor sensors to support health and safety needs. Petrochemical plants, power generation sites, and pharmaceutical facilities depend on monitoring tools for emission control and worker protection. Smart city authorities integrate real-time monitoring into urban management frameworks. The Air Quality Monitoring Market supports diverse users that require accurate and actionable data. Industries rely on these systems to maintain compliance. Public agencies expand networks to protect communities from pollution risks.
Segmentation:
By Product Type
- Indoor Monitors
- Outdoor Monitors
By Sampling Method
- Continuous/Active Monitoring
- Manual Monitoring
- Passive Monitoring
- Intermittent Monitoring
By Pollutant Type
- Chemical Pollutants
- Nitrogen Dioxide (NO₂)
- Sulfur Dioxide (SO₂)
- Carbon Monoxide (CO)
- Other Chemical Pollutants
- Physical Pollutants
- Particulate Matter PM2.5
- Particulate Matter PM10
- Biological Pollutants
- Pollen, Mold Spores, Bacteria, Fungi, and Other Bioaerosols
By Component
- Hardware
- Software
- Services
By End-User
- Government Agencies & Academic Institutes
- Commercial & Residential Users
- Petrochemical Industry
- Power Generation Plants
- Pharmaceutical Industry
- Smart City Authorities
- Others
By Region
- North America
- U.S.
- Canada
- Mexico
- Europe
- Germany
- France
- U.K.
- Italy
- Spain
- Rest of Europe
- Asia Pacific
- China
- Japan
- India
- South Korea
- South-east Asia
- Rest of Asia Pacific
- Latin America
- Brazil
- Argentina
- Rest of Latin America
- Middle East & Africa
- GCC Countries
- South Africa
- Rest of the Middle East and Africa
Regional Analysis:
North America holds the largest share of the Air Quality Monitoring Market at nearly 38%. Strong regulatory enforcement and early adoption of advanced monitoring systems support regional leadership. Government networks and industrial users invest in high-precision analyzers that strengthen compliance. Smart city programs expand monitoring grids across major urban zones. The Air Quality Monitoring Market gains stable demand from environmental agencies focused on public health. Technology providers benefit from consistent replacement and upgrade cycles. Regional investment patterns reflect strong commitment to long-term air quality improvement.
Europe accounts for roughly 30% share, supported by strict emission standards and extensive urban monitoring networks. National agencies deploy dense measurement stations that support pollution control policies. Industrial sectors maintain strong dependence on reference-grade systems to meet regulatory expectations. The Air Quality Monitoring Market benefits from rising attention to indoor air quality across commercial buildings. Research programs expand pollutant surveillance in high-risk regions. Consumer demand grows for portable and residential devices. European cities integrate air quality data with wider sustainability initiatives.
Asia-Pacific contributes close to 25% share and remains the fastest-growing regional market. China and India expand national networks to address frequent pollution events and rising urban density. Industrial growth drives investment in continuous emission monitoring systems. The Air Quality Monitoring Market gains traction from increased use of low-cost sensors in community programs. Southeast Asian countries deploy mixed networks that combine fixed, mobile, and remote sensing solutions. Demand strengthens among smart city developers. Regional expansion reflects broader focus on public health and industrial safety.
Key Player Analysis:
- 3M Company
- Aeroqual
- Agilent Technologies Inc.
- Airveda
- Chemtrols
- Emerson Electric Co.
- ENVEA
- Envire Global
- Honeywell International Inc.
- HORIBA Ltd.
- Oizom
- Renesas Electronics Corporation
- Siemens AG
- Teledyne Technologies Inc.
- Thermo Fisher Scientific Inc.
- TSI Incorporated
Competitive Analysis:
The competitive landscape in the Air Quality Monitoring Market features a mix of global technology firms and specialized sensor manufacturers. Companies such as Thermo Fisher Scientific, Honeywell, Teledyne Technologies, and Siemens supply high-precision analyzers used across regulatory and industrial settings. Sensor-focused firms deliver compact and low-cost devices that expand adoption among residential and commercial users. The Air Quality Monitoring Market pushes competitors to strengthen digital capabilities through AI-enabled analytics and cloud platforms. Firms invest in R&D to improve accuracy, durability, and multi-pollutant detection. Partnerships with government agencies, environmental bodies, and smart city programs improve market penetration. Competitors differentiate through service offerings, calibration support, and integrated software. Regional players scale quickly by providing affordable solutions that meet developing market needs.
Recent Developments:
- In May 2025, 3M Company launched new refillable Filtrete™ air filters certified Asthma & Allergy Friendly®, designed to reduce allergens while minimizing waste and supporting indoor air quality. This innovation includes reusable frames with long-lasting refills for better airflow and sustainability.
- In January 2025, SICK and Endress+Hauser completed their strategic partnership by forming Endress+Hauser SICK GmbH+Co. KG. This joint venture focuses on scaling gas analysis solutions for waste-to-energy and oil & gas projects, enhancing production and development of process analyzers and gas flowmeters.
- In November 2024, DwyerOmega acquired Process Sensing Technologies Ltd (PST). The deal expands DwyerOmega's portfolio in sensors, instruments, gas analyzers, and software for environmental monitoring in pharma, utilities, and other sectors.
- In February 2024, Honeywell launched its new Air Quality Control System for commercial buildings. This integrates advanced air filtration and real-time monitoring to meet rising demand for indoor air quality solutions.
Report Coverage:
The research report offers an in-depth analysis based on Product Type, Sampling Method, Pollutant Type, Component, and End-User. It details leading market players, providing an overview of their business, product offerings, investments, revenue streams, and key applications. Additionally, the report includes insights into the competitive environment, SWOT analysis, current market trends, as well as the primary drivers and constraints. Furthermore, it discusses various factors that have driven market expansion in recent years. The report also explores market dynamics, regulatory scenarios, and technological advancements that are shaping the industry. It assesses the impact of external factors and global economic changes on market growth. Lastly, it provides strategic recommendations for new entrants and established companies to navigate the complexities of the market.
Future Outlook:
- Demand for real-time monitoring will rise as more cities integrate networked sensors into long-term environmental programs.
- Indoor monitoring adoption will expand due to stronger focus on occupant health and cleaner building standards.
- AI-driven analytics will support advanced forecasting, improving early detection of pollution spikes across regions.
- Low-cost sensors will gain wider use among community groups and small businesses, improving monitoring density.
- Industrial users will increase investment in continuous emission tracking to strengthen compliance processes.
- Smart city initiatives will accelerate deployment of integrated monitoring platforms linked to mobility and climate systems.
- Biological pollutant tracking will advance as institutions emphasize pathogen, mold, and allergen surveillance.
- Hybrid networks combining fixed, portable, and remote sensing tools will shape future infrastructure planning.
- Cloud-based systems will improve data transparency, strengthening public access to real-time air quality insights.
- Partnerships between governments, industry players, and technology firms will support faster innovation across the Air Quality Monitoring Market.
Request a Free Sample
Fill in your details and we'll send you a free sample report.
- Sample data tables & charts
- Research methodology
Need a Custom Version of This Report?
Tailor the scope, geography, or segments to your exact requirements.
- Custom geography or segment scope
- Direct access to our analyst team
Frequently Asked Questions
What is the current market size for Air Quality Monitoring Market, and what is its projected size in 2032?
At what Compound Annual Growth Rate is the Air Quality Monitoring Market projected to grow between 2025 and 2032?
Which Air Quality Monitoring Market segment held the largest share in 2025?
What are the primary factors fueling the growth of the Air Quality Monitoring Market?
Who are the leading companies in the Air Quality Monitoring Market?
Which region commanded the largest share of the Air Quality Monitoring Market in 2025?
Table of Content
Chapter 1. Report Introduction
- 1.1 Report Description & Purpose
- 1.1.1 Report Title & Market Definition
- 1.1.2 Unique Selling Propositions (USP) & Key Differentiators
- 1.1.3 Value Proposition for Stakeholders
- 1.2 Research Objectives
- 1.2.1 Market Sizing Objectives (Volume & Revenue)
- 1.2.2 Segmentation Objectives
- 1.2.3 Competitive Intelligence Objectives
- 1.2.4 Forecast & Scenario Objectives
- 1.3 Report Scope
- 1.3.1 Air Quality Monitoring System Scope – Types & Subtypes Covered
- 1.3.2 Geographic Scope – Regions & Countries Covered
- 1.3.3 Historical Period, Base Year & Forecast Period (2025; forecast to 2032)
- 1.3.4 Inclusions & Exclusions
- 1.4 HS Code & Classification Framework
- 1.5 Currency, Units & Pricing Basis
- 1.6 Target Stakeholders
- 1.7 Limitations & Assumptions
Chapter 2. Executive Summary
- 2.1 Global Air Quality Monitoring System Market Snapshot
- 2.1.1 Market Size – Historical (2025) & Forecast (2025-2032) (2025: USD 5,773.69 million → 2032: USD 12,215.74 million)
- 2.1.2 Volume & Revenue – Global Totals
- 2.1.3 Key Market Highlights – Top Five Facts
- 2.2 Air Quality Monitoring System Market Segmentation Snapshot
- 2.2.1 Market Split by Region – 2025 vs. 2032
- 2.3 Competitive Snapshot
- 2.3.1 Top 10 Players by Revenue Share – 2025
- 2.3.2 Top 10 Players by Volume Share – 2025
- 2.3.3 Recent Strategic Developments (18-Month Summary)
- 2.4 Key Investment Highlights & Strategic Conclusions
Chapter 3. Air Quality Monitoring System Market Dynamics & Industry Analysis
- 3.1 Market Overview & Context
- 3.1.1 Air Quality Monitoring System Market Position in the Broader Automotive Value Chain
- 3.1.2 OEM vs. Replacement Market Dynamics
- 3.1.3 Market Maturity & Development Stage by Region
- 3.2 Air Quality Monitoring System Market Drivers
- 3.3 Air Quality Monitoring System Market Restraints & Challenges
- 3.4 Air Quality Monitoring System Market Opportunities
- 3.5 Porter's Five Forces Analysis
- 3.5.1 Threat of New Entrants
- 3.5.2 Bargaining Power of Suppliers
- 3.5.3 Bargaining Power of Buyers
- 3.5.4 Threat of Substitutes
- 3.5.5 Competitive Rivalry – Intensity Assessment
- 3.6 Air Quality Monitoring System Value Chain Analysis
- 3.6.1 Upstream – Raw Material/Input Suppliers
- 3.6.1.1 Raw Material/Input 1
- 3.6.1.2 Raw Material/Input 2
- 3.6.1.3 Raw Material/Input 3
- 3.6.2 Midstream – Production/Manufacturing/Service Delivery
- 3.6.2.1 Production/Process Overview
- 3.6.2.2 Key Facility Locations & Capacity by Manufacturer
- 3.6.3 Downstream – Distribution & End Consumer
- 3.6.3.1 Primary Channel – B2B/OEM
- 3.6.3.2 Secondary Channels – Dealer, Retail, Online, Direct
- 3.6.4 Value Chain Profitability Analysis
- 3.6.1 Upstream – Raw Material/Input Suppliers
- 3.7 PESTEL Analysis
- 3.7.1 Political Factors
- 3.7.2 Economic Factors
- 3.7.3 Social Factors
- 3.7.4 Technological Factors
- 3.7.5 Environmental Factors
- 3.7.6 Legal Factors
- 3.8 Air Quality Monitoring System Supply Chain Analysis
- 3.8.1 Raw Material/Input Supply Risk Assessment
- 3.8.2 Manufacturing Concentration Risk (Geographic Exposure)
- 3.8.3 Trade Disruption Impact Analysis
- 3.9 Regulatory & Policy Landscape
Note: The regulatory and policy landscape section covers regulations based on their applicability to the market, Air Quality Monitoring System category, geography, and scope of the study. Only regulatory frameworks with a material impact on operations, compliance, trade, sustainability, or market access are analyzed in detail.
Chapter 4. Key Investment Pockets & Opportunity Analysis
- 4.1 Air Quality Monitoring System Market Attractiveness Analysis
- 4.1.1 By Region – Investment Attractiveness Matrix (Volume × CAGR)
- 4.2 Absolute Revenue Growth Opportunity
- 4.2.1 By Region – Absolute USD Growth Through 2032
- 4.3 Incremental Volume Opportunity
- 4.3.1 By Region – Incremental Volume Through 2032
- 4.3.2 Segment – Incremental Volume
- 4.4 Emerging Submarket Opportunity Deep Dive (Subject to Applicability)
- 4.5 Emerging Market Opportunity Scorecards
- 4.5.1 United States
- 4.5.2 Europe
- 4.5.3 Asia
- 4.5.4 Middle East & Africa
Note: Emerging Market Opportunity Scorecards will be included based on relevance and strategic importance. Regions listed are indicative and may vary depending on data availability and market dynamics.
Chapter 5. Air Quality Monitoring System Import-Export Analysis & Trade Flows
- 5.1 Global Trade Overview
- 5.1.1 Global Export Value by Country (2025)
- 5.1.2 Global Export Volume by Country (2025)
- 5.1.3 Global Import Value by Country (2025)
- 5.1.4 Global Import Volume by Country (2025)
- 5.1.5 Net Trade Balance by Country (2025)
- 5.2 Export Analysis – Segment
- 5.2.1 Type 1 (HS Code)
- 5.2.2 Type 2 (HS Code)
- 5.2.3 Type 3 (HS Code)
- 5.2.4 Type 4 (HS Code)
- 5.2.5 Type 5 (HS Code)
- 5.3 Import Analysis – Segment
- 5.3.1 Type 1 (HS Code)
- 5.3.2 Type 2 (HS Code)
- 5.3.3 Type 3 (HS Code)
- 5.3.4 Type 4 (HS Code)
- 5.3.5 Type 5 (HS Code)
- 5.4 Average Unit Trade Prices
- 5.4.1 Average Export Price – Segment & Country
- 5.4.2 Average Import Price – Segment & Source Country
- 5.4.3 Price Trends (2025)
- 5.5 Key Trade Route Analysis
- 5.5.1 Trade Route 1
- 5.5.2 Trade Route 2
- 5.5.3 Trade Route 3
- 5.5.4 Trade Route 4
- 5.5.5 Trade Route 5
- 5.6 Trade Policy Impact Assessment
- 5.6.1 US Anti-Dumping & Section 301 Tariffs
- 5.6.2 EU Customs Union Impact
- 5.6.3 Major Free Trade Agreements
- 5.6.4 USMCA Rules of Origin
Note: Trade policy analysis will be included only where relevant to the Air Quality Monitoring System market.
Chapter 6. Competitive Landscape & Company Benchmarking
- 6.1 Air Quality Monitoring System Market Concentration & Structure
- 6.1.1 Herfindahl-Hirschman Index (HHI) – vs. 2025
- 6.1.2 Tier 1, Tier 2 & Tier 3 Market Structure
- 6.1.3 Global, Regional & Local Player Dynamics
- 6.2 Air Quality Monitoring System Market Share Analysis – 2025
- 6.2.1 Global Revenue Share by Company
- 6.2.2 Global Volume Share by Company
- 6.2.3 Regional Revenue Share
- 6.2.4 Market Share Evolution ( vs. 2025)
- 6.2.5 OEM Segment Share by Company
- 6.2.6 Replacement Segment Share by Company
- 6.3 Production/Delivery Capacity & Facility Analysis
- 6.3.1 Global Installed Capacity
- 6.3.2 Capacity Utilization Rates
- 6.3.3 Production/Output Volume
- 6.3.4 Facility Locations & Capacity Map
- 6.3.5 Planned Capacity Additions
- 6.4 Air Quality Monitoring System Competitive Benchmarking Matrix
- 6.4.1 Revenue, Volume, CAGR & Profitability Comparison
- 6.4.2 Channel Revenue Mix
- 6.4.3 Geographic Revenue Exposure
- 6.4.4 R&D Intensity
- 6.4.5 Sustainability Maturity
- 6.5 Strategic Developments in Air Quality Monitoring System (Last 24 Months)
- 6.5.1 Mergers, Acquisitions & Divestments
- 6.5.2 New Air Quality Monitoring System Launches
- 6.5.3 Facility Expansions
- 6.5.4 Strategic Alliances, Joint Ventures & Partnerships
- 6.5.5 Distribution Expansion & Market Entry
- 6.5.6 Sustainability & ESG Initiatives
- 6.6 Competitive Strategy Mapping
- 6.6.1 Leader, Challenger, Follower & Niche Classification
- 6.6.2 Pricing Strategy Comparison
- 6.6.3 Channel Strategy Matrix
Note: Strategic developments are included based on their materiality and the availability of reliable information.
Chapter 7. Global Air Quality Monitoring System Market – By Distribution Channel
- 7.1 Segment Overview
- 7.1.1 Volume & Revenue Split by Channel (2025 & 2032)
- 7.1.2 Channel Mix Evolution (2025-2032)
Chapter 8. Regional Market Analysis – Global Overview
- 8.1 Global Regional Overview
- 8.1.1 Regional Volume Share
- 8.1.2 Regional Revenue Share
- 8.1.3 Regional Volume by Region
- 8.1.4 Regional Revenue by Region
- 8.1.5 Regional Forecast Through 2032
- 8.2 Cross-Regional Segment Analysis
- 8.2.1 By Distribution Channel
- 8.2.2 By Brand/Price Tier
Chapter 9. North America Air Quality Monitoring System Market
- 9.1 United States
- 9.2 Canada
- 9.3 Mexico
Chapter 10. Europe Air Quality Monitoring System Market
- 10.1 Germany
- 10.2 France
- 10.3 Italy
- 10.4 United Kingdom
- 10.5 Spain
- 10.6 Poland
- 10.7 Russia
- 10.8 Netherlands
- 10.9 Belgium
- 10.10 Sweden
- 10.11 Denmark
- 10.12 Norway
- 10.13 Rest of Europe
Chapter 11. Asia Pacific Air Quality Monitoring System Market
- 11.1 China
- 11.2 India
- 11.3 Japan
- 11.4 South Korea
- 11.5 Thailand
- 11.6 Indonesia
- 11.7 Vietnam
- 11.8 Malaysia
- 11.9 Australia
- 11.10 Rest of Asia Pacific
Chapter 12. Latin America Air Quality Monitoring System Market
- 12.1 Brazil
- 12.2 Argentina
- 12.3 Colombia
- 12.4 Chile
- 12.5 Rest of Latin America
Chapter 13. Middle East Air Quality Monitoring System Market
- 13.1 Saudi Arabia
- 13.2 United Arab Emirates
- 13.3 Turkey
- 13.4 Israel
- 13.5 Iran
- 13.6 Rest of the Middle East
Chapter 14. Africa Air Quality Monitoring System Market
- 14.1 South Africa
- 14.2 Egypt
- 14.3 Nigeria
- 14.4 Morocco
- 14.5 Rest of Africa
Chapter 15. Air Quality Monitoring System Company Profiles
- 15.1 [Company 01]
- 15.1.1 Company Overview
- 15.1.2 Key Management Personnel
- 15.1.3 Products & Services Portfolio
- 15.1.4 Financial Performance
- 15.1.5 Key Market Focus & Geographic Presence
- 15.1.6 Recent Developments & Strategic Initiatives
Note: The company profile list is preliminary and may change based on research findings, market developments, data availability, and client requirements.
Chapter 16. Appendices
- Appendix A – List of Abbreviations & Acronyms
- Appendix B – Industry Classification Code Reference – Full Series
- Appendix C – Production & Capacity Data Tables
- Appendix D – End-Use & Demand Base Tables
- Appendix E – Consumption & Replacement Rate Assumptions
- Appendix F – ASP Reference Tables
- Appendix G – Manufacturing & Facility Database
- Appendix H – Import-Export Data Tables
- Appendix I – Regulatory Summary Tables
- Appendix J – Primary Research Participant List (Anonymized)
- Appendix K – Primary Research Questionnaire Framework
- Appendix L – Data Sources & Bibliography
- Appendix M – Market Size Divergence & Source Comparison
Chapter 17. Research Methodology
- 17.1 Research Framework & Philosophy
- 17.2 Secondary Research – Sources, Hierarchy & Data Extraction
- 17.3 Data Modeling – Bottom-Up & Top-Down Market Sizing
- 17.4 Primary Research – Stakeholder Framework, LOI & Sample Sizes
- 17.5 Forecast Methodology – Regression, Scenario & Sensitivity Analysis
- 17.6 Quality Control – Four-Layer Validation Framework
- 17.7 Limitations & Standard Assumptions
- 17.8 Disclaimer
