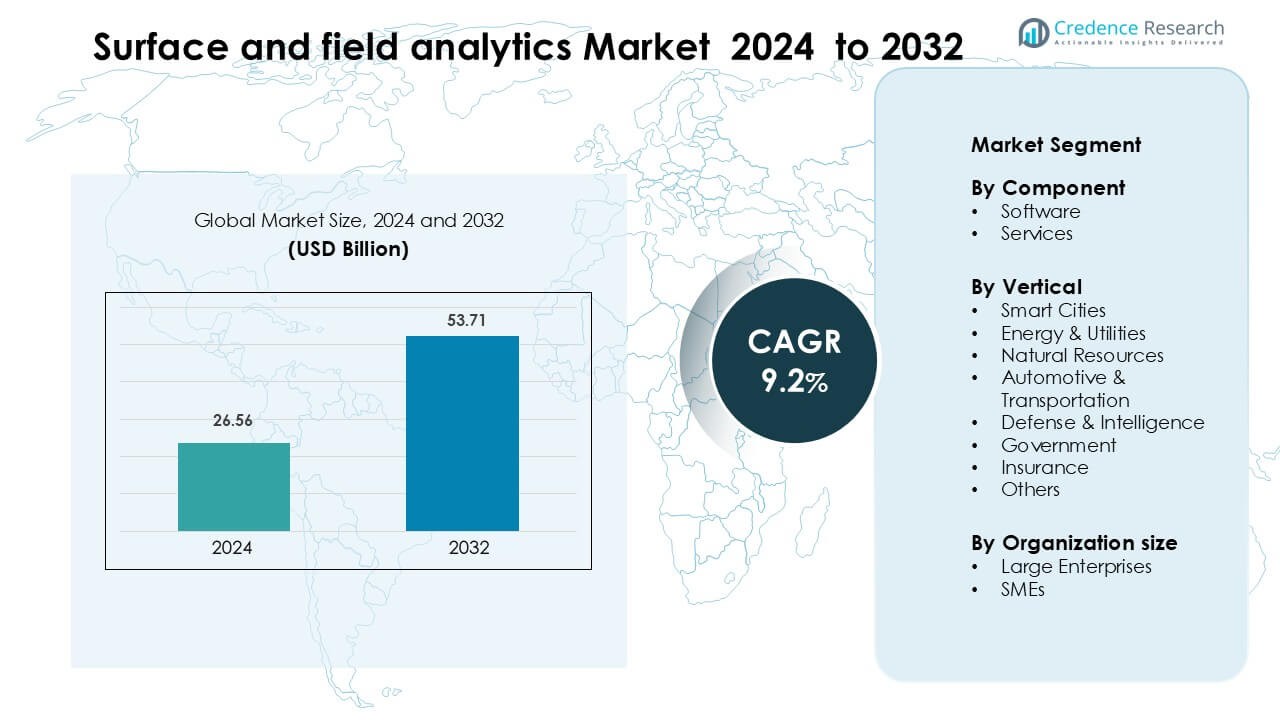
Home » Information and Communications Technology » Technology & Media » Surface and Field Analytics Market

Global Surface and Field Analytics Market By Offering (Software and Services) By Deployment Model (On-premise and Cloud) By Enterprise Size (Large Enterprises and SMEs) By Industry Vertical (Automotive and Transportation, Energy and Utilities, Government, Defense and Intelligence, Smart Cities, Insurance, Natural Resources and Others)-Growth, Future Prospects & Competitive Analysis, 2016 – 2030

Price: $4999

Published: | Report ID: 16716 | Report Format : PDF

Key Highlights of the report

How are the major segments performing in the Surface and Field Analytics market?

  • The smart cities sector dominated the surface & field analytics market share in 2022, and this trend is anticipated to continue during the forecast period.
  • Surface & field analytics market share was dominated by large enterprises in 2022.

What is the Market Size of Surface And Field Analytics regarding value?

The global surface and field analytics market is anticipated to grow at a substantial CAGR of 9.2% in the upcoming years. The global surface and field analytics industry was estimated to be worth USD  20.3 million in 2022 and was expected to be worth USD 37.6 million by 2028.

Which region dominated the surface and field analytics market?

Due to the high concentration of surface & field analytics vendors in the region, including Nikon Corporation, Thermo Fisher Scientific, Inc., and Olympus Corporation, which is anticipated to drive the market for surface & field analytics technology during the forecast period, North America dominated the surface & field analytics market regionally in 2022 and is predicted to maintain its position during the forecast period.

Design Element 2

Access crucial information at unmatched prices!

Request your free sample report today & start making informed decisions powered by Credence Research!

Download Free Sample
CTA Design Element 3

How is US Market Performing in the surface and field analytics market?

In North America, the US now controls the market for satellite manufacturing, data imagery, and value-added services and is predicted to maintain this position through 2030. Due to the region’s rapid technological and economic development, the US is anticipated to experience considerable expansion throughout the forecast period, which is anticipated to fuel demand for surface & field analytics solutions in the future.

How is the economy impacting global surface and field analytics growth?

Rising inflation rates in various nations have considerably impacted the purchasing power of consumers. During a recession, people prioritize their needs, which may affect their purchases. Additionally, market liquidity may decline. The Russia-Ukraine War severely damaged importers of goods from Russia and Ukraine. Doctors may choose to forgo unnecessary medications to adequately treat patients with Covid-19 infections as a result of the Covid-19 pandemic. Therefore, each of these elements can potentially restrict the market growth.

REPORT ATTRIBUTE DETAILS
Surface and Field Analytics Market by Volume Yes
Surface and Field Analytics Market by Value Yes
Surface and Field Analytics Market, Tornado Analysis Yes
Surface and Field Analytics Market, STAR Analysis Yes
Surface and Field Analytics Market, SRC Analysis Yes
Surface and Field Analytics Market, Import-Export Data Yes (On Demand)
Surface and Field Analytics Market Pricing Analysis Yes (On Demand)
Surface and Field Analytics Market Segment Analysis By Offering (Software and Services)

By Deployment Model (On-premise and Cloud)

By Enterprise Size (Large Enterprises and SMEs)

By Industry Vertical (Automotive and Transportation, Energy and Utilities, Government, Defense and Intelligence, Smart Cities, Insurance, Natural Resources and Others)

Surface and Field Analytics Market, Regional Analysis North America (US and Canada)

Europe (Germany, UK, France, Italy, Spain, and the Rest of Europe)

Asia Pacific (China, India, Japan, South Korea, South East Asia, and Rest of Asia Pacific)

Latin America (Brazil, Mexico, and Rest of Latin America)

Middle East and Africa (GCC Countries, South Africa, and Rest of Middle East and Africa)

Surface and Field Analytics Market Key Companies Bruker Corporation, Carl Zeiss AG, Danaher Corporation, Jeol Limited, Nikon Corporation, Olympus Corporation, Shimadzu Corporation, Thermo Fisher Scientific, Inc., ULVAN-PHI, and Waters Corporation
Surface and Field Analytics Market Competitive Landscape Market Share Analysis

Competitive Benchmarking

Key Players Market Positioning

Geographical Presence Analysis

Major Strategies Adopted

What is the competitive environment of the surface and field analytics market?

Most businesses are increasing their market shares by utilizing new technology and tactics. To produce unique goods and provide dependable services, market participants in surface and field analytics heavily invest in comprehensive R&D initiatives. Prominent players frequently use important strategies for product portfolio expansion, mergers, and acquisitions.

Executive Summary

What are the key trends in the Surface And Field Analytics market?

  • Real-time data exchange is essential to developing modern smart cities, which are increasingly data-driven. Utilizing a surface & field analytics solution that is enterprise-grade to gather data from tens of thousands of IoT sensors and analyze it
  • The two main drivers anticipated to propel the global surface and field analytics market are the rising demand for data-driven decision-making and the rising hazard perception associated with natural catastrophes.

What is the market scenario of the Surface And Field Analytics Market?

Geospatial analytics uses surface analysis to examine various surface types, such as floor elevation and slope. The analysis is employed to improve the performance of currently in-use materials and identify new materials. Real-time data exchange is essential to developing modern smart cities, which are increasingly data-driven. Utilizing a surface & field analytics solution that is enterprise-grade to gather data from tens of thousands of IoT sensors and analyze it. The two main drivers anticipated to propel the global surface and field analytics market are the rising demand for data-driven decision-making and the rising hazard perception associated with natural catastrophes.

Surface And Field Analytics Market

Which are the key investments by the surface and field analytics market players?

Key players are implementing various methods, including product launches, alliances, and mergers and acquisitions, to strengthen their position in the business. For instance, The delivery of the AX and AX R series of confocal microscopes, the next generation, has been announced by Nikon Corporation for April 2021. This new confocal series features the largest*2 25 mm field of view*3, an upgraded scan head with 8K x 8K resolution*1, and ultra-high speed resonant scanning. Thanks to a contemporary, user-friendly interface and cutting-edge AI-based technologies, the AX/AX R confocal series is intended to enable users to capture data more quickly, with an unmatched level of detail and convenience. With the enhanced pixel density, sensitivity, and speed of this minuscule system, the business can now offer.

Some major surface and field analytics market players are Bruker Corporation, Carl Zeiss AG, Danaher Corporation, Jeol Limited, Nikon Corporation, Olympus Corporation, Shimadzu Corporation, Thermo Fisher Scientific, Inc., ULVAN-PHI, and Waters Corporation.

What are the Major Driving Factors for the Surface And Field Analytics Market?

During the COVID-19 pandemic, a rise in the need for work-from-home opportunities and sanitation trends helped to fuel the development of global surface analytics and remote management solutions, hence boosting demand for the whole surface & field analytics business. On the other hand, during the forecast period, integration of cutting-edge tools like machine learning and surface analytics with surface & field analytics solution suites is anticipated to offer the lucrative potential for growth of the surface & field analytics business.

Growing Concern about the Threat of Natural Disasters (Result of Climate Change): Speed and efficacy are more crucial than ever in the face of increasingly frequent unforeseen calamities. A tremendous amount of information must be processed and communicated by local governments, organizations, and emergency management staff. Locations of people and personnel, weather conditions, exposure of the property, evacuation resources, access to public safety services, interruptions in the supply chain, and many other things are included in this information. The government and emergency services can make more timely and accurate decisions using geospatial capabilities. Geospatial technologies provide real-time monitoring and geographical awareness. During the anticipated period, this is anticipated to fuel the expansion of the Surface and Field Analytics market.

What are the Major Risks for the Surface And Field Analytics Market?

The size of the surface and field analytics industry is, however, constrained by issues with data protection and sharing posed by third-party surface and field analytics platforms. Growing Concern about the Threat of Natural Disasters (Result of Climate Change): Speed and efficacy are more crucial than ever in the face of increasingly frequent unforeseen calamities. A tremendous amount of information must be processed and communicated by local governments, organizations, and emergency management staff. Locations of people and personnel, weather conditions, exposure of the property, evacuation resources, access to public safety services, interruptions in the supply chain, and many other things are included in this information. The government and emergency services can make more timely and accurate decisions using geospatial capabilities. Geospatial technologies provide real-time monitoring and geographical awareness. During the anticipated period, this is anticipated to fuel the expansion of the Surface and Field Analytics market.

Which is the key industry vertical in the surface and field analytics market?

According to the industry vertical, the smart cities segment dominated the surface & field analytics market share in 2022 and is anticipated to maintain this trend during the forecast period. This is because major governments increasingly need efficient planning and mapping solutions, which motivates them to invest in such solutions for their organizations. However, the insurance sector is anticipated to develop at the fastest rate in the next years because of a rise in demand for tools that allow for analyzing and tagging client data according to geography (area/city).

How is the surface and field analytics market performing in regions?

The North American region dominates the Surface and Field Analytics Market, with significant investments and revenue anticipated from the US and Canadian markets. Currently, the United States dominates North America in terms of satellite manufacturing, data imagery, and value-added services, and that dominance is anticipated to last until 2029. However, Canada is making significant investments in the research and development of Earth observation SAR satellites for various applications, and it is anticipated that Canada will become more prominent in the Surface and Field Analytics Market throughout the forecast period. However, North America is becoming a very competitive region. There is now more competition for contracts, prices, finances, and suppliers due to domestic firms and foreign businesses growing their activities in the area.

Shape Your Report to Specific Countries or Regions & Enjoy 30% Off!

What are the major players planning for the future of the surface and field analytics market?

The market players are increasing their company’s footprints in the surface analysis market through collaboration, product launches, business expansion, award and recognition programs, joint ventures, and other methods, which is beneficial for the organization’s profit growth.

Segmentation of Global Surface And Field Analytics Market-

Global Surface And Field Analytics Market – By Offering

  • Software
  • Services

Global Surface And Field Analytics Market – By Deployment Model

  • On-premise
  • Cloud

Global Surface And Field Analytics Market – By Enterprise Size

  • Large Enterprises
  • SMEs

Global Surface And Field Analytics Market – By Industry Vertical

  • Automotive and Transportation
  • Energy and Utilities
  • Government
  • Defense and Intelligence
  • Smart Cities
  • Insurance
  • Natural Resources
  • Others

Global Surface And Field Analytics Market – By Region

  • North America
    • U.S
    • Canada
  • Europe
    • Germany
    • France
    • U.K.
    • Italy
    • Spain
    • Rest of Europe
  • Asia Pacific
    • China
    • Japan
    • India
    • South Korea
    • South-east Asia
    • Rest of Asia Pacific
  • Latin America
    • Brazil
    • Mexico
    • Rest of Latin America
  • Middle East & Africa
    • GCC Countries
    • South Africa
    • Rest of Middle East and Africa

1. Preface
1.1. Report Description
1.1.1. Purpose of the Report
1.1.2. Target Audience
1.1.3. USP and Key Offerings
1.2. Research Scope
1.3. Research Methodology
1.3.1. Phase I – Secondary Research
1.3.2. Phase II – Primary Research
1.3.3. Phase III – Expert Panel Review
1.3.4. Approach Adopted
1.3.4.1. Top-Down Approach
1.3.4.2. Bottom-Up Approach
1.3.5. Assumptions
1.4. Market Introduction
1.5. Market Research Scope

2. Executive Summary
2.1. Market Snapshot: Global Surface and Field Analytics Market
2.2. Global Surface and Field Analytics Market, By Offering
2.3. Global Surface and Field Analytics Market, By Deployment Model
2.4. Global Surface and Field Analytics Market, By Enterprise Size
2.5. Global Surface and Field Analytics Market, By Industry Vertical
2.6. Global Surface and Field Analytics Market, By Region

3. Market Dynamics & Factors Analysis
3.1. Introduction
3.1.1. Global Surface and Field Analytics Market Value, 2017-2030, (US$ Bn)
3.1.2. Y-o-Y Growth Trend Analysis
3.2. Market Dynamics
3.2.1. Market Drivers
3.2.2. Market Restraints
3.2.3. Market Opportunities
3.2.4. Major Industry Challenges
3.3. Growth and Development Patterns
3.4. Investment Feasibility Analysis
3.5. Market Opportunity Analysis
3.5.1. Offering
3.5.2. Deployment Model
3.5.3. Enterprise Size
3.5.4. Industry Vertical
3.5.5. Geography

4. Premium Insights
4.1. STAR (Situation, Task, Action, Results) Analysis
4.2. Porter’s Five Forces Analysis
4.2.1. Threat of New Entrants
4.2.2. Bargaining Power of Buyers/Consumers
4.2.3. Bargaining Power of Suppliers
4.2.4. Threat of Substitute Types
4.2.5. Intensity of Competitive Rivalry
4.3. Key Market Trends
4.3.1. Demand Side Trends
4.3.2. Supply Side Trends
4.4. Value Chain Analysis
4.5. Technology Analysis
4.6. Analysis and Recommendations
4.7. Marketing Strategy Analysis
4.7.1. Direct Marketing
4.7.2. Indirect Marketing
4.7.3. Marketing Channel Development Trend

5. Market Positioning of Key Players, 2022
5.1. Company market share of key players, 2022
5.2. Competitive Benchmarking
5.3. Market Positioning of Key Vendors
5.4. Geographical Presence Analysis
5.5. Major Strategies Adopted by Key Players
5.5.1. Key Strategies Analysis
5.5.2. Mergers and Acquisitions
5.5.3. Partnerships
5.5.4. Offering Launch
5.5.5. Geographical Expansion
5.5.6. Others

6. Economic Impact Analysis
6.1. Recession Impact
6.1.1. North America
6.1.2. Europe
6.1.3. Asia Pacific
6.1.4. Latin America
6.1.5. Middle East and Africa
6.2. Ukraine-Russia War Impact
6.2.1. North America
6.2.2. Europe
6.2.3. Asia Pacific
6.2.4. Latin America
6.2.5. Middle East and Africa
6.3. COVID-19 Impact Analysis
6.3.1. North America
6.3.2. Europe
6.3.3. Asia Pacific
6.3.4. Latin America
6.3.5. Middle East and Africa

7. Global Surface and Field Analytics Market
7.1. Global Surface and Field Analytics Market, by Offering, 2017-2030(US$ Bn)
7.1.1. Overview
7.1.2. Global Surface and Field Analytics Market, By Offering, 2022 vs 2030 (in%)
7.1.3. Global Surface and Field Analytics Market, By Software, 2017-2030 (US$ Bn)
7.1.4. Global Surface and Field Analytics Market, By Services, 2017-2030 (US$ Bn)
7.2. Global Surface and Field Analytics Market, by Deployment Model, 2017-2030(US$ Bn)
7.2.1. Overview
7.2.2. Global Surface and Field Analytics Market, By Deployment Model, 2022 vs 2030 (in%)
7.2.3. Global Surface and Field Analytics Market, By On-premise, 2017-2030 (US$ Bn)
7.2.4. Global Surface and Field Analytics Market, By Cloud, 2017-2030 (US$ Bn)
7.3. Global Surface and Field Analytics Market, by Enterprise Size, 2017-2030(US$ Bn)
7.3.1. Overview
7.3.2. Global Surface and Field Analytics Market, By Enterprise Size, 2022 vs 2030 (in%)
7.3.3. Global Surface and Field Analytics Market, By Large Enterprises, 2017-2030 (US$ Bn)
7.3.4. Global Surface and Field Analytics Market, By SMEs, 2017-2030 (US$ Bn)
7.4. Global Surface and Field Analytics Market, by Industry Vertical, 2017-2030(US$ Bn)
7.4.1. Overview
7.4.2. Global Surface and Field Analytics Market, By Industry Vertical, 2022 vs 2030 (in%)
7.4.3. Global Surface and Field Analytics Market, By Automotive and Transportation, 2017-2030 (US$ Bn)
7.4.4. Global Surface and Field Analytics Market, By Smart Cities, 2017-2030 (US$ Bn)
7.4.5. Global Surface and Field Analytics Market, By Energy and Utilities, 2017-2030 (US$ Bn)
7.4.6. Global Surface and Field Analytics Market, By Defense and Intelligence, 2017-2030 (US$ Bn)
7.4.7. Global Surface and Field Analytics Market, By Government, 2017-2030 (US$ Bn)
7.4.8. Global Surface and Field Analytics Market, By Insurance, 2017-2030 (US$ Bn)
7.4.9. Global Surface and Field Analytics Market, By Natural Resources, 2017-2030 (US$ Bn)
7.4.10. Global Surface and Field Analytics Market, By Others, 2017-2030 (US$ Bn)

8. North America Surface and Field Analytics Market Analysis
8.1. North America Surface and Field Analytics Market, by Offering, 2017-2030(US$ Bn)
8.1.1. Overview
8.1.2. SRC Analysis
8.2. North America Surface and Field Analytics Market, by Deployment Model, 2017-2030(US$ Bn)
8.2.1. Overview
8.2.2. SRC Analysis
8.3. North America Surface and Field Analytics Market, by Enterprise Size, 2017-2030(US$ Bn)
8.3.1. Overview
8.3.2. SRC Analysis
8.4. North America Surface and Field Analytics Market, by Industry Vertical, 2017-2030(US$ Bn)
8.4.1. Overview
8.4.2. SRC Analysis
8.5. North America Surface and Field Analytics Market, by Country, 2017-2030 (US$ Bn)
8.5.1. U.S.
8.5.1.1. U.S. Surface and Field Analytics Market Estimates and Forecast, 2017-2030 (US$ Bn)
8.5.1.2. U.S. Surface and Field Analytics, By Offering, 2017-2030 (US$ Bn)
8.5.1.3. U.S. Surface and Field Analytics, By Deployment Model, 2017-2030 (US$ Bn)
8.5.1.4. U.S. Surface and Field Analytics, By Enterprise Size, 2017-2030 (US$ Bn)
8.5.1.5. U.S. Surface and Field Analytics, By Industry Vertical, 2017-2030 (US$ Bn)
8.5.2. Canada
8.5.2.1. Canada Surface and Field Analytics Market Estimates and Forecast, 2017-2030 (US$ Bn)
8.5.2.2. Canada Surface and Field Analytics, By Offering, 2017-2030 (US$ Bn)
8.5.2.3. Canada Surface and Field Analytics, By Deployment Model, 2017-2030 (US$ Bn)
8.5.2.4. Canada Surface and Field Analytics, By Enterprise Size, 2017-2030 (US$ Bn)
8.5.2.5. Canada Surface and Field Analytics, By Industry Vertical, 2017-2030 (US$ Bn)

9. Europe Surface and Field Analytics Market Analysis
9.1. Europe Surface and Field Analytics Market, by Offering, 2017-2030(US$ Bn)
9.1.1. Overview
9.1.2. SRC Analysis
9.2. Europe Surface and Field Analytics Market, by Deployment Model, 2017-2030(US$ Bn)
9.2.1. Overview
9.2.2. SRC Analysis
9.3. Europe Surface and Field Analytics Market, by Enterprise Size, 2017-2030(US$ Bn)
9.3.1. Overview
9.3.2. SRC Analysis
9.4. Europe Surface and Field Analytics Market, by Industry Vertical, 2017-2030(US$ Bn)
9.4.1. Overview
9.4.2. SRC Analysis
9.5. Europe Surface and Field Analytics Market, by Country, 2017-2030 (US$ Bn)
9.5.1. Germany
9.5.1.1. Germany Surface and Field Analytics Market Estimates and Forecast, 2017-2030 (US$ Bn)
9.5.1.2. Germany Surface and Field Analytics, By Offering, 2017-2030 (US$ Bn)
9.5.1.3. Germany Surface and Field Analytics, By Deployment Model, 2017-2030 (US$ Bn)
9.5.1.4. Germany Surface and Field Analytics, By Enterprise Size, 2017-2030 (US$ Bn)
9.5.1.5. Germany Surface and Field Analytics, By Industry Vertical, 2017-2030 (US$ Bn)
9.5.2. France
9.5.2.1. France Surface and Field Analytics Market Estimates and Forecast, 2017-2030 (US$ Bn)
9.5.2.2. France Surface and Field Analytics, By Offering, 2017-2030 (US$ Bn)
9.5.2.3. France Surface and Field Analytics, By Deployment Model, 2017-2030 (US$ Bn)
9.5.2.4. France Surface and Field Analytics, By Enterprise Size, 2017-2030 (US$ Bn)
9.5.2.5. France Surface and Field Analytics, By Industry Vertical, 2017-2030 (US$ Bn)
9.5.3. UK
9.5.3.1. UK Surface and Field Analytics Market Estimates and Forecast, 2017-2030 (US$ Bn)
9.5.3.2. UK Surface and Field Analytics, By Offering, 2017-2030 (US$ Bn)
9.5.3.3. UK Surface and Field Analytics, By Deployment Model, 2017-2030 (US$ Bn)
9.5.3.4. UK Surface and Field Analytics, By Enterprise Size, 2017-2030 (US$ Bn)
9.5.3.5. UK Surface and Field Analytics, By Industry Vertical, 2017-2030 (US$ Bn)
9.5.4. Italy
9.5.4.1. Italy Surface and Field Analytics Market Estimates and Forecast, 2017-2030 (US$ Bn)
9.5.4.2. Italy Surface and Field Analytics, By Offering, 2017-2030 (US$ Bn)
9.5.4.3. Italy Surface and Field Analytics, By Deployment Model, 2017-2030 (US$ Bn)
9.5.4.4. Italy Surface and Field Analytics, By Enterprise Size, 2017-2030 (US$ Bn)
9.5.4.5. Italy Surface and Field Analytics, By Industry Vertical, 2017-2030 (US$ Bn)
9.5.5. Spain
9.5.5.1. Spain Surface and Field Analytics Market Estimates and Forecast, 2017-2030 (US$ Bn)
9.5.5.2. Spain Surface and Field Analytics, By Offering, 2017-2030 (US$ Bn)
9.5.5.3. Spain Surface and Field Analytics, By Deployment Model, 2017-2030 (US$ Bn)
9.5.5.4. Spain Surface and Field Analytics, By Enterprise Size, 2017-2030 (US$ Bn)
9.5.5.5. Spain Surface and Field Analytics, By Industry Vertical, 2017-2030 (US$ Bn)
9.5.6. Rest of Europe
9.5.6.1. Rest of Europe Surface and Field Analytics Market Estimates and Forecast, 2017-2030 (US$ Bn)
9.5.6.2. Rest of Europe Surface and Field Analytics, By Offering, 2017-2030 (US$ Bn)
9.5.6.3. Rest of Europe Surface and Field Analytics, By Deployment Model, 2017-2030 (US$ Bn)
9.5.6.4. Rest of Europe Surface and Field Analytics, By Enterprise Size, 2017-2030 (US$ Bn)
9.5.6.5. Rest of Europe Surface and Field Analytics, By Industry Vertical, 2017-2030 (US$ Bn)

10. Asia Pacific Surface and Field Analytics Market Analysis
10.1. Asia Pacific Surface and Field Analytics Market, by Offering, 2017-2030(US$ Bn)
10.1.1. Overview
10.1.2. SRC Analysis
10.2. Asia Pacific Surface and Field Analytics Market, by Deployment Model, 2017-2030(US$ Bn)
10.2.1. Overview
10.2.2. SRC Analysis
10.3. Asia Pacific Surface and Field Analytics Market, by Enterprise Size, 2017-2030(US$ Bn)
10.3.1. Overview
10.3.2. SRC Analysis
10.4. Asia Pacific Surface and Field Analytics Market, by Industry Vertical, 2017-2030(US$ Bn)
10.4.1. Overview
10.4.2. SRC Analysis
10.5. Asia Pacific Surface and Field Analytics Market, by Country, 2017-2030 (US$ Bn)
10.5.1. China
10.5.1.1. China Surface and Field Analytics Market Estimates and Forecast, 2017-2030 (US$ Bn)
10.5.1.2. China Surface and Field Analytics, By Offering, 2017-2030 (US$ Bn)
10.5.1.3. China Surface and Field Analytics, By Deployment Model, 2017-2030 (US$ Bn)
10.5.1.4. China Surface and Field Analytics, By Enterprise Size, 2017-2030 (US$ Bn)
10.5.1.5. China Surface and Field Analytics, By Industry Vertical, 2017-2030 (US$ Bn)
10.5.2. Japan
10.5.2.1. Japan Surface and Field Analytics Market Estimates and Forecast, 2017-2030 (US$ Bn)
10.5.2.2. Japan Surface and Field Analytics, By Offering, 2017-2030 (US$ Bn)
10.5.2.3. Japan Surface and Field Analytics, By Deployment Model, 2017-2030 (US$ Bn)
10.5.2.4. Japan Surface and Field Analytics, By Enterprise Size, 2017-2030 (US$ Bn)
10.5.2.5. Japan Surface and Field Analytics, By Industry Vertical, 2017-2030 (US$ Bn)
10.5.3. India
10.5.3.1. India Surface and Field Analytics Market Estimates and Forecast, 2017-2030 (US$ Bn)
10.5.3.2. India Surface and Field Analytics, By Offering, 2017-2030 (US$ Bn)
10.5.3.3. India Surface and Field Analytics, By Deployment Model, 2017-2030 (US$ Bn)
10.5.3.4. India Surface and Field Analytics, By Enterprise Size, 2017-2030 (US$ Bn)
10.5.3.5. India Surface and Field Analytics, By Industry Vertical, 2017-2030 (US$ Bn)
10.5.4. South Korea
10.5.4.1. South Korea Surface and Field Analytics Market Estimates and Forecast, 2017-2030 (US$ Bn)
10.5.4.2. South Korea Surface and Field Analytics, By Offering, 2017-2030 (US$ Bn)
10.5.4.3. South Korea Surface and Field Analytics, By Deployment Model, 2017-2030 (US$ Bn)
10.5.4.4. South Korea Surface and Field Analytics, By Enterprise Size, 2017-2030 (US$ Bn)
10.5.4.5. South Korea Surface and Field Analytics, By Industry Vertical, 2017-2030 (US$ Bn)
10.5.5. South-East Asia
10.5.5.1. South-East Asia Surface and Field Analytics Market Estimates and Forecast, 2017-2030 (US$ Bn)
10.5.5.2. South-East Asia Surface and Field Analytics, By Offering, 2017-2030 (US$ Bn)
10.5.5.3. South-East Asia Surface and Field Analytics, By Deployment Model, 2017-2030 (US$ Bn)
10.5.5.4. South-East Asia Surface and Field Analytics, By Enterprise Size, 2017-2030 (US$ Bn)
10.5.5.5. South-East Asia Surface and Field Analytics, By Industry Vertical, 2017-2030 (US$ Bn)
10.5.6. Rest of Asia Pacific
10.5.6.1. Rest of Asia Pacific Surface and Field Analytics Market Estimates and Forecast, 2017-2030 (US$ Bn)
10.5.6.2. Rest of Asia Pacific Surface and Field Analytics, By Offering, 2017-2030 (US$ Bn)
10.5.6.3. Rest of Asia Pacific Surface and Field Analytics, By Deployment Model, 2017-2030 (US$ Bn)
10.5.6.4. Rest of Asia Pacific Surface and Field Analytics, By Enterprise Size, 2017-2030 (US$ Bn)
10.5.6.5. Rest of Asia Pacific Surface and Field Analytics, By Industry Vertical, 2017-2030 (US$ Bn)


11. Latin America Surface and Field Analytics Market Analysis
11.1. Latin America Surface and Field Analytics Market, by Offering, 2017-2030(US$ Bn)
11.1.1. Overview
11.1.2. SRC Analysis
11.2. Latin America Surface and Field Analytics Market, by Deployment Model, 2017-2030(US$ Bn)
11.2.1. Overview
11.2.2. SRC Analysis
11.3. Latin America Surface and Field Analytics Market, by Enterprise Size, 2017-2030(US$ Bn)
11.3.1. Overview
11.3.2. SRC Analysis
11.4. Latin America Surface and Field Analytics Market, by Industry Vertical, 2017-2030(US$ Bn)
11.4.1. Overview
11.4.2. SRC Analysis
11.5. Latin America Surface and Field Analytics Market, by Country, 2017-2030 (US$ Bn)
11.5.1. Brazil
11.5.1.1. Brazil Surface and Field Analytics Market Estimates and Forecast, 2017-2030 (US$ Bn)
11.5.1.2. Brazil Surface and Field Analytics, By Offering, 2017-2030 (US$ Bn)
11.5.1.3. Brazil Surface and Field Analytics, By Deployment Model, 2017-2030 (US$ Bn)
11.5.1.4. Brazil Surface and Field Analytics, By Enterprise Size, 2017-2030 (US$ Bn)
11.5.1.5. Brazil Surface and Field Analytics, By Industry Vertical, 2017-2030 (US$ Bn)
11.5.2. Mexico
11.5.2.1. Mexico Surface and Field Analytics Market Estimates and Forecast, 2017-2030 (US$ Bn)
11.5.2.2. Mexico Surface and Field Analytics, By Offering, 2017-2030 (US$ Bn)
11.5.2.3. Mexico Surface and Field Analytics, By Deployment Model, 2017-2030 (US$ Bn)
11.5.2.4. Mexico Surface and Field Analytics, By Enterprise Size, 2017-2030 (US$ Bn)
11.5.2.5. Mexico Surface and Field Analytics, By Industry Vertical, 2017-2030 (US$ Bn)
11.5.3. Rest of Latin America
11.5.3.1. Rest of Latin America Surface and Field Analytics Market Estimates and Forecast, 2017-2030 (US$ Bn)
11.5.3.2. Rest of Latin America Surface and Field Analytics, By Offering, 2017-2030 (US$ Bn)
11.5.3.3. Rest of Latin America Surface and Field Analytics, By Deployment Model, 2017-2030 (US$ Bn)
11.5.3.4. Rest of Latin America Surface and Field Analytics, By Enterprise Size, 2017-2030 (US$ Bn)
11.5.3.5. Rest of Latin America Surface and Field Analytics, By Industry Vertical, 2017-2030 (US$ Bn)

12. Middle East and Africa Surface and Field Analytics Market Analysis
12.1. Middle East and Africa Surface and Field Analytics Market, by Offering, 2017-2030(US$ Bn)
12.1.1. Overview
12.1.2. SRC Analysis
12.2. Middle East and Africa Surface and Field Analytics Market, by Deployment Model, 2017-2030(US$ Bn)
12.2.1. Overview
12.2.2. SRC Analysis
12.3. Middle East and Africa Surface and Field Analytics Market, by Enterprise Size, 2017-2030(US$ Bn)
12.3.1. Overview
12.3.2. SRC Analysis
12.4. Middle East and Africa Surface and Field Analytics Market, by Industry Vertical, 2017-2030(US$ Bn)
12.4.1. Overview
12.4.2. SRC Analysis
12.5. Middle East and Africa Surface and Field Analytics Market, by Country, 2017-2030 (US$ Bn)
12.5.1. GCC Countries
12.5.1.1. GCC Countries il Surface and Field Analytics Market Estimates and Forecast, 2017-2030 (US$ Bn)
12.5.1.2. GCC Countries Surface and Field Analytics, By Offering, 2017-2030 (US$ Bn)
12.5.1.3. GCC Countries Surface and Field Analytics, By Deployment Model, 2017-2030 (US$ Bn)
12.5.1.4. GCC Countries Surface and Field Analytics, By Enterprise Size, 2017-2030 (US$ Bn)
12.5.1.5. GCC Countries Surface and Field Analytics, By Industry Vertical, 2017-2030 (US$ Bn)
12.5.2. South Africa
12.5.2.1. South Africa Surface and Field Analytics Market Estimates and Forecast, 2017-2030 (US$ Bn)
12.5.2.2. South Africa Surface and Field Analytics, By Offering, 2017-2030 (US$ Bn)
12.5.2.3. South Africa Surface and Field Analytics, By Deployment Model, 2017-2030 (US$ Bn)
12.5.2.4. South Africa Surface and Field Analytics, By Enterprise Size, 2017-2030 (US$ Bn)
12.5.2.5. South Africa Surface and Field Analytics, By Industry Vertical, 2017-2030 (US$ Bn)
12.5.3. Rest of Middle East and Africa
12.5.3.1. Rest of Middle East and Africa Surface and Field Analytics Market Estimates and Forecast, 2017-2030 (US$ Bn)
12.5.3.2. Rest of Middle East and Africa Surface and Field Analytics, By Offering, 2017-2030 (US$ Bn)
12.5.3.3. Rest of Middle East and Africa Surface and Field Analytics, By Deployment Model, 2017-2030 (US$ Bn)
12.5.3.4. Rest of Middle East and Africa Surface and Field Analytics, By Enterprise Size, 2017-2030 (US$ Bn)
12.5.3.5. Rest of Middle East and Africa Surface and Field Analytics, By Industry Vertical, 2017-2030 (US$ Bn)

13. Company Profiles
13.1. Bruker Corporation
13.1.1. Company Overview
13.1.2. Offerings/Biopsy Wires Portfolio
13.1.3. Geographical Presence
13.1.4. Financial Summary
13.1.4.1. Market Revenue and Net Profit (2019-2022)
13.1.4.2. Business Segment Revenue Analysis
13.1.4.3. Geographical Revenue Analysis
13.2. Carl Zeiss AG
13.3. Danaher Corporation
13.4. Jeol Limited
13.5. Nikon Corporation
13.6. Olympus Corporation
13.7. Shimadzu Corporation
13.8. Thermo Fisher Scientific, Inc.
13.9. ULVAN-PHI
13.10. Waters Corporation
13.11. Others

List of Figures
FIG. 1 Global Surface and Field Analytics Market: Research Methodology
FIG. 2 Market Size Estimation – Top Down & Bottom up Approach
FIG. 3 Global Surface and Field Analytics Market Segmentation
FIG. 4 Global Surface and Field Analytics Market, by Offering, 2022 (US$ Bn)
FIG. 5 Global Surface and Field Analytics Market, by Deployment Model, 2022 (US$ Bn)
FIG. 6 Global Surface and Field Analytics Market, by Enterprise Size Type, 2022 (US$ Bn)
FIG. 7 Global Surface and Field Analytics Market, by Industry Vertical, 2022 (US$ Bn)
FIG. 8 Global Surface and Field Analytics Market, by Geography, 2022 (US$ Bn)
FIG. 9 Attractive Investment Proposition, by Offering, 2022
FIG. 10 Attractive Investment Proposition, by Deployment Model, 2022
FIG. 11 Attractive Investment Proposition, by Enterprise Size Type, 2022
FIG. 12 Attractive Investment Proposition, by Industry Vertical, 2022
FIG. 13 Attractive Investment Proposition, by Geography, 2022
FIG. 14 Global Market Share Analysis of Key Surface and Field Analytics Market Manufacturers, 2022
FIG. 15 Global Market Positioning of Key Surface and Field Analytics Market Manufacturers, 2022
FIG. 16 Global Surface and Field Analytics Market Value Contribution, By Offering, 2022 & 2030 (Value %)
FIG. 17 Global Surface and Field Analytics Market, by Software, Value, 2017-2030 (US$ Bn)
FIG. 18 Global Surface and Field Analytics Market, by Services, Value, 2017-2030 (US$ Bn)
FIG. 19 Global Surface and Field Analytics Market, by Biopsy Wires, Value, 2017-2030 (US$ Bn)
FIG. 20 Global Surface and Field Analytics Market, by Guidance Systems, Value, 2017-2030 (US$ Bn)
FIG. 21 Global Surface and Field Analytics Market, by Others, Value, 2017-2030 (US$ Bn)
FIG. 22 Global Surface and Field Analytics Market Value Contribution, By Deployment Model, 2022 & 2030 (Value %)
FIG. 23 Global Surface and Field Analytics Market, by On-premise, Value, 2017-2030 (US$ Bn)
FIG. 24 Global Surface and Field Analytics Market, by Cloud, Value, 2017-2030 (US$ Bn)
FIG. 25 Global Surface and Field Analytics Market, by Biopsy Markers, Value, 2017-2030 (US$ Bn)
FIG. 26 Global Surface and Field Analytics Market, by Mri-Guided Cloud, Value, 2017-2030 (US$ Bn)
FIG. 27 Global Surface and Field Analytics Market, by Surgical Biopsy, Value, 2017-2030 (US$ Bn)
FIG. 28 Global Surface and Field Analytics Market, by Wire Localization, Value, 2017-2030 (US$ Bn)
FIG. 29 Global Surface and Field Analytics Market, by Sentinel Node Biopsy, Value, 2017-2030 (US$ Bn)
FIG. 30 Global Surface and Field Analytics Market Value Contribution, By Enterprise Size, 2022 & 2030 (Value %)
FIG. 31 Global Surface and Field Analytics Market, by Large Enterprises, Value, 2017-2030 (US$ Bn)
FIG. 32 Global Surface and Field Analytics Market, by SMEs, Value, 2017-2030 (US$ Bn)
FIG. 33 Global Surface and Field Analytics Market, by Ct-Guided Biopsy, Value, 2017-2030 (US$ Bn)
FIG. 34 Global Surface and Field Analytics Market, by Other Image-Guided Breast Biopsy, Value, 2017-2030 (US$ Bn)
FIG. 35 Global Surface and Field Analytics Market Value Contribution, By Industry Vertical, 2022 & 2030 (Value %)
FIG. 36 Global Surface and Field Analytics Market, by Automotive and Transportation, Value, 2017-2030 (US$ Bn)
FIG. 37 Global Surface and Field Analytics Market, by Smart Cities, Value, 2017-2030 (US$ Bn)
FIG. 38 Global Surface and Field Analytics Market, by Energy and Utilities, Value, 2017-2030 (US$ Bn)
FIG. 39 Global Surface and Field Analytics Market, by Others, Value, 2017-2030 (US$ Bn)
FIG. 40 U.S. Surface and Field Analytics Market, 2017-2030 (US$ Bn)
FIG. 41 Canada Surface and Field Analytics Market, 2017-2030 (US$ Bn)
FIG. 42 Germany Surface and Field Analytics Market, 2017-2030 (US$ Bn)
FIG. 43 France Surface and Field Analytics Market, 2017-2030 (US$ Bn)
FIG. 44 U.K. Surface and Field Analytics Market, 2017-2030 (US$ Bn)
FIG. 45 Italy Surface and Field Analytics Market, 2017-2030 (US$ Bn)
FIG. 46 Spain Surface and Field Analytics Market, 2017-2030 (US$ Bn)
FIG. 47 Rest of Europe Surface and Field Analytics Market, 2017-2030 (US$ Bn)
FIG. 48 China Surface and Field Analytics Market, 2017-2030 (US$ Bn)
FIG. 49 Japan Surface and Field Analytics Market, 2017-2030 (US$ Bn)
FIG. 50 India Surface and Field Analytics Market, 2017-2030 (US$ Bn)
FIG. 51 South Korea Surface and Field Analytics Market, 2017-2030 (US$ Bn)
FIG. 52 Southeast Asia Surface and Field Analytics Market, 2017-2030 (US$ Bn)
FIG. 53 Rest of Asia Pacific Surface and Field Analytics Market, 2017-2030 (US$ Bn)
FIG. 54 Latin America Surface and Field Analytics Market, 2017-2030 (US$ Bn)
FIG. 55 Brazil Surface and Field Analytics Market, 2017-2030 (US$ Bn)
FIG. 56 Mexico Surface and Field Analytics Market, 2017-2030 (US$ Bn)
FIG. 57 Rest of Latin America Surface and Field Analytics Market, 2017-2030 (US$ Bn)
FIG. 58 Middle East & Africa Surface and Field Analytics Market, 2017-2030 (US$ Bn)
FIG. 59 GCC Countries Surface and Field Analytics Market, 2017-2030 (US$ Bn)
FIG. 60 South Africa Surface and Field Analytics Market, 2017-2030 (US$ Bn)
FIG. 61 Rest of Middle East and Africa Surface and Field Analytics Market, 2017-2030 (US$ Bn)

List of Tables
TABLE 1 Market Snapshot: Global Surface and Field Analytics Market
TABLE 2 Global Surface and Field Analytics Market, by Competitive Benchmarking, 2022
TABLE 3 Global Surface and Field Analytics Market, by Geographical Presence Analysis, 2022
TABLE 4 Global Surface and Field Analytics Market, by Key Strategies Analysis, 2022
TABLE 5 Global Surface and Field Analytics Market, by Offering, 2017-2030 (US$ Bn)
TABLE 6 Global Surface and Field Analytics Market, by Deployment Model, 2017-2030 (US$ Bn)
TABLE 7 Global Surface and Field Analytics Market, by Enterprise Size, 2017-2030 (US$ Bn)
TABLE 8 Global Surface and Field Analytics Market, by Industry Vertical, 2017-2030 (US$ Bn)
TABLE 9 Global Surface and Field Analytics Market, by Geography, 2017-2030 (US$ Bn)
TABLE 10 North America Surface and Field Analytics Market, by Offering, 2017-2030 (US$ Bn)
TABLE 11 North America Surface and Field Analytics Market, by Deployment Model, 2017-2030 (US$ Bn)
TABLE 12 North America Surface and Field Analytics Market, by Enterprise Size, 2017-2030 (US$ Bn)
TABLE 13 North America Surface and Field Analytics Market, by Industry Vertical, 2017-2030 (US$ Bn)
TABLE 14 North America Surface and Field Analytics Market, by Country, 2017-2030 (US$ Bn)
TABLE 15 US Surface and Field Analytics Market, by Offering, 2017-2030 (US$ Bn)
TABLE 16 US Surface and Field Analytics Market, by Deployment Model, 2017-2030 (US$ Bn)
TABLE 17 US Surface and Field Analytics Market, by Enterprise Size, 2017-2030 (US$ Bn)
TABLE 18 US Surface and Field Analytics Market, by Industry Vertical, 2017-2030 (US$ Bn)
TABLE 19 Canada Surface and Field Analytics Market, by Offering, 2017-2030 (US$ Bn)
TABLE 20 Canada Surface and Field Analytics Market, by Deployment Model, 2017-2030 (US$ Bn)
TABLE 21 Canada Surface and Field Analytics Market, by Enterprise Size, 2017-2030 (US$ Bn)
TABLE 22 Canada Surface and Field Analytics Market, by Industry Vertical, 2017-2030 (US$ Bn)
TABLE 23 Europe Surface and Field Analytics Market, by Offering, 2017-2030 (US$ Bn)
TABLE 24 Europe Surface and Field Analytics Market, by Deployment Model, 2017-2030 (US$ Bn)
TABLE 25 Europe Surface and Field Analytics Market, by Enterprise Size, 2017-2030 (US$ Bn)
TABLE 26 Europe Surface and Field Analytics Market, by Industry Vertical, 2017-2030 (US$ Bn)
TABLE 27 Europe Surface and Field Analytics Market, by Country, 2017-2030 (US$ Bn)
TABLE 28 Germany Surface and Field Analytics Market, by Offering, 2017-2030 (US$ Bn)
TABLE 29 Germany Surface and Field Analytics Market, by Deployment Model, 2017-2030 (US$ Bn)
TABLE 30 Germany Surface and Field Analytics Market, by Enterprise Size, 2017-2030 (US$ Bn)
TABLE 31 Germany Surface and Field Analytics Market, by Industry Vertical, 2017-2030 (US$ Bn)
TABLE 32 France Surface and Field Analytics Market, by Offering, 2017-2030 (US$ Bn)
TABLE 33 France Surface and Field Analytics Market, by Deployment Model, 2017-2030 (US$ Bn)
TABLE 34 France Surface and Field Analytics Market, by Enterprise Size, 2017-2030 (US$ Bn)
TABLE 35 France Surface and Field Analytics Market, by Industry Vertical, 2017-2030 (US$ Bn)
TABLE 36 UK Surface and Field Analytics Market, by Offering, 2017-2030 (US$ Bn)
TABLE 37 UK Surface and Field Analytics Market, by Deployment Model, 2017-2030 (US$ Bn)
TABLE 38 UK Surface and Field Analytics Market, by Enterprise Size, 2017-2030 (US$ Bn)
TABLE 39 UK Surface and Field Analytics Market, by Industry Vertical, 2017-2030 (US$ Bn)
TABLE 40 Italy Surface and Field Analytics Market, by Offering, 2017-2030 (US$ Bn)
TABLE 41 Italy Surface and Field Analytics Market, by Deployment Model, 2017-2030 (US$ Bn)
TABLE 42 Italy Surface and Field Analytics Market, by Enterprise Size, 2017-2030 (US$ Bn)
TABLE 43 Italy Surface and Field Analytics Market, by Industry Vertical, 2017-2030 (US$ Bn)
TABLE 44 Spain Surface and Field Analytics Market, by Offering, 2017-2030 (US$ Bn)
TABLE 45 Spain Surface and Field Analytics Market, by Deployment Model, 2017-2030 (US$ Bn)
TABLE 46 Spain Surface and Field Analytics Market, by Enterprise Size, 2017-2030 (US$ Bn)
TABLE 47 Spain Surface and Field Analytics Market, by Industry Vertical, 2017-2030 (US$ Bn)
TABLE 48 Rest of Europe Surface and Field Analytics Market, by Offering, 2017-2030 (US$ Bn)
TABLE 49 Rest of Europe Surface and Field Analytics Market, by Deployment Model, 2017-2030 (US$ Bn)
TABLE 50 Rest of Europe Surface and Field Analytics Market, by Enterprise Size, 2017-2030 (US$ Bn)
TABLE 51 Rest of Europe Surface and Field Analytics Market, by Industry Vertical, 2017-2030 (US$ Bn)
TABLE 52 Asia Pacific Surface and Field Analytics Market, by Offering, 2017-2030 (US$ Bn)
TABLE 53 Asia Pacific Surface and Field Analytics Market, by Deployment Model, 2017-2030 (US$ Bn)
TABLE 54 Asia Pacific Surface and Field Analytics Market, by Enterprise Size, 2017-2030 (US$ Bn)
TABLE 55 Asia Pacific Surface and Field Analytics Market, by Industry Vertical, 2017-2030 (US$ Bn)
TABLE 56 Asia Pacific Surface and Field Analytics Market, by Country, 2017-2030 (US$ Bn)
TABLE 57 China Surface and Field Analytics Market, by Offering, 2017-2030 (US$ Bn)
TABLE 58 China Surface and Field Analytics Market, by Deployment Model, 2017-2030 (US$ Bn)
TABLE 59 China Surface and Field Analytics Market, by Enterprise Size, 2017-2030 (US$ Bn)
TABLE 60 China Surface and Field Analytics Market, by Industry Vertical, 2017-2030 (US$ Bn)
TABLE 61 Japan Surface and Field Analytics Market, by Offering, 2017-2030 (US$ Bn)
TABLE 62 Japan Surface and Field Analytics Market, by Deployment Model, 2017-2030 (US$ Bn)
TABLE 63 Japan Surface and Field Analytics Market, by Enterprise Size, 2017-2030 (US$ Bn)
TABLE 64 Japan Surface and Field Analytics Market, by Industry Vertical, 2017-2030 (US$ Bn)
TABLE 65 India Surface and Field Analytics Market, by Offering, 2017-2030 (US$ Bn)
TABLE 66 India Surface and Field Analytics Market, by Deployment Model, 2017-2030 (US$ Bn)
TABLE 67 India Surface and Field Analytics Market, by Enterprise Size, 2017-2030 (US$ Bn)
TABLE 68 India Surface and Field Analytics Market, by Industry Vertical, 2017-2030 (US$ Bn)
TABLE 69 South Korea Surface and Field Analytics Market, by Offering, 2017-2030 (US$ Bn)
TABLE 70 South Korea Surface and Field Analytics Market, by Deployment Model, 2017-2030 (US$ Bn)
TABLE 71 South Korea Surface and Field Analytics Market, by Enterprise Size, 2017-2030 (US$ Bn)
TABLE 72 South Korea Surface and Field Analytics Market, by Industry Vertical, 2017-2030 (US$ Bn)
TABLE 73 South East Asia Surface and Field Analytics Market, by Offering, 2017-2030 (US$ Bn)
TABLE 74 South East Asia Surface and Field Analytics Market, by Deployment Model, 2017-2030 (US$ Bn)
TABLE 75 South East Asia Surface and Field Analytics Market, by Enterprise Size, 2017-2030 (US$ Bn)
TABLE 76 South East Asia Surface and Field Analytics Market, by Industry Vertical, 2017-2030 (US$ Bn)
TABLE 77 Rest of Asia Pacific Surface and Field Analytics Market, by Offering, 2017-2030 (US$ Bn)
TABLE 78 Rest of Asia Pacific Surface and Field Analytics Market, by Deployment Model, 2017-2030 (US$ Bn)
TABLE 79 Rest of Asia Pacific Surface and Field Analytics Market, by Enterprise Size, 2017-2030 (US$ Bn)
TABLE 80 Rest of Asia Pacific Surface and Field Analytics Market, by Industry Vertical, 2017-2030 (US$ Bn)
TABLE 81 Latin America Surface and Field Analytics Market, by Offering, 2017-2030 (US$ Bn)
TABLE 82 Latin America Surface and Field Analytics Market, by Deployment Model, 2017-2030 (US$ Bn)
TABLE 83 Latin America Surface and Field Analytics Market, by Enterprise Size, 2017-2030 (US$ Bn)
TABLE 84 Latin America Surface and Field Analytics Market, by Industry Vertical, 2017-2030 (US$ Bn)
TABLE 85 Latin America Surface and Field Analytics Market, by Country, 2017-2030 (US$ Bn)
TABLE 86 Brazil Surface and Field Analytics Market, by Offering, 2017-2030 (US$ Bn)
TABLE 87 Brazil Surface and Field Analytics Market, by Deployment Model, 2017-2030 (US$ Bn)
TABLE 88 Brazil Surface and Field Analytics Market, by Enterprise Size, 2017-2030 (US$ Bn)
TABLE 89 Brazil Surface and Field Analytics Market, by Industry Vertical, 2017-2030 (US$ Bn)
TABLE 90 Mexico Surface and Field Analytics Market, by Offering, 2017-2030 (US$ Bn)
TABLE 91 Mexico Surface and Field Analytics Market, by Deployment Model, 2017-2030 (US$ Bn)
TABLE 92 Mexico Surface and Field Analytics Market, by Enterprise Size, 2017-2030 (US$ Bn)
TABLE 93 Mexico Surface and Field Analytics Market, by Industry Vertical, 2017-2030 (US$ Bn)
TABLE 94 Rest of Latin America Surface and Field Analytics Market, by Offering, 2017-2030 (US$ Bn)
TABLE 95 Rest of Latin America Surface and Field Analytics Market, by Deployment Model, 2017-2030 (US$ Bn)
TABLE 96 Rest of Latin America Surface and Field Analytics Market, by Enterprise Size, 2017-2030 (US$ Bn)
TABLE 97 Rest of Latin America Surface and Field Analytics Market, by Industry Vertical, 2017-2030 (US$ Bn)
TABLE 98 Middle East and Africa Surface and Field Analytics Market, by Offering, 2017-2030 (US$ Bn)
TABLE 99 Middle East and Africa Surface and Field Analytics Market, by Deployment Model, 2017-2030 (US$ Bn)
TABLE 100 Middle East and Africa Surface and Field Analytics Market, by Enterprise Size, 2017-2030 (US$ Bn)
TABLE 101 Middle East and Africa Surface and Field Analytics Market, by Industry Vertical, 2017-2030 (US$ Bn)
TABLE 102 Middle East and Africa Surface and Field Analytics Market, by Country, 2017-2030 (US$ Bn)
TABLE 103 GCC Countries Surface and Field Analytics Market, by Offering, 2017-2030 (US$ Bn)
TABLE 104 GCC Countries Surface and Field Analytics Market, by Deployment Model, 2017-2030 (US$ Bn)
TABLE 105 GCC Countries Surface and Field Analytics Market, by Enterprise Size, 2017-2030 (US$ Bn)
TABLE 106 GCC Countries Surface and Field Analytics Market, by Industry Vertical, 2017-2030 (US$ Bn)
TABLE 107 South Africa Surface and Field Analytics Market, by Offering, 2017-2030 (US$ Bn)
TABLE 108 South Africa Surface and Field Analytics Market, by Deployment Model, 2017-2030 (US$ Bn)
TABLE 109 South Africa Surface and Field Analytics Market, by Enterprise Size, 2017-2030 (US$ Bn)
TABLE 110 South Africa Surface and Field Analytics Market, by Industry Vertical, 2017-2030 (US$ Bn)
TABLE 111 Rest of Middle East and Africa Surface and Field Analytics Market, by Offering, 2017-2030 (US$ Bn)
TABLE 112 Rest of Middle East and Africa Surface and Field Analytics Market, by Deployment Model, 2017-2030 (US$ Bn)
TABLE 113 Rest of Middle East and Africa Surface and Field Analytics Market, by Enterprise Size, 2017-2030 (US$ Bn)
TABLE 114 Rest of Middle East and Africa Surface and Field Analytics Market, by Industry Vertical, 2017-2030 (US$ Bn)

Frequently Asked Questions:

How does COVID-19 Impact the global surface and field analytics market?

COVID-19 has had a substantial impact on the market due to the outbreak of the COVID-19 pandemic, which directly suspended unnecessary medical procedures.

Which is the leading region of the market for surface and field analytics?

North America accounted for the most heightened share market.

What are the key drivers for surface and field analytics market growth?

Increasing smart cities and urban planning to drive the surface and field analytics market.

Which is the major industry vertical segment in the surface and field analytics market?

The smart cities segment had a major global market share in 2022.

Which is the major segment in the surface and field analytics market by enterprise size?

The large enterprise segment had a major share in the global market.

Digital Intraoral Sensor and Consumable Market

Published:
Report ID: 35017

Digital Photo Frame Market

Published:
Report ID: 34914

Gift Cards Market

Published:
Report ID: 6518

Cooling Towers Market

Published:
Report ID: 4381

Virtual Reality (VR) Market

Published:
Report ID: 11345

Identity And Access Management (IAM) Market

Published:
Report ID: 6005

Smart Grid Managed Services Market

Published:
Report ID: 10208

Picture Archiving and Communication Systems (PACS) Market

Published:
Report ID: 9676

Chatbots Market

Published:
Report ID: 3733

Over-the-Top (OTT) Market

Published:
Report ID: 8377

Enterprise Video Market

Published:
Report ID: 5414

Enterprise Video Conferencing Market

Published:
Report ID: 5393

Purchase Options

$2999
Delivery Format: Excel.
$4999
Designed for the individual purchaser.
$6999
Users located at a single corporate site or regional office.
$7999
Allowed for unlimited sharing globally within one company.
Smallform of Sample request

Have a question?

User Profile

Don’t settle for less – trust Mitul to help you find the best solution.

Report delivery within 24 to 48 hours

– Other Info –

What people say?-

User Review

I am very impressed with the information in this report. The author clearly did their research when they came up with this product and it has already given me a lot of ideas.

Jana Schmidt
CEDAR CX Technologies

– Connect with us –

Phone

+91 6232 49 3207


support

24/7 Research Support


sales@credenceresearch.com

– Research Methodology –

Going beyond the basics: advanced techniques in research methodology

– Trusted By –

Pepshi, LG, Nestle
Motorola, Honeywell, Johnson and johnson
LG Chem, SIEMENS, Pfizer
Unilever, Samsonite, QIAGEN