
Market overview
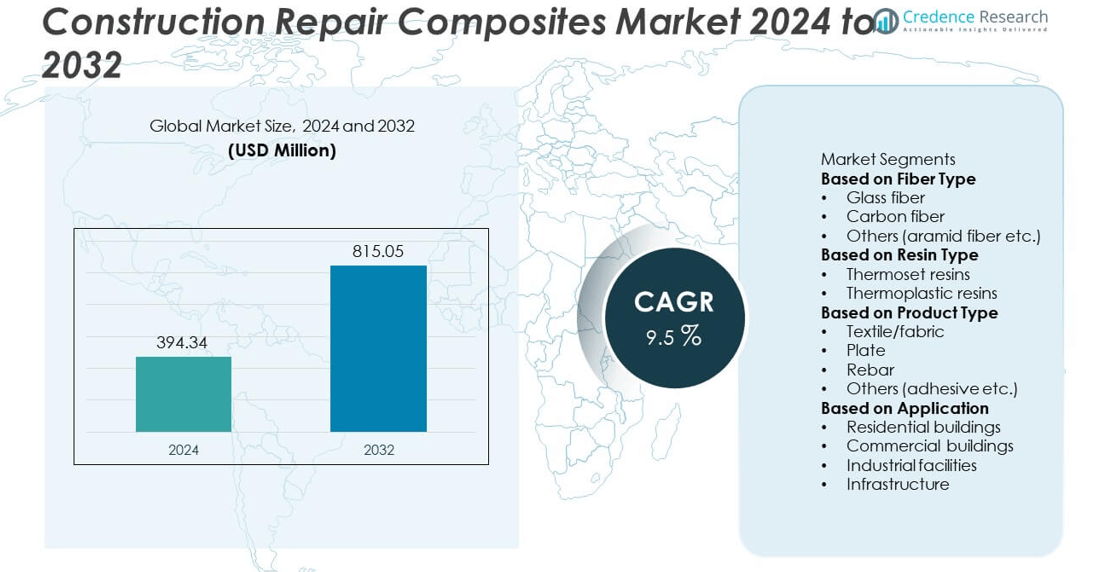
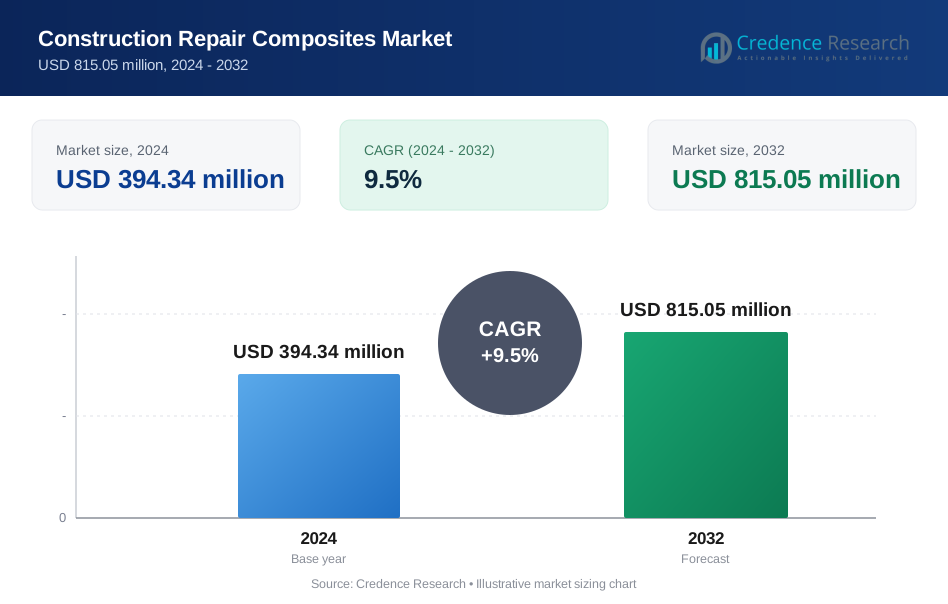
The Construction Repair Composites market was valued at USD 394.34 million in 2024 and is projected to reach USD 815.05 million by 2032, expanding at a CAGR of 9.5% during the forecast period.
| REPORT ATTRIBUTE | DETAILS |
|---|---|
| Historical Period | 2020-2023 |
| Base Year | 2024 |
| Forecast Period | 2025-2032 |
| Construction Repair Composites Market Size 2024 | USD 394.34 million |
| Construction Repair Composites Market, CAGR | 9.5% |
| Construction Repair Composites Market Size 2032 | USD 815.05 million |
The construction repair composites market is driven by major players including Owens Corning, Fosroc, BASF, Creative Composites, Henkel, Dextra, Chomarat, Dow, Mapei, and Master Builders Solutions. These companies focus on developing advanced fiber-reinforced and resin-based solutions to improve structural strength, durability, and sustainability. North America led the market in 2024 with a 33% share, supported by extensive infrastructure rehabilitation and modernization projects. Asia-Pacific followed with a 30% share, driven by rapid urbanization and government-led investments in bridge and building restoration, while Europe held a 28% share, fueled by strict sustainability standards and widespread use of fiber-reinforced composites in structural retrofitting.
Market Insights
- The construction repair composites market was valued at USD 394.34 million in 2024 and is projected to reach USD 815.05 million by 2032, growing at a CAGR of 9.5% during the forecast period.
- Rising infrastructure rehabilitation, aging bridges, and growing preference for durable, corrosion-resistant materials are driving market expansion across construction and utility sectors.
- Advancements in fiber-reinforced materials, resin chemistry, and sustainable composite technologies are key trends enhancing structural repair efficiency and lifespan.
- Leading companies such as Owens Corning, BASF, and Fosroc are investing in high-performance glass and carbon fiber systems to strengthen competitiveness through innovation and regional partnerships.
- North America holds 33%, Asia-Pacific 30%, and Europe 28% market share, while glass fiber leads with 47%, supported by cost-effective performance and high adoption in bridge, tunnel, and building restoration applications.
Market Segmentation Analysis:
By Fiber Type
The glass fiber segment dominated the construction repair composites market in 2024 with a 47% share. Its dominance stems from cost-effectiveness, high tensile strength, and corrosion resistance, making it ideal for structural rehabilitation of bridges, buildings, and marine infrastructure. Glass fiber composites are widely preferred for reinforcing concrete and masonry due to their lightweight and ease of installation. Growing demand for sustainable and long-lasting materials in infrastructure restoration projects further supports this segment. Carbon fiber follows, gaining traction in high-performance applications requiring superior strength-to-weight ratios and enhanced fatigue resistance.
- For instance, Owens Corning developed Advantex® E-CR glass fiber with a tensile strength exceeding 3,450 MPa and modulus of elasticity around 73 GPa. This fiber is designed for corrosion-resistant reinforcement in concrete restoration systems and is used extensively in bridge deck rehabilitation and marine structure repair for its durability in alkaline and saline environments.
By Resin Type
Thermoset resins held the largest share of 68% in 2024, driven by their superior mechanical strength, chemical stability, and resistance to extreme weather conditions. Epoxy-based thermoset systems are the preferred choice for bonding and strengthening concrete structures due to their excellent adhesion and durability. The segment benefits from increasing use in civil engineering repairs, especially in bridges, tunnels, and pipelines. In contrast, thermoplastic resins are gaining attention for their recyclability and fast curing properties, aligning with the construction industry’s shift toward sustainable and energy-efficient materials.
- For instance, BASF's MasterBrace ADH 2200 epoxy resin system provides high bond strength and chemical resistance, making it suitable for structural reinforcement of concrete elements. The system has been reported to cure hard at low temperatures, with an application temperature range of 15°C to 35°C.
By Product Type
Textile/fabric composites led the market in 2024 with a 41% share, attributed to their flexibility, ease of application, and suitability for complex structural geometries. These materials are widely used for wrapping columns, beams, and slabs to enhance load-bearing capacity and prevent failure. Fabric-based systems enable rapid installation with minimal downtime, making them ideal for time-sensitive repair projects. Plate and rebar products also play crucial roles in structural reinforcement applications, while adhesive composites are increasingly used for bonding layers and improving mechanical integration in composite repair systems.
Key Growth Drivers
Rising Infrastructure Rehabilitation Activities
Aging infrastructure and increased demand for structural restoration are key growth drivers for the construction repair composites market. Governments and private sectors are investing heavily in bridge, tunnel, and building rehabilitation to extend service life. Composites offer lightweight, corrosion-resistant, and high-strength solutions that reduce maintenance costs and downtime. Their ability to enhance load capacity without adding significant weight makes them ideal for upgrading aging structures. This growing emphasis on long-term durability and safety in construction is accelerating composite adoption worldwide.
- For instance, Dextra Group introduced its Reforcetech® Glass Fiber Reinforced Polymer (GFRP) bars with tensile strength exceeding 1,000 MPa and elastic modulus of 50 GPa. These bars are used in bridge deck strengthening and concrete repair applications, providing long-term corrosion resistance and reducing overall structural weight while maintaining superior load-bearing performance.
Increasing Preference for Fiber-Reinforced Materials
The shift toward fiber-reinforced materials, such as glass and carbon fibers, is boosting market expansion. These materials provide excellent tensile strength, chemical resistance, and thermal stability compared to conventional steel reinforcements. Their use in repair applications reduces structural fatigue and prevents corrosion in harsh environments. The construction industry’s move toward sustainable and high-performance materials drives demand for composites, particularly in infrastructure repair, seismic retrofitting, and high-rise building reinforcement projects.
- For instance, Mapei developed its MapeWrap C UNI-AX carbon fiber system with a tensile strength of 4,900 MPa and elastic modulus of 230 GPa. The material is applied in seismic retrofitting and structural reinforcement of concrete and masonry buildings, offering enhanced fatigue resistance and improved structural integrity under dynamic loading conditions.
Advancements in Composite Manufacturing Technologies
Technological advancements in composite processing, such as automated fiber placement and resin infusion systems, are enhancing product quality and efficiency. Manufacturers are developing pre-impregnated fabrics and hybrid composites that improve adhesion and curing speed during repair applications. These innovations lower installation time and enhance field performance. Moreover, the integration of digital tools for design simulation and structural analysis is enabling precise repair planning. Such improvements in production and application technologies continue to broaden the use of composites in construction repair projects globally.
Key Trends and Opportunities
Growing Adoption of Sustainable and Recyclable Composites
The industry is witnessing a rising focus on sustainability, leading to the adoption of recyclable thermoplastic composites. These materials offer low environmental impact, reduced energy consumption during production, and easier end-of-life processing. Construction firms are shifting toward eco-friendly composite systems to meet green building standards and regulatory requirements. Manufacturers investing in bio-based resins and recyclable fiber systems are gaining a competitive edge. This trend aligns with global sustainability initiatives and is likely to expand across public infrastructure and commercial repair projects.
- For instance, Chomarat developed its C-PLY™ multiaxial carbon reinforcement, designed to create lighter, more efficient composites for various industries. Used with heavy-tow carbon fibers, C-PLY™ helps the automotive industry meet CO₂ reduction objectives by enabling a reduction in the weight of vehicle structures.
Integration of Digital Inspection and Predictive Maintenance
Digital technologies, including sensors and structural health monitoring (SHM) systems, are being integrated with composite repair solutions. These tools help detect early signs of deterioration and optimize repair planning. Predictive maintenance supported by AI-driven data analysis ensures timely intervention and extends the lifespan of repaired structures. The fusion of composites with digital monitoring improves structural performance and reduces operational costs. This trend supports the construction sector’s transition toward smarter, data-driven maintenance and infrastructure management.
- For instance, researchers and technology firms have developed structural health monitoring systems that integrate embedded piezoelectric sensors within composite materials or coatings. These advanced systems are capable of detecting changes in strain and other indicators, allowing engineers to identify stress accumulation and material fatigue.
Key Challenges
High Material and Installation Costs
The high cost of fiber-reinforced composites compared to traditional materials remains a major barrier. Carbon fiber and epoxy resins are particularly expensive, making them less accessible for small contractors and low-budget projects. Installation requires skilled labor and specialized equipment, increasing total project costs. Although long-term benefits outweigh initial expenses, upfront investment limits market penetration in developing regions. Manufacturers are focusing on cost reduction through material optimization and localized production to make composites more affordable for broader use.
Limited Awareness and Technical Expertise
Insufficient technical knowledge and limited awareness among contractors and engineers hinder wider adoption of construction repair composites. Many professionals remain unfamiliar with composite behavior, installation techniques, and performance standards. This knowledge gap can lead to improper application or underutilization of composite materials. Additionally, the absence of standardized design codes in several regions restricts consistent implementation. Expanding training programs, industry certifications, and awareness campaigns is essential to build technical expertise and ensure safe, effective composite repair practices.
Regional Analysis
North America
North America held a 33% share of the construction repair composites market in 2024, driven by extensive infrastructure rehabilitation and modernization projects. The United States leads regional growth with strong investments in bridge restoration, highway upgrades, and seismic strengthening. The growing use of fiber-reinforced polymers in public infrastructure aligns with sustainability and safety standards. Canada also contributes significantly through infrastructure renewal programs emphasizing corrosion-resistant materials. High awareness of composite benefits, coupled with advanced construction technologies, continues to boost market adoption across the region’s transportation, commercial, and industrial sectors.
Europe
Europe accounted for a 28% share in 2024, supported by stringent environmental regulations and aging infrastructure requiring repair. Countries such as Germany, the United Kingdom, and France are leading adopters of fiber-reinforced composites in bridge and building restoration. The region’s focus on sustainable construction practices drives demand for recyclable and long-lasting materials. EU-funded infrastructure renewal projects and increasing retrofit activities are further expanding the market. Technological advancements in resin systems and fiber materials enhance structural durability, positioning Europe as a key market for high-performance repair solutions.
Asia-Pacific
Asia-Pacific captured a 30% share of the global construction repair composites market in 2024, emerging as the fastest-growing region. Rapid urbanization, rising public infrastructure investments, and government-backed modernization programs are driving composite adoption. China, India, Japan, and South Korea lead regional demand due to expanding construction activities and growing focus on structural reinforcement. Increasing awareness of non-corrosive materials and seismic strengthening needs boosts usage in both residential and commercial projects. The region’s large-scale infrastructure upgrades and shift toward advanced repair technologies ensure strong future market growth.
Latin America
Latin America accounted for a 6% share in 2024, with growth driven by the repair and reinforcement of aging transportation and utility infrastructure. Brazil and Mexico dominate the regional market due to urban redevelopment and government-led modernization projects. Rising awareness of the long-term benefits of fiber-reinforced composites, including durability and corrosion resistance, is improving adoption. However, high material costs and limited local manufacturing constrain faster expansion. Increasing focus on cost-effective composite solutions and infrastructure restoration funding is expected to enhance regional growth over the coming years.
Middle East & Africa
The Middle East & Africa region represented a 3% share in 2024, fueled by expanding construction and infrastructure maintenance initiatives. Countries such as Saudi Arabia, the UAE, and South Africa are adopting advanced composite materials for long-term durability and reduced maintenance. Mega-projects like NEOM and urban infrastructure upgrades in Dubai drive demand for structural repair solutions. The region’s harsh climatic conditions further increase reliance on corrosion-resistant composites. While adoption remains moderate due to cost constraints, rising construction investments and modernization projects are expected to accelerate market growth.
Market Segmentations:
By Fiber Type
- Glass fiber
- Carbon fiber
- Others (aramid fiber etc.)
By Resin Type
- Thermoset resins
- Thermoplastic resins
By Product Type
- Textile/fabric
- Plate
- Rebar
- Others (adhesive etc.)
By Application
- Residential buildings
- Commercial buildings
- Industrial facilities
- Infrastructure
By Geography
- North America
- U.S.
- Canada
- Mexico
- Europe
- Germany
- France
- U.K.
- Italy
- Spain
- Rest of Europe
- Asia Pacific
- China
- Japan
- India
- South Korea
- South-east Asia
- Rest of Asia Pacific
- Latin America
- Brazil
- Argentina
- Rest of Latin America
- Middle East & Africa
- GCC Countries
- South Africa
- Rest of the Middle East and Afric
Competitive Landscape
The competitive landscape of the construction repair composites market includes leading players such as Owens Corning, Fosroc, BASF, Creative Composites, Henkel, Dextra, Chomarat, Dow, Mapei, and Master Builders Solutions. These companies focus on developing advanced fiber-reinforced materials, innovative resin formulations, and sustainable repair systems to enhance structural performance and longevity. Market participants are investing in product diversification, strategic partnerships, and regional expansion to strengthen their global presence. Continuous innovation in glass and carbon fiber technologies, along with faster curing epoxy systems, is improving installation efficiency and durability. Key players also emphasize environmentally friendly and recyclable materials to align with green construction standards. Competitive intensity remains high as firms compete on performance quality, cost-effectiveness, and ease of application to meet rising infrastructure repair and modernization demands worldwide.
Key Player Analysis
- Owens Corning
- Fosroc
- BASF
- Creative Composites
- Henkel
- Dextra
- Chomarat
- Dow
- Mapei
- Master Builders Solutions
Recent Developments
- In May 2025, BASF announced enhancements to its polymer resin systems for repair composites, improving adhesive strength and durability.
- In February 2025, Owens Corning agreed to sell its glass reinforcements business to Praana Group, a move that could reshape its composite products portfolio.
- In February 2025, Fosroc completed its acquisition by Saint-Gobain, bringing its concrete repair, structural strengthening, and chemical product portfolio under the Saint-Gobain umbrella
Report Coverage
The research report offers an in-depth analysis based on Fiber Type, Resin Type, Product Type, Application and Geography. It details leading market players, providing an overview of their business, product offerings, investments, revenue streams, and key applications. Additionally, the report includes insights into the competitive environment, SWOT analysis, current market trends, as well as the primary drivers and constraints. Furthermore, it discusses various factors that have driven market expansion in recent years. The report also explores market dynamics, regulatory scenarios, and technological advancements that are shaping the industry. It assesses the impact of external factors and global economic changes on market growth. Lastly, it provides strategic recommendations for new entrants and established companies to navigate the complexities of the market.
Future Outlook
- Demand for construction repair composites will increase due to rising infrastructure rehabilitation projects worldwide.
- Adoption of sustainable and recyclable composite materials will expand with green construction initiatives.
- Advancements in fiber and resin technologies will enhance strength, durability, and corrosion resistance.
- Growing use of carbon and glass fiber composites will improve structural reinforcement efficiency.
- Integration of automation and digital design tools will streamline repair and retrofitting processes.
- Governments will boost investments in bridge and building restoration, driving composite usage.
- Lightweight, easy-to-install composite systems will gain popularity among contractors.
- Manufacturers will focus on cost reduction and localized production to improve accessibility.
- Public-private partnerships will accelerate adoption of composite repair solutions in aging infrastructure.
- Asia-Pacific will emerge as a key growth hub due to rapid urban development and modernization efforts.
Request a Free Sample
Fill in your details and we'll send you a free sample report.
- Sample data tables & charts
- Research methodology
Need a Custom Version of This Report?
Tailor the scope, geography, or segments to your exact requirements.
- Custom geography or segment scope
- Direct access to our analyst team
Frequently Asked Questions
What is the current market size for the Construction Repair Composites market, and what is its projected size in 2032?
At what Compound Annual Growth Rate is the Construction Repair Composites market projected to grow between 2025 and 2032?
Which Construction Repair Composites market segment held the largest share in 2024?
What are the primary factors fueling the growth of the Construction Repair Composites market?
Who are the leading companies in the Construction Repair Composites market?
Table of Content
Chapter 1. Report Introduction
- 1.1 Report Description & Purpose
- 1.1.1 Report Title & Market Definition
- 1.1.2 Unique Selling Propositions (USP) & Key Differentiators
- 1.1.3 Value Proposition for Stakeholders
- 1.2 Research Objectives
- 1.2.1 Market Sizing Objectives (Volume & Revenue) (Volume Where Applicable)
- 1.2.2 Segmentation Objectives
- 1.2.3 Competitive Intelligence Objectives
- 1.2.4 Forecast & Scenario Objectives
- 1.3 Report Scope
- 1.3.1 Construction Repair Composites Scope – Segments & Subsegments Covered
- 1.3.2 Geographic Scope – Regions & Countries Covered
- 1.3.3 Historical Period, Base Year & Forecast Period (2024; forecast to 2032)
- 1.3.4 Inclusions & Exclusions
- 1.4 Industry Classification & Applicable Codes
- 1.5 Currency, Measurement Units & Valuation Basis
- 1.6 Target Stakeholders
- 1.7 Limitations & Assumptions
Chapter 2. Executive Summary
- 2.1 Global Construction Repair Composites Market Snapshot
- 2.1.1 Market Size – Historical (2024) & Forecast (2024-2032) (2024: USD 394.34 million → 2032: USD 815.05 million)
- 2.1.2 Volume & Revenue – Global Totals (Volume Where Applicable)
- 2.1.3 Key Market Highlights – Top Five Facts
- 2.2 Construction Repair Composites Market Segmentation Snapshot
- 2.2.1 Market Split by Region – 2024 vs. 2032
- 2.3 Competitive Snapshot
- 2.3.1 Top 10 Players by Revenue Share – 2024
- 2.3.2 Top 10 Players by Volume Share – 2024 (Volume Where Applicable)
- 2.3.3 Recent Strategic Developments (18-Month Summary)
- 2.4 Key Investment Highlights & Strategic Conclusions
Chapter 3. Construction Repair Composites Market Dynamics & Industry Analysis
- 3.1 Market Overview & Context
- 3.1.1 Construction Repair Composites Market Position in the Broader Industry Value Chain
- 3.1.2 Demand Structure & Purchasing Dynamics
- 3.1.3 Market Maturity & Development Stage by Region
- 3.2 Construction Repair Composites Market Drivers
- 3.3 Construction Repair Composites Market Restraints & Challenges
- 3.4 Construction Repair Composites Market Opportunities
- 3.5 Porter's Five Forces Analysis
- 3.5.1 Threat of New Entrants
- 3.5.2 Bargaining Power of Suppliers
- 3.5.3 Bargaining Power of Buyers
- 3.5.4 Threat of Substitutes
- 3.5.5 Competitive Rivalry – Intensity Assessment
- 3.6 Construction Repair Composites Value Chain Analysis
- 3.6.1 Upstream – Key Inputs, Resources & Suppliers
- 3.6.1.1 Key Input/Resource 1
- 3.6.1.2 Key Input/Resource 2
- 3.6.1.3 Key Input/Resource 3
- 3.6.2 Midstream – Core Operations & Value Creation
- 3.6.2.1 Operating Model & Process Overview
- 3.6.2.2 Key Operating Locations & Capabilities by Company
- 3.6.3 Downstream – Market Channels & End Users
- 3.6.3.1 Direct Sales & Customer Engagement Channels
- 3.6.3.2 Indirect Sales, Intermediaries & Partner Channels
- 3.6.4 Value Chain Profitability Analysis
- 3.6.1 Upstream – Key Inputs, Resources & Suppliers
- 3.7 PESTEL Analysis
- 3.7.1 Political Factors
- 3.7.2 Economic Factors
- 3.7.3 Social Factors
- 3.7.4 Technological Factors
- 3.7.5 Environmental Factors
- 3.7.6 Legal Factors
- 3.8 Construction Repair Composites Supply Chain Analysis
- 3.8.1 Critical Input & Resource Availability Risk Assessment
- 3.8.2 Supplier & Operational Concentration Risk (Geographic Exposure)
- 3.8.3 Supply & Service Disruption Impact Analysis
- 3.9 Regulatory & Policy Landscape
Note: The regulatory and policy landscape section covers regulations based on their applicability to the market, Construction Repair Composites category, geography, and scope of the study. Only regulatory frameworks with a material impact on operations, compliance, trade, sustainability, or market access are analyzed in detail.
Chapter 4. Key Investment Pockets & Opportunity Analysis
- 4.1 Construction Repair Composites Market Attractiveness Analysis
- 4.1.1 By Region – Investment Attractiveness Matrix (Market Size × CAGR)
- 4.2 Absolute Revenue Growth Opportunity
- 4.2.1 By Region – Absolute Revenue Growth Through 2032
- 4.3 Incremental Demand Opportunity
- 4.3.1 By Region – Incremental Demand Through 2032
- 4.3.2 Segment – Incremental Demand
- 4.4 Emerging Submarket Opportunity Deep Dive (Subject to Applicability)
- 4.5 Priority Market Opportunity Scorecards
- 4.5.1 United States
- 4.5.2 Europe
- 4.5.3 Asia
- 4.5.4 Middle East & Africa
Note: Priority market opportunity scorecards reflect the geographic scope and strategic relevance of the study. Listed markets are indicative and may be adapted to the industry.
Chapter 5. Construction Repair Composites Cross-Border Trade & Market Access Analysis
- 5.1 International Trade & Cross-Border Activity Overview
- 5.1.1 Global Export Value by Country (2024)
- 5.1.2 Global Export Volume by Country (2024) (Volume Where Applicable)
- 5.1.3 Global Import Value by Country (2024)
- 5.1.4 Global Import Volume by Country (2024) (Volume Where Applicable)
- 5.1.5 Net Trade Balance by Country (2024)
- 5.2 Export Analysis – Segment
- 5.2.1 Category 1 (Applicable Classification Code)
- 5.2.2 Category 2 (Applicable Classification Code)
- 5.2.3 Category 3 (Applicable Classification Code)
- 5.2.4 Category 4 (Applicable Classification Code)
- 5.2.5 Category 5 (Applicable Classification Code)
- 5.3 Import Analysis – Segment
- 5.3.1 Category 1 (Applicable Classification Code)
- 5.3.2 Category 2 (Applicable Classification Code)
- 5.3.3 Category 3 (Applicable Classification Code)
- 5.3.4 Category 4 (Applicable Classification Code)
- 5.3.5 Category 5 (Applicable Classification Code)
- 5.4 Cross-Border Pricing & Transaction Benchmarks
- 5.4.1 Export Pricing – Segment & Country
- 5.4.2 Import Pricing – Segment & Source Country
- 5.4.3 Price Trends (2024)
- 5.5 Key Cross-Border Trade & Delivery Routes
- 5.5.1 Cross-Border Trade/Delivery Route 1
- 5.5.2 Cross-Border Trade/Delivery Route 2
- 5.5.3 Cross-Border Trade/Delivery Route 3
- 5.5.4 Cross-Border Trade/Delivery Route 4
- 5.5.5 Cross-Border Trade/Delivery Route 5
- 5.6 Trade Policy & Market Access Impact Assessment
- 5.6.1 Tariff & Non-Tariff Barriers
- 5.6.2 Regional Trade & Economic Integration Frameworks
- 5.6.3 Bilateral & Multilateral Trade Agreements
- 5.6.4 Cross-Border Operating, Licensing & Localization Requirements
Note: This chapter applies where cross-border trade or delivery is relevant to Construction Repair Composites. Goods, services, and digital offerings are assessed using applicable classifications and transaction measures. Import-export volumes, trade balances, and route analyses are included only where meaningful to the market.
Chapter 6. Competitive Landscape & Company Benchmarking
- 6.1 Construction Repair Composites Market Concentration & Structure
- 6.1.1 Herfindahl-Hirschman Index (HHI) – vs. 2024
- 6.1.2 Leading, Mid-Sized & Emerging Player Structure
- 6.1.3 Global, Regional & Local Player Dynamics
- 6.2 Construction Repair Composites Market Share Analysis – 2024
- 6.2.1 Global Revenue Share by Company
- 6.2.2 Global Volume Share by Company (Volume Where Applicable)
- 6.2.3 Regional Revenue Share
- 6.2.4 Market Share Evolution ( vs. 2024)
- 6.2.5 Company Market Share by Key Segment
- 6.2.6 Company Market Share by Customer Group
- 6.3 Operating Scale, Capacity & Infrastructure Analysis
- 6.3.1 Global Operating Scale & Supply Capacity
- 6.3.2 Resource Utilization & Operating Efficiency
- 6.3.3 Output, Service Delivery & Activity Metrics
- 6.3.4 Operating Footprint & Infrastructure Map
- 6.3.5 Planned Operational & Capacity Expansion
- 6.4 Construction Repair Composites Competitive Benchmarking Matrix
- 6.4.1 Revenue, Growth, Profitability & Operating Metric Comparison
- 6.4.2 Channel Revenue Mix
- 6.4.3 Geographic Revenue Exposure
- 6.4.4 R&D Intensity
- 6.4.5 Sustainability Maturity
- 6.5 Strategic Developments in Construction Repair Composites (Last 24 Months)
- 6.5.1 Mergers, Acquisitions & Divestments
- 6.5.2 New Products, Services & Solutions in Construction Repair Composites
- 6.5.3 Operational & Infrastructure Expansions
- 6.5.4 Strategic Alliances, Joint Ventures & Partnerships
- 6.5.5 Distribution Expansion & Market Entry
- 6.5.6 Sustainability & ESG Initiatives
- 6.6 Competitive Strategy Mapping
- 6.6.1 Leader, Challenger, Follower & Niche Classification
- 6.6.2 Pricing Strategy Comparison
- 6.6.3 Channel Strategy Matrix
Note: Strategic developments are included based on their materiality and the availability of reliable information.
Chapter 7. Global Construction Repair Composites Market – By Sales & Delivery Channel
- 7.1 Segment Overview
- 7.1.1 Volume & Revenue Split by Channel (2024 & 2032) (Volume Where Applicable)
- 7.1.2 Channel Mix Evolution (2024-2032)
Chapter 8. Regional Market Analysis – Global Overview
- 8.1 Global Regional Overview
- 8.1.1 Regional Volume Share (Volume Where Applicable)
- 8.1.2 Regional Revenue Share
- 8.1.3 Regional Volume by Region (Volume Where Applicable)
- 8.1.4 Regional Revenue by Region
- 8.1.5 Regional Forecast Through 2032
- 8.2 Cross-Regional Segment Analysis
- 8.2.1 By Sales & Delivery Channel
- 8.2.2 By Competitive Positioning & Price Tier
Chapter 9. North America Construction Repair Composites Market
- 9.1 United States
- 9.2 Canada
- 9.3 Mexico
Chapter 10. Europe Construction Repair Composites Market
- 10.1 Germany
- 10.2 France
- 10.3 Italy
- 10.4 United Kingdom
- 10.5 Spain
- 10.6 Poland
- 10.7 Russia
- 10.8 Netherlands
- 10.9 Belgium
- 10.10 Sweden
- 10.11 Denmark
- 10.12 Norway
- 10.13 Rest of Europe
Chapter 11. Asia Pacific Construction Repair Composites Market
- 11.1 China
- 11.2 India
- 11.3 Japan
- 11.4 South Korea
- 11.5 Thailand
- 11.6 Indonesia
- 11.7 Vietnam
- 11.8 Malaysia
- 11.9 Australia
- 11.10 Rest of Asia Pacific
Chapter 12. Latin America Construction Repair Composites Market
- 12.1 Brazil
- 12.2 Argentina
- 12.3 Colombia
- 12.4 Chile
- 12.5 Rest of Latin America
Chapter 13. Middle East Construction Repair Composites Market
- 13.1 Saudi Arabia
- 13.2 United Arab Emirates
- 13.3 Turkey
- 13.4 Israel
- 13.5 Iran
- 13.6 Rest of the Middle East
Chapter 14. Africa Construction Repair Composites Market
- 14.1 South Africa
- 14.2 Egypt
- 14.3 Nigeria
- 14.4 Morocco
- 14.5 Rest of Africa
Chapter 15. Construction Repair Composites Company Profiles
- 15.1 [Company 01]
- 15.1.1 Company Overview
- 15.1.2 Key Management Personnel
- 15.1.3 Products & Services Portfolio
- 15.1.4 Financial Performance
- 15.1.5 Key Market Focus & Geographic Presence
- 15.1.6 Recent Developments & Strategic Initiatives
Note: The company profile list is preliminary and may change based on research findings, market developments, data availability, and client requirements.
Chapter 16. Appendices
- Appendix A – List of Abbreviations & Acronyms
- Appendix B – Industry Classification Code Reference – Full Series
- Appendix C – Supply, Output & Operating Capacity Data Tables
- Appendix D – End-Use & Demand Base Tables
- Appendix E – Demand, Adoption & Usage Assumptions
- Appendix F – Pricing & Revenue Metric Reference Tables
- Appendix G – Company Operations & Infrastructure Database
- Appendix H – Cross-Border Trade & Activity Data Tables (Where Applicable)
- Appendix I – Regulatory Summary Tables
- Appendix J – Primary Research Participant List (Anonymized)
- Appendix K – Primary Research Questionnaire Framework
- Appendix L – Data Sources & Bibliography
- Appendix M – Market Size Divergence & Source Comparison
Chapter 17. Research Methodology
- 17.1 Research Framework & Philosophy
- 17.2 Secondary Research – Sources, Hierarchy & Data Extraction
- 17.3 Data Modeling – Bottom-Up & Top-Down Market Sizing
- 17.4 Primary Research – Stakeholder Framework, LOI & Sample Sizes
- 17.5 Forecast Methodology – Regression, Scenario & Sensitivity Analysis
- 17.6 Quality Control – Four-Layer Validation Framework
- 17.7 Limitations & Standard Assumptions
- 17.8 Disclaimer
