Market Overview
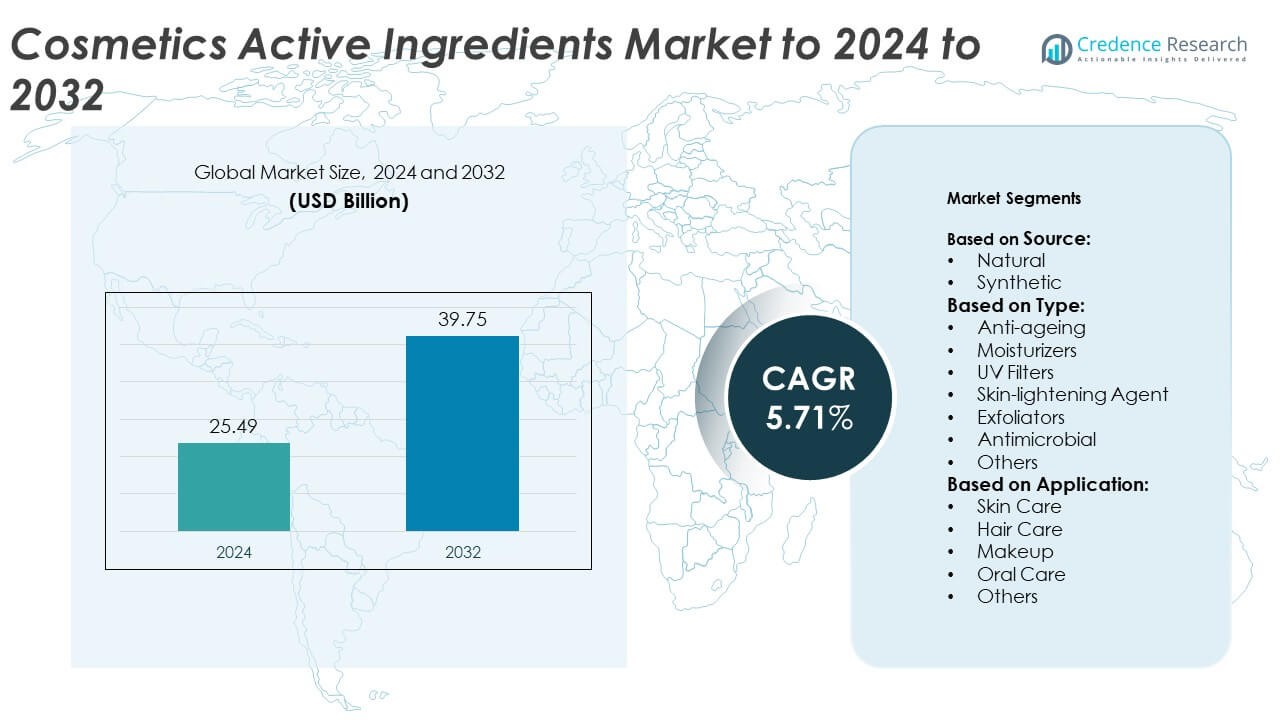
Cosmetics Active Ingredients Market size was valued USD 25.49 Billion in 2024 and is anticipated to reach USD 39.75 Billion by 2032, at a CAGR of 5.71% during the forecast period.
| REPORT ATTRIBUTE |
DETAILS |
| Historical Period |
2020-2023 |
| Base Year |
2024 |
| Forecast Period |
2025-2032 |
| Cosmetics Active Ingredients Market Size 2024 |
USD 25.49 Billion |
| Cosmetics Active Ingredients Market, CAGR |
5.71% |
| Cosmetics Active Ingredients Market Size 2032 |
USD 39.75 Billion |
The cosmetics active ingredients market is led by BASF SE, Evonik Industries AG, Ashland, Clariant AG, Beiersdorf AG, AkzoNobel N.V., Eastman Chemical Company, Lucas Meyer Cosmetics, Seppic SA, and Lonza. These companies focus on sustainable ingredient development, advanced biotechnological processes, and high-performance formulations to meet growing consumer demand for natural and multifunctional products. North America emerged as the leading region in 2024, accounting for about 32% of the global market share, driven by strong innovation capabilities, premium skincare adoption, and increasing preference for clean-label cosmetic ingredients across the U.S. and Canada.
Access crucial information at unmatched prices!
Request your sample report today & start making informed decisions powered by Credence Research Inc.!
Download Sample
Market Insights
- The cosmetics active ingredients market was valued at USD 25.49 billion in 2024 and is projected to reach USD 39.75 billion by 2032, growing at a CAGR of 5.71%.
- Growing consumer demand for natural, sustainable, and bio-based ingredients drives market expansion, supported by technological advances in biotechnology and green chemistry.
- The market is witnessing strong trends in personalized skincare, multifunctional actives, and encapsulation technologies enhancing ingredient efficiency and product performance.
- Competition remains high as major players focus on innovation, partnerships, and eco-friendly formulations to meet evolving regulatory and consumer expectations.
- North America led the market with 32% share in 2024, followed by Europe at 28% and Asia-Pacific at 27%, while the natural source segment dominated overall with 64% of the total share.
Market Segmentation Analysis:
By Source
Natural ingredients dominated the Cosmetics Active Ingredients Market in 2024, capturing around 64% of the total share. This dominance is driven by rising consumer preference for clean-label, plant-derived formulations and increasing awareness of synthetic chemical risks. Brands are integrating botanical extracts, essential oils, and bio-fermented actives for safer and eco-friendly cosmetics. Regulatory support for sustainable sourcing and biodegradable components further strengthens natural ingredient adoption. Synthetic ingredients continue to hold relevance in cost-effective, performance-oriented formulations, particularly in mass-market skincare and sunscreen products where stability and consistency are critical.
- For instance, BASF’s Verdessence biopolymer line offers 5 ingredients for personal care applications, ranging from color cosmetics to hair care, with the company showcasing its portfolio expansion at in-cosmetics 2024 and launching new, natural-based ingredients in subsequent years.
By Type
Anti-ageing ingredients led the market in 2024, accounting for approximately 31% of the total share. The segment’s growth stems from expanding demand for retinoids, peptides, and antioxidants that combat wrinkles and boost collagen production. Consumers in the 30–50 age group are increasingly adopting preventive skincare routines, fueling this dominance. Moisturizers and UV filters follow, supported by continuous innovation in hydration-enhancing hyaluronic acid and broad-spectrum protection products. Companies are developing multifunctional actives that combine anti-ageing and moisturizing benefits, catering to both premium and daily skincare formulations globally.
- For instance, Lucas Meyer Cosmetics’ Corneopeptyl is backed by 9 clinical studies and was tested at 1% use level, with effects tracked over 7/14/28 days.
By Application
Skin care was the leading application segment in 2024, securing nearly 45% of the market share. Its leadership is driven by rising use of anti-ageing, moisturizing, and brightening actives in serums, creams, and lotions. The growing popularity of personalized skincare and daily protection routines boosts consistent demand for effective active formulations. Hair care and makeup segments are also expanding, supported by the inclusion of functional actives like keratin boosters, UV filters, and antioxidants. Increasing consumer focus on holistic beauty and health-based cosmetics further sustains the dominance of skin care applications worldwide.
Key Growth Drivers
Rising Demand for Natural and Sustainable Ingredients
Growing consumer awareness about ingredient safety and environmental impact is driving demand for natural actives. Brands increasingly use plant-based extracts, bio-fermented peptides, and marine actives to meet clean beauty standards. Regulatory encouragement for eco-friendly sourcing and biodegradable formulations further supports this shift. As consumers move away from synthetic additives, manufacturers invest in green chemistry and biotechnology to deliver effective, sustainable ingredients that align with ethical and environmental values.
- For instance, Croda provides verified carbon-footprint data for 1,500+ Beauty Care product codes.
Expanding Anti-Ageing and Skincare Segments
The global rise in skincare routines and age-prevention products is a key growth accelerator. Anti-ageing actives such as retinoids, hyaluronic acid, and peptides are gaining traction across both premium and mass-market formulations. Growing middle-class populations in Asia-Pacific and rising spending on self-care boost sales of performance-driven skincare. The industry also benefits from social media influence, where consumer focus on appearance and skin health fuels product innovation in multi-functional and science-backed cosmetics.
- For instance, Beiersdorf ran 3 clinical studies with 43 volunteers each and a 160-person use test for its epigenetic skincare.
Technological Advancements in Ingredient Formulation
Rapid progress in biotechnology, nanotechnology, and encapsulation techniques enhances the effectiveness and stability of cosmetic actives. Companies now develop microencapsulated vitamins, peptides, and antioxidants for targeted release and deeper skin penetration. These innovations improve product performance while reducing irritation risks, expanding applications across sensitive skin and daily-use categories. The combination of R&D investment and AI-based ingredient screening is accelerating personalized formulations, creating new opportunities for differentiation in a competitive global market.
Key Trends & Opportunities
Growth of Personalized and Functional Cosmetics
Personalized skincare is reshaping the cosmetics active ingredients landscape. Data-driven analysis and AI-based diagnostics enable tailored product formulations matching individual skin needs. Consumers increasingly prefer multifunctional cosmetics offering hydration, protection, and repair in a single product. This trend drives demand for adaptive actives such as niacinamide and ceramides. The integration of digital beauty platforms and DNA-based skincare further enhances personalization, opening opportunities for brands to deliver targeted, high-value cosmetic solutions.
- For instance, Givaudan operates 62 creation/research centres and 78 production sites across 162 locations, enabling localized active development.
Rising Popularity of Biotechnology-Derived Ingredients
Biotechnology-derived actives are gaining momentum due to their high purity, traceability, and eco-efficiency. Companies use bio-fermentation and enzyme engineering to produce peptides, polysaccharides, and antioxidants with minimal environmental impact. These bio-actives offer enhanced performance consistency compared to natural extraction methods. As sustainability regulations tighten, biotech innovation provides a competitive edge to manufacturers focused on clean-label, cruelty-free, and vegan formulations, expanding opportunities in both developed and emerging cosmetic markets.
- For instance, DSM-Firmenich reports 15 R&D centres, about 340 global locations, and a team of 30,000 supporting Perfumery & Beauty innovation.
Key Challenges
High Development Costs and Complex Regulations
Developing advanced cosmetic actives requires significant investment in R&D, clinical testing, and regulatory compliance. Global regulations such as EU REACH and FDA oversight demand rigorous safety validation, increasing time-to-market. Smaller firms face barriers due to high formulation costs and certification requirements. Complex labeling and sustainability standards further add to compliance expenses, limiting entry for new players and challenging innovation speed in a highly competitive environment.
Supply Chain Vulnerabilities for Natural Ingredients
The dependence on plant-based and bio-derived raw materials exposes the market to sourcing risks. Seasonal fluctuations, climate change, and agricultural instability affect ingredient availability and pricing. Geopolitical disruptions can also impact cross-border trade of botanical extracts and essential oils. Companies must secure resilient supply networks and invest in local cultivation or lab-grown alternatives to reduce volatility. Maintaining consistent quality and traceability across global supply chains remains a persistent challenge for manufacturers.
Regional Analysis
North America
North America held the largest share of around 32% in the cosmetics active ingredients market in 2024. The region’s dominance is supported by high consumer spending on premium skincare and anti-ageing products. Strong demand for natural, clean-label, and dermatologically tested ingredients drives market expansion. The United States remains the key contributor due to advanced R&D, product innovation, and strong presence of global brands. Increasing adoption of multifunctional actives in daily-use cosmetics and personalized skincare further strengthens regional growth, supported by strategic collaborations between ingredient manufacturers and cosmetic product developers.
Europe
Europe accounted for nearly 28% of the cosmetics active ingredients market share in 2024. The region benefits from well-established cosmetic industries in France, Germany, and Italy, along with strict regulatory frameworks promoting sustainable and cruelty-free formulations. Consumers in Europe prefer natural and bio-based actives, boosting the use of plant-derived antioxidants, peptides, and vitamins. The region’s focus on eco-certifications and traceability enhances market credibility. Growing investment in biotechnological ingredient production and rising adoption of vegan formulations continue to propel market development across both mass and luxury cosmetic segments.
Asia-Pacific
Asia-Pacific captured approximately 27% of the global cosmetics active ingredients market in 2024, showing the fastest growth rate. Expanding middle-class populations in China, India, Japan, and South Korea are fueling demand for skincare and anti-ageing products. The region’s dominance in manufacturing and raw material supply offers competitive advantages for cosmetic producers. Rapid urbanization and growing awareness of personal grooming boost product adoption. Local brands increasingly integrate natural actives, while global firms expand through regional R&D centers. Evolving beauty trends and the influence of K-beauty innovations continue to shape market dynamics across Asia-Pacific.
Latin America
Latin America accounted for around 8% of the cosmetics active ingredients market share in 2024. Brazil and Mexico are leading contributors, driven by strong domestic beauty industries and growing demand for skincare and haircare products. The region shows rising preference for botanical and tropical plant-derived actives, supported by abundant biodiversity. Expanding e-commerce and the popularity of affordable natural cosmetics stimulate market penetration. However, limited access to advanced formulation technologies and high import costs for specialized ingredients slightly restrict broader market growth potential in certain Latin American economies.
Middle East & Africa
The Middle East & Africa region held nearly 5% of the cosmetics active ingredients market share in 2024. Increasing consumer awareness of skincare routines and rising disposable income are driving steady market expansion. The demand for anti-ageing, moisturizing, and sun-protection actives grows across urban centers in the UAE, Saudi Arabia, and South Africa. Local production capabilities remain limited, encouraging imports of specialized ingredients from Europe and Asia. The rising influence of global beauty trends, coupled with a shift toward halal-certified and natural formulations, supports sustainable growth in the regional cosmetics sector.
Market Segmentations:
By Source:
By Type:
- Anti-ageing
- Moisturizers
- UV Filters
- Skin-lightening Agent
- Exfoliators
- Antimicrobial
- Others
By Application:
- Skin Care
- Hair Care
- Makeup
- Oral Care
- Others
By Geography:
- North America
- Europe
- Germany
- France
- U.K.
- Italy
- Spain
- Rest of Europe
- Asia Pacific
- China
- Japan
- India
- South Korea
- South-east Asia
- Rest of Asia Pacific
- Latin America
- Brazil
- Argentina
- Rest of Latin America
- Middle East & Africa
- GCC Countries
- South Africa
- Rest of the Middle East and Africa
Competitive Landscape
BASF SE, Evonik Industries AG, Ashland, Clariant AG, Beiersdorf AG, AkzoNobel N.V., Eastman Chemical Company, Lucas Meyer Cosmetics, Seppic SA, and Lonza are the leading companies in the cosmetics active ingredients market. The competition is defined by continuous innovation, sustainability focus, and advanced formulation capabilities. Major players emphasize R&D investments to develop multifunctional, bio-based, and skin-friendly ingredients that meet rising consumer expectations for clean beauty. Strategic mergers, partnerships, and regional expansions are common to strengthen global presence and enhance supply reliability. Companies are also adopting biotechnological processes and digital formulation tools to optimize performance and cost efficiency. Increasing demand for transparency, efficacy, and traceability continues to push market participants toward developing high-quality, certified, and eco-conscious active ingredient portfolios.
Shape Your Report to Specific Countries or Regions & Enjoy 30% Off!
Key Player Analysis
Recent Developments
- In 2025, Eastman Chemical Company Launched Esmeri CC1N10, a sustainable, biodegradable cellulose ester micropowder for color cosmetics, meeting EU regulations for microparticles
- In 2024, Beiersdorf AG Launched Epicelline®, a breakthrough epigenetic anti-aging active, in its new Eucerin Hyaluron-Filler Epigenetic Serum.
- In 2023, Ashland Launched Perfectyl™ biofunctional, a high-tech chamomile extract inspired by aesthetic techniques to clarify and smooth skin flaws.
- In 2023, BASF SE Showcased sustainable and innovative ingredients, like the starch-based Cosmedia HP Starch and the natural-based UV particle Tinomax™ CC.
Report Coverage
The research report offers an in-depth analysis based on Source, Type, Application and Geography. It details leading market players, providing an overview of their business, product offerings, investments, revenue streams, and key applications. Additionally, the report includes insights into the competitive environment, SWOT analysis, current market trends, as well as the primary drivers and constraints. Furthermore, it discusses various factors that have driven market expansion in recent years. The report also explores market dynamics, regulatory scenarios, and technological advancements that are shaping the industry. It assesses the impact of external factors and global economic changes on market growth. Lastly, it provides strategic recommendations for new entrants and established companies to navigate the complexities of the market.
Future Outlook
- The cosmetics active ingredients market will experience steady growth driven by skincare innovation.
- Natural and plant-derived actives will continue gaining dominance over synthetic ingredients.
- Biotechnology and fermentation-based production will improve ingredient efficiency and purity.
- Anti-ageing and moisturizing actives will remain the most in-demand product categories.
- Personalized skincare using AI-based diagnostics will drive demand for targeted formulations.
- Sustainable sourcing and eco-certification will become key differentiators for manufacturers.
- Asia-Pacific will emerge as the fastest-growing regional market with strong consumer adoption.
- Advances in encapsulation and nanotechnology will enhance ingredient delivery systems.
- Regulatory focus on safety and transparency will shape future formulation strategies.
- Strategic partnerships between ingredient suppliers and cosmetic brands will accelerate product innovation.


