Market Overview:
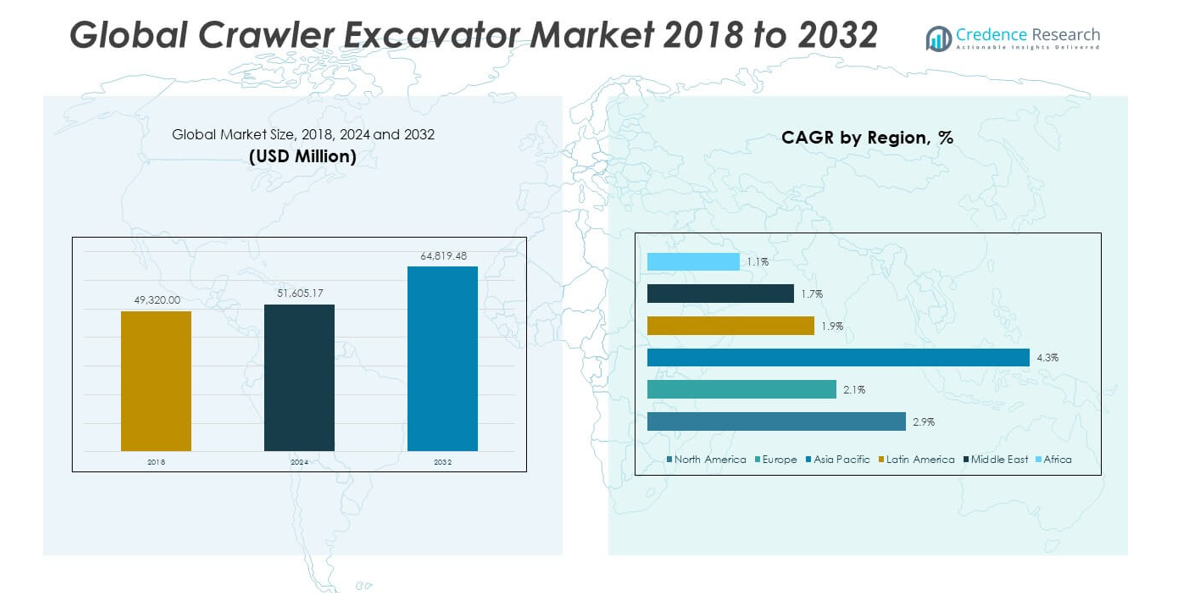
The Crawler Excavator Market size was valued at USD 49,320 million in 2018, reached USD 51,605.17 million in 2024, and is anticipated to reach USD 64,819.48 million by 2032, at a CAGR of 2.92% during the forecast period.
| REPORT ATTRIBUTE |
DETAILS |
| Historical Period |
2020-2023 |
| Base Year |
2024 |
| Forecast Period |
2025-2032 |
| Crawler Excavator Market Size 2024 |
USD 51,605.17 million |
| Crawler Excavator Market, CAGR |
2.92% |
| Crawler Excavator Market Size 2032 |
USD 64,819.48 million |
Urbanization and infrastructure renewal are accelerating global demand for crawler excavators. Government investments in highways, railways, and energy projects support this rise. Resource-rich nations also boost demand through expanded mining and oil exploration. Technological advances, like automation and telematics, enhance safety and productivity. Manufacturers now focus on hybrid and low-emission models to meet environmental standards. Leasing options and financial aid in emerging economies improve accessibility for smaller contractors. Versatility across agriculture, forestry, and municipal uses ensures continued relevance of crawler excavators across multiple industries.
Asia Pacific dominates the crawler excavator market, led by China, India, and Southeast Asia, where infrastructure growth and urban expansion remain priorities. Projects related to smart cities and transport development drive strong demand. North America follows with steady investment in residential and energy sectors, plus the need to replace aging equipment. Europe grows gradually due to renovations and stricter green regulations. Latin America’s mining activities show promise, especially in Brazil and Chile. Middle East benefits from large-scale planning, while Africa faces uptake challenges despite potential.
Market Insights:
- The Crawler Excavator Market was valued at USD 51,605.17 million in 2024 and is projected to reach USD 64,819.48 million by 2032.
It reflects steady growth driven by infrastructure expansion, urbanization, and technological upgrades in construction machinery.
- Urban infrastructure, mining operations, and public sector projects are primary demand drivers across global regions.
These sectors rely heavily on crawler excavators for large-scale digging, material handling, and terrain-specific applications.
- Mining exploration and resource extraction projects in Asia Pacific and Latin America are boosting equipment demand.
Their ability to withstand tough environments positions crawler excavators as essential assets in mineral and energy zones.
- Integration of telematics, automation, and hybrid technology is transforming the product landscape.
It enables enhanced productivity, predictive maintenance, and compliance with global emission regulations.
- High initial investment and maintenance costs restrict adoption among smaller contractors and in low-income regions.
This challenge limits direct ownership and shifts demand toward rental models and shared equipment services.
- Asia Pacific leads in both growth rate and adoption due to rapid urbanization and infrastructure rollout.
North America and Europe maintain strong shares due to replacement demand and regulatory-driven upgrades.
- OEMs expanding into rental services, electric models, and customization options are unlocking new market opportunities.
Their agility in addressing user-specific needs and cost concerns supports long-term competitiveness and penetration.
Access crucial information at unmatched prices!
Request your sample report today & start making informed decisions powered by Credence Research Inc.!
Download Sample
Market Drivers:
Robust Infrastructure Development Fuels Demand
The global push for infrastructure renewal significantly drives the Crawler Excavator Market. Governments across developing and developed countries are investing heavily in transportation networks, bridges, tunnels, dams, and urban expansion. These initiatives demand reliable, high-capacity excavation equipment with advanced digging and mobility capabilities. Private construction companies also support this growth by scaling commercial real estate and logistics infrastructure. The crawler excavator fits large-scale foundation work due to its ability to operate on rough terrains. OEMs are responding with machines that combine power and precision to meet modern construction requirements. This alignment of supply and demand sustains consistent market momentum.
- For example, Komatsu’s recent PC490LC-11crawler excavator, launched in 2023, is engineered specifically for heavy-duty infrastructure work, offering a bucket capacity of 2.5–3.0 m³ and a maximum digging depth of 7.9 meters, as detailed in their official product specifications.
Mining and Quarrying Activities Strengthen Market Base
The mining sector plays a vital role in propelling the crawler excavator industry forward. Extraction of metals, coal, and aggregates from surface and sub-surface operations requires rugged, long-endurance machines. Several countries are expanding mineral output to meet export and industrial demand, particularly in South America, Africa, and Asia. The crawler excavator performs well in harsh operating environments, making it a preferred solution across exploration stages. With higher load-bearing capacity and advanced operator control systems, it supports deeper excavation and consistent operation under stress. Governments supporting mineral exploration licenses further boost procurement of heavy-duty machines.
- For instance, Liebherr’s R 9800, one of the largest mining excavators, delivers a bucket capacity of 42 m³and an operating weight of 800 tonnes, enabling efficient removal of overburden and ore.
Technological Advancement Elevates Efficiency and Safety
The Crawler Excavator Market benefits from integration of automation, telematics, and fuel optimization features. Manufacturers are designing models with advanced hydraulic control, intelligent sensors, and real-time diagnostics that enhance operational efficiency. Contractors rely on data-driven insights to manage project costs, schedule maintenance, and ensure safe usage. Fuel-efficient and hybrid models reduce operational overhead and comply with environmental norms. Semi-autonomous and remote-controlled excavators are now entering commercial sites to improve productivity and minimize human risk. These technological upgrades create strong customer value and enhance lifecycle benefits of the equipment.
Rental Ecosystems Expand Access in Cost-Sensitive Markets
Construction companies with limited capital prefer to lease high-capacity equipment rather than invest in full ownership. The crawler excavator’s high cost and specialization make it a logical fit for time-bound or project-specific leasing. Rental providers offer flexible packages for short-term infrastructure or seasonal excavation projects. The growth of equipment rental platforms enables contractors to access advanced models with less financial commitment. This trend extends market reach, especially in small to mid-sized urban developments and remote project zones. Leasing also supports equipment trials before long-term procurement decisions.
Market Trends:
Rapid Shift Toward Electrification and Eco-Friendly Designs
The shift toward sustainable construction practices encourages the development of hybrid and electric crawler excavators. Construction firms, especially in urban zones, prioritize noise reduction and lower carbon emissions. Manufacturers are releasing compact, battery-powered models designed for light to medium operations. These machines offer zero emissions and are suitable for regulatory-compliant construction zones. Governments are promoting subsidies and tax incentives for electric machinery procurement, adding momentum. This trend introduces new product categories and expands the market beyond traditional diesel-driven segments. The crawler excavator industry now focuses on designing performance-oriented yet eco-compliant solutions.
- The EC300E Hybrid, for example, boasts an operating weight between 65,477–85,539 lbs, with a 253 hpengine capable of delivering high performance for medium to heavy-duty tasks. The machine’s hybrid system captures and regenerates energy during upper structure movements, significantly improving fuel efficiency without compromising productivity.
Integration of Smart Controls and Remote Monitoring
Digital transformation across the construction equipment industry is reshaping the operational landscape. The crawler excavator now features telematics-enabled systems that track location, usage hours, fuel efficiency, and health diagnostics. Fleet managers use cloud-connected dashboards for remote oversight and predictive maintenance planning. These tools reduce operational downtime and enhance equipment utilization. Embedded software supports customizable work modes, real-time alerts, and remote lockout features. This connectivity transforms the crawler excavator from a manual operator-dependent tool into a smart asset in construction ecosystems.
Growth of Compact Excavators for Urban Operations
Compact crawler excavators are witnessing increased demand due to limited urban workspace and rising utility infrastructure projects. Their smaller size enables them to work near buildings, roads, and pipes without compromising digging power. Construction companies prefer short-tail and super long front variants for maneuverability and reach. Cities investing in telecom cabling, drainage, and maintenance services also adopt compact excavators for quick access and faster turnaround. Manufacturers are engineering high-efficiency compact machines with low ground pressure and multifunctional attachments. This evolving product category diversifies the customer base.
- The Volvo ECR235E, for example, operates with an optimized short swing radiusand an operating weight of 52,250–61,440 lbs, while maintaining a digging reach of 32′ 5″ and a breakout force of 28,100 lbf in standard mode
Emphasis on Modular Design and Operator Comfort
Modern crawler excavators now emphasize user-friendly cabins, ergonomic seating, better visibility, and air filtration systems. Prolonged work durations and rising focus on operator health encourage design refinements. Modular components, customizable attachments, and easy access panels improve serviceability and deployment across varied terrains. The crawler excavator now includes touch interfaces, climate control, and digital diagnostics in base models. These user-focused upgrades elevate brand differentiation and ensure better productivity. Manufacturers are integrating design thinking to attract both large contractors and independent operators.
Market Challenges Analysis:
Capital Constraints and Cost-Sensitive Procurement Patterns
The Crawler Excavator Market faces resistance from small and mid-sized enterprises due to the high acquisition and ownership cost. Entry-level models still require significant capital, and advanced variants with telematics and automation further increase pricing. Maintenance costs are high, particularly in remote or harsh operating regions. Service personnel with expertise in diagnostics and electrical systems are often unavailable in secondary markets. Delayed spare part availability and the cost of downtimes impact total cost of ownership. Price-sensitive customers delay procurement or switch to older refurbished models or shared ownership solutions.
Supply Chain Gaps and Raw Material Volatility
The global supply chain for crawler excavator components remains vulnerable to geopolitical disruptions, freight delays, and raw material pricing fluctuations. OEMs rely on complex sourcing networks for hydraulic systems, steel assemblies, electronics, and sensors. Market fluctuations in metal prices and electronic chips have affected production timelines and procurement costs. Manufacturing delays disrupt delivery commitments and reduce dealer confidence. These uncertainties lower order volumes and increase inventory pressures across regions. High exposure to international trade regulations also adds compliance risks.
Market Opportunities:
Strong Pipeline of Infrastructure Mega Projects
Several countries are launching high-investment transportation, energy, and housing projects, creating a steady demand base. The Crawler Excavator Market is well-positioned to benefit from highway expansion, metro line installations, and renewable energy plant construction. Public sector initiatives and international development funding back many of these projects. OEMs offering models with high fuel efficiency and large digging capacities gain preference. Construction contractors seek suppliers with stable delivery schedules and product support infrastructure. This wave of capital investment expands the addressable market globally.
Emerging Applications in Agriculture and Waste Management
Beyond construction and mining, crawler excavators are now finding adoption in agricultural operations, water conservation projects, and municipal waste management. Applications include irrigation trenching, pond digging, embankment reinforcement, and landfill layering. Attachments designed for soil aeration, vegetation clearance, or organic handling are gaining demand. This diversification improves equipment utility across seasons and geographies. Manufacturers targeting rural markets with region-specific features and after-sales networks can tap into a largely underpenetrated customer base.
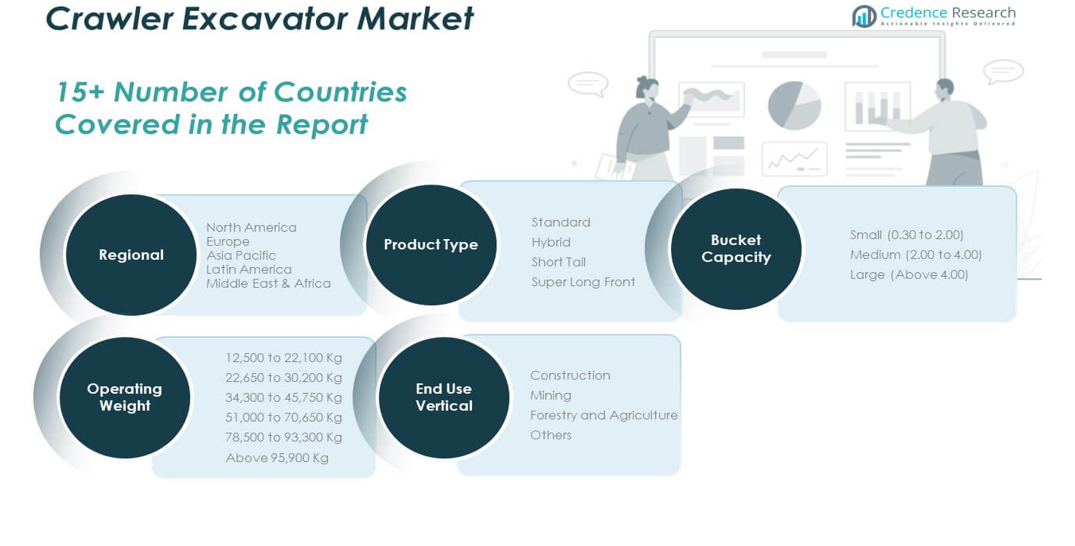
Market Segmentation Analysis:
The Crawler Excavator Market features a broad segmentation structure based on product type, bucket capacity, end-use vertical, and operating weight.
By product type Standard excavators continue to dominate the product type segment due to their balanced capabilities for general construction, infrastructure, and industrial projects. Hybrid models are gaining momentum among environmentally conscious buyers looking for fuel efficiency and emission control. Short tail and super long front variants serve niche applications in confined urban spaces or large-scale digging respectively.
- For instance, Komatsu’s HB365LC-3 Hybrid excavator delivers up to 20% fuel savings compared to conventional non-hybrid models. The machine combines a powerful 271 hp engine with an electric swing motor and energy regeneration system, which captures kinetic energy during swing deceleration to assist with subsequent operations.
By bucket capacity, medium excavators (2.00 to 4.00) are widely preferred for infrastructure and utility work due to their versatility. Large capacity buckets above 4.00 are more suited for heavy-duty mining and deep trenching operations. The small segment finds traction in agriculture and landscaping.
- For example, Hitachi’s EX5600-7 mining excavator features a bucket capacity ranging from 27 to 29 m³ in the loading shovel configuration and up to 34 m³ in the backhoe configuration. It is deployed in large-scale mining operations, including copper mines in Chile such as Esperanza Sur.
By end-use vertical, construction is the leading vertical, driving demand through public works, residential expansion, and transport infrastructure. Mining also plays a critical role, especially in resource-rich geographies. Forestry and agriculture are emerging end-use sectors using crawler excavators for land clearing, trenching, and irrigation.
By operating weight, the 22,650 to 30,200 Kg segment holds significant share due to its adaptability across mid-scale construction and industrial tasks. The above 95,900 Kg segment, though niche, is crucial for large-scale mining and infrastructure megaprojects requiring high digging force and reach.
Segmentation:
By Product Type
- Standard
- Hybrid
- Short Tail
- Super Long Front
By Bucket Capacity
- Small (0.30 to 2.00)
- Medium (2.00 to 4.00)
- Large (Above 4.00)
By End-Use Vertical
- Construction
- Mining
- Forestry and Agriculture
- Others
By Operating Weight
- 12,500 to 22,100 Kg
- 22,650 to 30,200 Kg
- 34,300 to 45,750 Kg
- 51,000 to 70,650 Kg
- 78,500 to 93,300 Kg
- Above 95,900 Kg
By Region
- North America
- Europe
- Germany
- France
- U.K.
- Italy
- Spain
- Rest of Europe
- Asia Pacific
- China
- Japan
- India
- South Korea
- South-east Asia
- Rest of Asia Pacific
- Latin America
- Brazil
- Argentina
- Rest of Latin America
- Middle East & Africa
- GCC Countries
- South Africa
- Rest of the Middle East and Africa
Regional Analysis:
The North America Crawler Excavator Market size was valued at USD 20,517.12 million in 2018 to USD 21,240.38 million in 2024 and is anticipated to reach USD 26,647.41 million by 2032, at a CAGR of 2.9% during the forecast period. North America holds the largest share of the global Crawler Excavator Market in 2024, accounting for 41.15%. The U.S. leads the region with ongoing infrastructure modernization, particularly in highways, metro expansion, and energy grid upgrades. Aging equipment fleets push replacement demand, while smart city initiatives sustain procurement across states. Canada’s mining and urban transit developments contribute to stable growth. The presence of major OEMs and robust dealer networks ensures product availability, aftermarket services, and technological innovation. Strong financing structures and equipment rental penetration support adoption among mid-sized contractors.
The Europe Crawler Excavator Market size was valued at USD 11,984.76 million in 2018 to USD 12,012.27 million in 2024 and is anticipated to reach USD 14,179.43 million by 2032, at a CAGR of 2.1% during the forecast period. Europe represents 23.28% of the global Crawler Excavator Market in 2024. Germany, France, and the UK dominate regional demand through investments in infrastructure rehabilitation, inter-city rail networks, and residential upgrades. Demand for hybrid and compact models is rising due to strict emissions regulations and space-constrained construction. Projects like urban redevelopment, energy-efficient housing, and waste treatment infrastructure sustain consistent deployment. OEMs in Europe also benefit from favorable procurement programs and public-private partnerships.
The Asia Pacific Crawler Excavator Market size was valued at USD 10,653.12 million in 2018 to USD 11,706.42 million in 2024 and is anticipated to reach USD 16,418.83 million by 2032, at a CAGR of 4.3% during the forecast period. Asia Pacific holds a 22.68% share in 2024 and remains the fastest-growing region. China and India continue to invest in transportation networks, industrial parks, and affordable housing. Southeast Asia contributes through road, hydro, and energy infrastructure. OEMs benefit from volume-driven demand and lower manufacturing costs. Strong government policy backing and regional manufacturing hubs enhance local availability of models across segments. Regional players and global brands compete actively on pricing, service, and customization.
The Latin America Crawler Excavator Market size was valued at USD 2,860.56 million in 2018 to USD 2,961.62 million in 2024 and is anticipated to reach USD 3,427.01 million by 2032, at a CAGR of 1.9% during the forecast period. Latin America contributes 5.74% to global revenue in 2024. Brazil and Chile anchor demand through mining and urban projects. Investment in energy and road infrastructure continues to attract international equipment suppliers. However, inflationary pressures, import dependencies, and policy instability slow full-scale adoption. Leasing solutions gain traction, and government contracts drive demand in public works.
The Middle East Crawler Excavator Market size was valued at USD 1,923.48 million in 2018 to USD 1,888.41 million in 2024 and is anticipated to reach USD 2,145.88 million by 2032, at a CAGR of 1.7% during the forecast period. Middle East accounts for 3.66% of the global market in 2024. GCC countries dominate through mega infrastructure projects and tourism-focused urban expansion. Saudi Arabia and UAE lead adoption of large and mid-sized crawler excavators for NEOM, airport, and rail development. Projects in renewable energy and water infrastructure also use heavy excavation machinery. The region relies on global OEMs and strategic dealership tie-ups for technology access.
The Africa Crawler Excavator Market size was valued at USD 1,380.96 million in 2018 to USD 1,796.07 million in 2024 and is anticipated to reach USD 2,000.93 million by 2032, at a CAGR of 1.1% during the forecast period. Africa represents 3.48% of the market in 2024. South Africa, Egypt, and Kenya are primary demand centers. Road construction, mining concessions, and industrial zone development continue to create demand. Limited local manufacturing and equipment financing remain hurdles. OEMs with strong regional partnerships and financing models see higher traction in public and private procurement programs.
Shape Your Report to Specific Countries or Regions & Enjoy 30% Off!
Key Player Analysis:
- Tata Hitachi
- Komatsu
- JCB
- Doosan
- Caterpillar
- BEML
- SANY
- Volvo
- Kobelco
- Hyundai
Competitive Analysis:
The Crawler Excavator Market is highly competitive with both global and regional manufacturers offering a broad range of equipment for varied applications. Major players differentiate themselves through technology integration, product variety, fuel efficiency, and after-sales service networks. Companies like Caterpillar, Komatsu, and Tata Hitachi leverage their extensive dealer ecosystems and R&D strength to maintain strong brand equity. Regional players such as BEML and SANY focus on price-to-performance and market-specific customization. Mergers, new product launches, and strategic localization efforts intensify the competition. OEMs that adapt to emission norms, offer digital features, and ensure part availability sustain long-term market presence.
Recent Developments:
- In January 2025, JCB unveiled its latest 8008E CTS electric micro excavator ahead of the Executive Hire Show in Coventry, UK. This new 1.0-tonne model is all-electric and joins the company’s E-TECH range, meeting the growing demand for quiet, zero-emission machines suitable for urban and indoor projects, while still matching the diesel equivalent in performance.
- In December 2024, Tata Hitachi launched the NX50 Mini Excavator, a significant step in its next-generation series, designed for enhanced power, efficiency, and operator comfort in urban and confined construction sites. The compact NX50 features a 33.5 HP engine and a versatile bucket capacity, aiming to address the evolving needs of modern construction projects with improved performance and reduced maintenance.
- In July 2024, Komatsu expanded its North American lineup by introducing four new demolition excavator models from its European range, including versatile high-reach and straight boom crawler excavators. This move underscores Komatsu’s commitment to catering to the fast-growing demolition segment, offering customizable solutions for varied working environments and increased operational efficiency.
Market Concentration & Characteristics:
The Crawler Excavator Market is moderately concentrated, with key players accounting for significant revenue share globally. High entry barriers due to capital intensity and technical expertise limit the influx of new competitors. The market exhibits strong brand loyalty, especially in heavy-duty segments. Product lifecycle spans several years, encouraging emphasis on service, refurbishment, and leasing options. Buyers prioritize operational reliability, total cost of ownership, and after-sales support over unit pricing alone. Regional demand variation leads to localized manufacturing and distribution networks. Regulatory influence, especially on emissions and safety, shapes product development and procurement policies.
Report Coverage:
The research report offers an in-depth analysis based on product type, bucket capacity, end-use vertical, and operating weight. It details leading market players, providing an overview of their business, product offerings, investments, revenue streams, and key applications. Additionally, the report includes insights into the competitive environment, SWOT analysis, current market trends, as well as the primary drivers and constraints. Furthermore, it discusses various factors that have driven market expansion in recent years. The report also explores market dynamics, regulatory scenarios, and technological advancements that are shaping the industry. It assesses the impact of external factors and global economic changes on market growth. Lastly, it provides strategic recommendations for new entrants and established companies to navigate the complexities of the market.
Future Outlook:
- Infrastructure development in emerging nations will continue to drive long-term demand for crawler excavators across road, rail, and energy sectors.
- Hybrid and electric excavators will gain wider adoption due to stricter emission norms and sustainability goals in urban zones.
- Telematics and automation features will become standard, improving fleet management, machine uptime, and jobsite efficiency.
- Equipment rentals and leasing will rise as SMEs and short-duration projects avoid upfront capital investment.
- Compact and short-tail models will dominate in space-restricted urban construction, telecom, and utility work.
- Mining sector growth in Asia Pacific, Africa, and Latin America will boost demand for heavy-duty high-tonnage models.
- Localized manufacturing and regional dealer networks will shape OEM competitiveness in price-sensitive markets.
- Digital integration across job sites will enhance productivity, reduce idle time, and improve cost control.
- Operator comfort, visibility, and cabin ergonomics will gain priority to meet evolving workforce and safety standards.
- Agriculture, land management, and disaster recovery applications will expand the crawler excavator’s relevance beyond traditional construction use.


