Market Overview
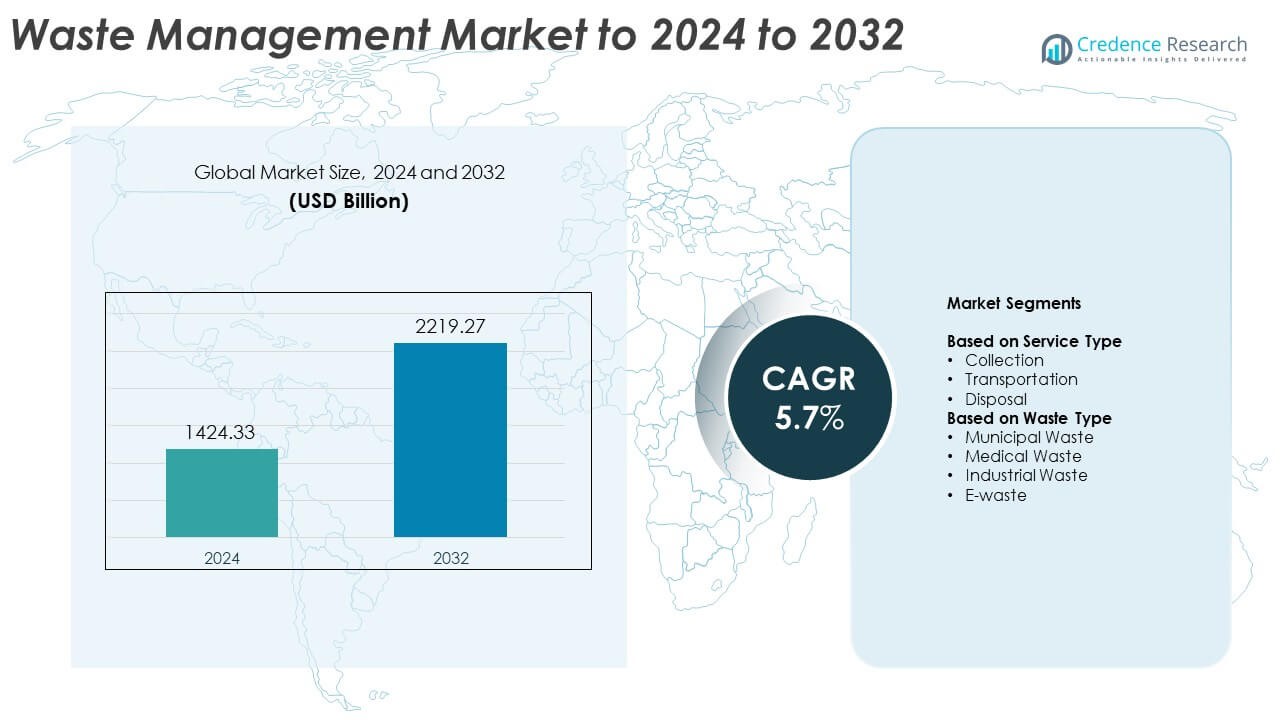
Waste management market size was valued USD 1424.33 billion in 2024 and is anticipated to reach USD 2219.27 billion by 2032, at a CAGR of 5.7% during the forecast period.
| REPORT ATTRIBUTE |
DETAILS |
| Historical Period |
2020-2023 |
| Base Year |
2024 |
| Forecast Period |
2025-2032 |
| Waste Management Market Size 2024 |
USD 1424.33 Billion |
| Waste Management Market, CAGR |
5.7% |
| Waste Management Market Size 2032 |
USD 2219.27 Billion |
The waste management market features major players such as Republic Services, Clean Harbors, SIAAP, Biffa, Reworld Holding Corporation, Waste Connections, Veolia, Valicor, WM Intellectual Property Holdings, L.L.C., Suez, and Daiseki Co., Ltd., all competing through broad service portfolios, regulated operations, and strong recycling and disposal networks. These companies focus on expanding treatment capacity, upgrading smart collection systems, and strengthening hazardous waste solutions to meet rising environmental compliance needs. North America emerged as the leading region in 2024 with about 34% share, supported by advanced infrastructure, strict regulatory standards, and high adoption of digital waste handling technologies across municipalities and industrial sectors.
Access crucial information at unmatched prices!
Request your sample report today & start making informed decisions powered by Credence Research Inc.!
Download Sample
Market Insights
- The waste management market reached USD 1424.33 billion in 2024 and will achieve USD 2219.27 billion by 2032, growing at a CAGR of 5.7%.
- Rising urban waste generation and stricter environmental rules drive stronger demand for regulated collection, recycling, and disposal services.
- Digital routing tools, automated sorting lines, and waste-to-energy projects shape current trends as operators seek higher efficiency and better material recovery.
- Competitive activity grows as major companies expand treatment capacity, pursue long-term municipal contracts, and strengthen hazardous and industrial waste portfolios.
- North America led the market with about 34% share in 2024, while municipal waste remained the dominant segment with nearly 63% share across global waste streams.
Market Segmentation Analysis:
By Service Type
Collection dominated the service-type segment in 2024 with about 56% share, supported by rising urban waste volumes and strict city-level sanitation rules. Municipal bodies and private operators expanded door-to-door logistics as households generated more mixed waste from packaged goods and e-commerce deliveries. Collection services grew further due to smart routing systems and sensor-based bins that reduced fuel use and improved pickup frequency. Transportation and disposal services advanced at a steady pace, yet collection remained the largest segment because most waste-handling contracts prioritize regular pickup cycles to prevent overflow in dense urban areas.
- For instance, Veolia treated 63 million tonnes of waste in 2023, according to its annual results.
By Waste Type
Municipal waste led the waste-type segment in 2024 with nearly 63% share, driven by high output from households, retail activity, and food service operators across cities. Governments increased segregation rules and recycling targets, which boosted handling needs for organic, plastic, and paper fractions. Rapid urbanization added more residential complexes, raising daily mixed-waste loads. Medical, industrial, and e-waste streams expanded due to higher hospital activity, manufacturing output, and device consumption, but municipal waste stayed dominant because it remains the most consistent and large-volume category handled by public and private waste operators.
- For instance, SUEZ reported processing almost 28 million tonnes of waste in 2023 in its non-financial performance statement.
Key Growth Drivers
Rising Urban Waste Generation
Cities produced larger daily waste volumes due to population growth, packaged goods use, and rapid commercial activity. Urban households generated more mixed waste, which pushed municipalities to expand formal collection networks and recycling capacity. Governments invested in smart bins, GPS tracking, and material recovery systems to reduce overflow and improve pickup reliability. This steady rise in urban waste loads strengthened long-term demand for organized waste management services across emerging and developed regions.
- For instance, Biffa states that its plastics operations now have capacity for 213,000 tonnes of plastic recycling per year, up from 63,000 tonnes in 2019.
Stricter Environmental Regulations
Regulatory bodies enforced tighter rules on landfill use, hazardous waste handling, and recycling performance. Compliance requirements encouraged industries, hospitals, and commercial facilities to adopt certified waste services instead of informal disposal. Extended producer responsibility programs increased formal demand for collection, sorting, and material recovery operations. These measures supported safer disposal methods and pushed companies to upgrade infrastructure, which fueled sustained adoption of regulated waste management solutions.
- For instance, Indorama Ventures expanded its Juiz de Fora recycling plant in Brazil from 9,000 tons to 25,000 tons of PET per year and is targeting recycling 50 billion PET bottles annually by 2025.
Expansion of Industrial and Healthcare Activity
Industrial units and healthcare networks generated higher waste volumes as production lines expanded and medical services scaled up. Manufacturing facilities increased solid, chemical, and process-related waste streams that required specialized handling and treatment. Hospitals, clinics, and diagnostic centers produced more biomedical waste as patient loads rose. This growth created steady demand for compliant treatment systems, licensed disposal partners, and advanced waste-tracking technologies across major economies.
Key Trends & Opportunities
Adoption of Digital and Automation Technologies
Waste operators used route-optimization tools, RFID tags, robotic sorters, and AI-based quality checks to improve efficiency. Automated sorting enabled higher recovery of plastics, metals, and paper, which increased recycling yields. Digital platforms supported real-time bin monitoring and predictive maintenance for fleets. This shift created new opportunities for technology vendors and strengthened operational accuracy for waste processors seeking to reduce costs and enhance sustainability performance.
- For instance, TOMRA’s sensor-based sorting technology at Dubai’s FARZ materials recovery facility enables processing of around 1,200 tons of commercial and municipal waste per day.
Rising Investment in Recycling Infrastructure
Companies and governments increased funding for material recovery facilities, composting plants, and advanced plastic recycling units. High global focus on circular economy models encouraged industries to shift toward recycled inputs. Improved sorting and treatment facilities created opportunities for growth in reclaimed materials such as PET, paper fiber, metals, and organics. This trend opened new revenue streams for operators that could supply high-quality secondary resources to packaging, textile, and construction industries.
- For instance, Sims Limited recycled approximately 8 million tonnes of proprietary ferrous and non-ferrous metals in fiscal year 2023 through its global network of facilities.
Growth of E-waste and Hazardous Waste Streams
Consumer electronics use expanded, which increased discarded devices and components. Industrial sectors also produced more hazardous residues needing certified handling and disposal. These specialized waste categories created opportunities for operators with expertise in safe dismantling, data-safe e-waste processing, and chemical treatment systems. Demand rose for compliant facilities that meet strict environmental standards, boosting growth in niche segments such as lithium battery recycling and PCB recovery.
Key Challenges
High Operational and Infrastructure Costs
Collection fleets, treatment facilities, trained staff, and safety systems require significant capital and operating expenditure. Many municipalities struggle to fund modern waste systems, which limits service reach in suburban and rural zones. Rising fuel prices and maintenance costs also reduce margins for private operators. These financial pressures slow infrastructure upgrades and restrict adoption of advanced technologies in low-revenue regions.
Inefficient Segregation and Informal Waste Handling
Poor waste segregation at the household and commercial levels reduces recycling efficiency and contaminates material streams. Informal waste collection networks dominate in many developing regions, leading to unsafe practices and inconsistent quality. Lack of awareness and limited enforcement weaken adoption of structured disposal methods. This challenge disrupts material recovery, limits recycling rates, and increases landfill dependence across many cities.
Regional Analysis
North America
North America held about 34% share in 2024, driven by strong regulatory systems, advanced recycling plants, and high municipal spending on solid waste services. The United States expanded landfill diversion goals, which increased demand for material recovery and composting facilities. Canada strengthened extended producer responsibility laws, pushing industries toward certified waste partners. High urban waste volumes and strong industrial output supported stable demand across collection, transportation, and disposal services. Rising adoption of digital fleet tools and automated sorting technologies further enhanced operational efficiency across large cities.
Europe
Europe accounted for nearly 29% share in 2024, supported by strict sustainability policies and high recycling targets under the EU Waste Framework Directive. Countries such as Germany, France, and the Netherlands expanded advanced sorting lines and waste-to-energy projects to reduce landfill dependency. Circular economy initiatives encouraged manufacturers to raise recycled content usage, strengthening demand for quality secondary materials. Strong compliance enforcement and robust municipal systems helped maintain high service reliability. Industrial and hazardous waste services also grew as regional regulations mandated safer handling standards across various sectors.
Asia Pacific
Asia Pacific captured about 28% share in 2024, driven by rapid urbanization, rising consumer waste, and expanding industrial activity. China advanced large-scale recycling and waste-to-energy investments, while India boosted national programs focused on segregation and scientific disposal. Growing healthcare networks increased medical waste volumes, creating stronger demand for compliant treatment systems. Southeast Asian countries worked on modernizing waste logistics to address rising plastic and food waste loads. The region’s large population base and fast economic growth positioned Asia Pacific as one of the most dynamic markets for future waste management capacity expansion.
Latin America
Latin America held roughly 6% share in 2024, supported by gradual improvements in municipal waste systems and stronger policy focus on landfill reduction. Brazil and Mexico increased investment in urban collection coverage and recycling initiatives, aiming to reduce informal handling. Growth in packaged consumer goods raised mixed-waste volumes, pushing cities to adopt better sorting and transport systems. Private operators expanded services in major metropolitan areas, while new partnerships helped improve medical and industrial waste treatment capacity. Regional modernization efforts continued to improve service quality across key countries.
Middle East and Africa
Middle East and Africa accounted for nearly 3% share in 2024, shaped by ongoing infrastructure development and rising waste generation from expanding urban centers. Gulf countries invested in large-scale waste-to-energy plants and improved recycling frameworks to reduce landfill dependency. African nations worked to upgrade collection networks and formalize waste systems in fast-growing cities. Industrial expansion increased demand for hazardous and construction waste handling. Growing awareness of environmental protection encouraged public-private partnerships that supported wider adoption of structured waste management practices across priority urban zones.
Market Segmentations:
By Service Type
- Collection
- Transportation
- Disposal
By Waste Type
- Municipal Waste
- Medical Waste
- Industrial Waste
- E-waste
By Geography
- North America
- Europe
- Germany
- France
- U.K.
- Italy
- Spain
- Rest of Europe
- Asia Pacific
- China
- Japan
- India
- South Korea
- South-east Asia
- Rest of Asia Pacific
- Latin America
- Brazil
- Argentina
- Rest of Latin America
- Middle East & Africa
- GCC Countries
- South Africa
- Rest of the Middle East and Africa
Competitive Landscape
The competitive landscape of the waste management market is shaped by leading companies such as Republic Services, Clean Harbors, Inc., SIAAP, Biffa, Reworld Holding Corporation, Waste Connections, Veolia, Valicor, WM Intellectual Property Holdings, L.L.C., Suez, and Daiseki Co., Ltd. These players operate across collection, transportation, recycling, hazardous waste handling, and disposal services, supported by broad infrastructure networks and compliance-driven operations. Market competition grows as firms adopt automation, smart routing tools, and advanced sorting technologies to increase efficiency and material recovery rates. Strategic partnerships with municipalities and industrial clients help strengthen long-term service contracts, while investments in waste-to-energy plants and high-quality recycling facilities support new revenue streams. Companies also expand environmental services such as hazardous waste treatment and industrial cleaning to target higher-margin sectors. Growing regulations, sustainability goals, and rising waste volumes continue to push operators toward scalable, technology-enabled, and environmentally responsible waste management solutions.
Shape Your Report to Specific Countries or Regions & Enjoy 30% Off!
Key Player Analysis
- Republic Services
- Clean Harbors, Inc.
- SIAAP
- Biffa
- Reworld Holding Corporation
- Waste Connections
- Veolia
- Valicor
- WM Intellectual Property Holdings, L.L.C.
- Suez
- Daiseki Co., Ltd.
Recent Developments
- In 2025, SIAAP and SUEZ inaugurated France’s largest biogas production unit at the Seine Aval wastewater treatment plant near Paris.
- In 2023, Suez Established a new joint venture in China to build six post-consumer plastic collection and sorting centers.
- In 2023, Republic Services Launched its first Polymer Center in Las Vegas, a plastic processing facility to enhance its recycling capabilities.
Report Coverage
The research report offers an in-depth analysis based on Service Type, Waste Type and Geography. It details leading market players, providing an overview of their business, product offerings, investments, revenue streams, and key applications. Additionally, the report includes insights into the competitive environment, SWOT analysis, current market trends, as well as the primary drivers and constraints. Furthermore, it discusses various factors that have driven market expansion in recent years. The report also explores market dynamics, regulatory scenarios, and technological advancements that are shaping the industry. It assesses the impact of external factors and global economic changes on market growth. Lastly, it provides strategic recommendations for new entrants and established companies to navigate the complexities of the market.
Future Outlook
- Global waste volumes will rise due to urban growth and higher consumption rates.
- Recycling infrastructure will expand as governments push circular economy targets.
- Waste-to-energy projects will scale as regions seek alternatives to landfills.
- Digital tools and automation will improve fleet efficiency and sorting accuracy.
- E-waste processing capacity will grow with higher device turnover and stricter rules.
- Hazardous and biomedical waste services will strengthen as healthcare activity increases.
- Private operators will gain more contracts as cities outsource complex waste functions.
- Extended producer responsibility programs will drive higher recovery of plastics and packaging.
- Advanced plastic recycling technologies will gain adoption for high-quality secondary materials.
- Public awareness of segregation and sustainability will improve overall waste handling efficiency.


