
Market Overview
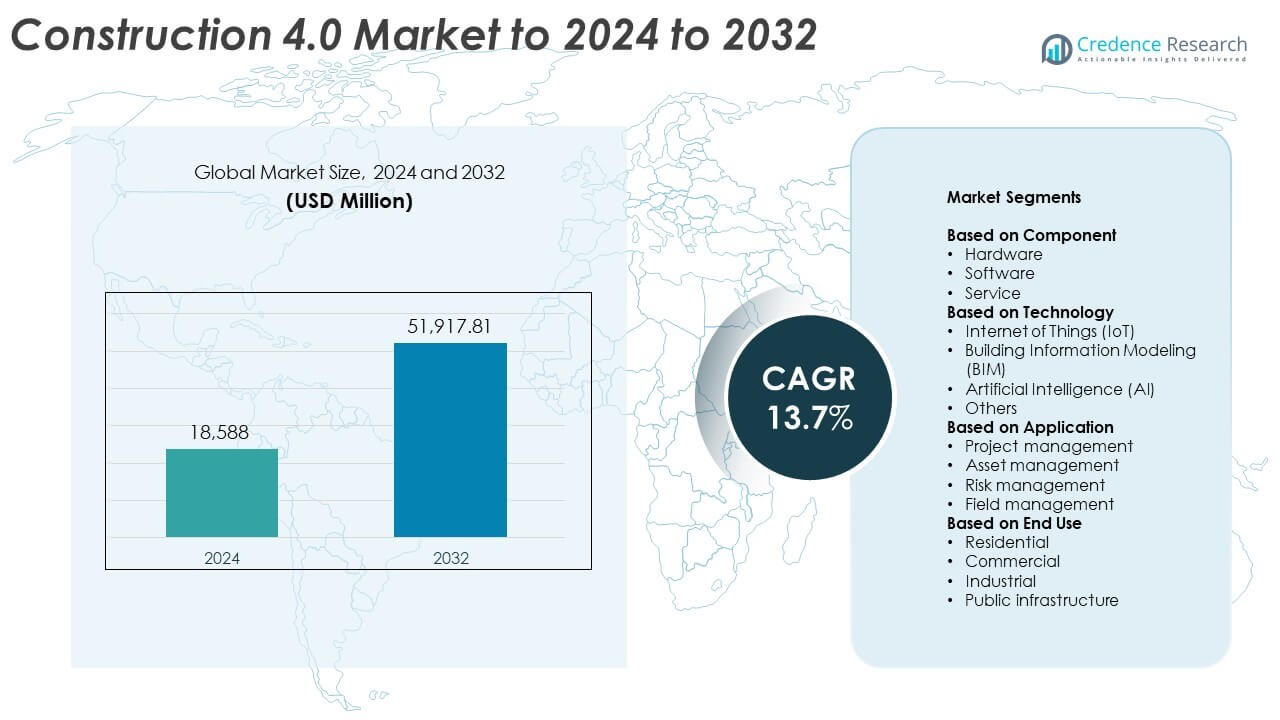
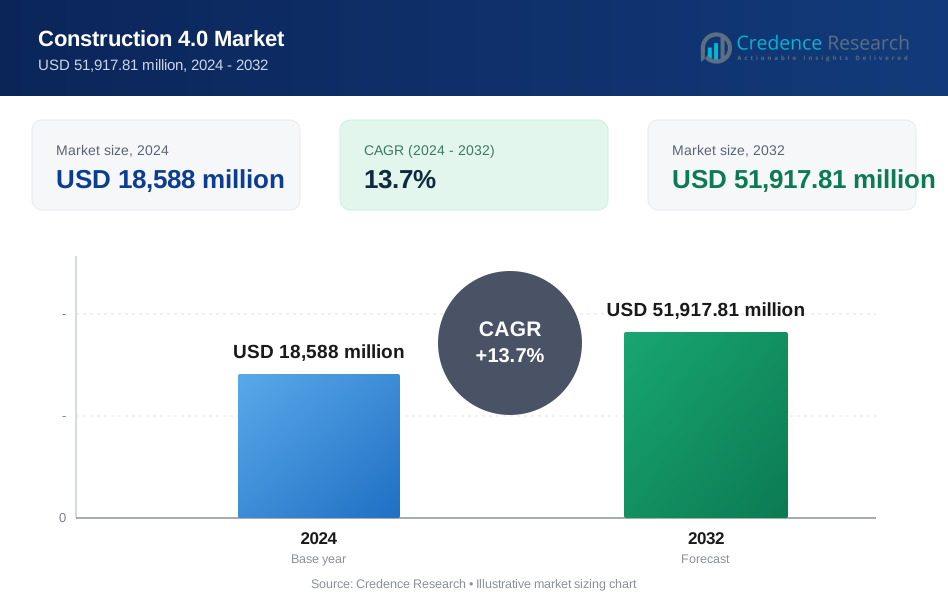
Construction 4.0 market size was valued at USD 18,588 million in 2024 and is anticipated to reach USD 51,917.81 million by 2032, at a CAGR of 13.7% during the forecast period.
| REPORT ATTRIBUTE | DETAILS |
|---|---|
| Historical Period | 2020-2023 |
| Base Year | 2024 |
| Forecast Period | 2025-2032 |
| Chiral Chromatography Columns Market Size 2024 | USD 18,588 Million |
| Chiral Chromatography Columns Market, CAGR | 13.7% |
| Chiral Chromatography Columns Market Size 2032 | USD 51,917.81 Million |
The Construction 4.0 market is shaped by leading players that offer advanced BIM platforms, IoT systems, cloud collaboration tools, robotics, and AI-driven analytics to support digital transformation across global projects. These companies focus on improving real-time monitoring, reducing delays, and enhancing cost control through integrated software and connected on-site hardware. North America emerged as the leading region in 2024 with a 34% share due to strong adoption of digital construction tools, large infrastructure investments, and wider use of automated machinery. Europe and Asia Pacific followed, supported by growing demand for smart project execution and modernization initiatives.
Market Insights
- The construction 4.0 market reached USD 18,588 million in 2024 and is projected to hit USD 51,917.81 million by 2032, growing at a CAGR of 13.7%. • Strong demand for BIM adoption acts as a major driver as project management held a 41% share in 2024 with rising use of digital planning tools. • Robotics, IoT sensors, and AI-driven analytics shape key trends as firms adopt automation to reduce delays and improve site productivity. • Competition intensifies as global technology vendors expand integrated platforms that combine software, connected hardware, and predictive analytics to support digital execution. • North America led the market with a 34% share in 2024, followed by Europe at 29% and Asia Pacific at 27%, while hardware dominated the component segment with a 48% share.
Market Segmentation Analysis:
By Component
Hardware led the component segment in 2024 with about 48% share due to rising deployment of smart sensors, drones, RFID systems, and ruggedized on-site devices that support real-time data capture. Construction firms preferred hardware tools because they improve visibility, reduce manual errors, and support faster decision-making in complex project environments. Growth accelerated as contractors adopted automated equipment, digital surveying tools, and robotics to enhance productivity. Software and service segments grew steadily as firms expanded cloud platforms and analytics support, yet hardware stayed ahead because construction sites rely heavily on connected physical systems to enable Construction 4.0 adoption.
- For instance, Topcon’s NET-G5 GNSS receiver supports 452 satellite tracking channels for high-precision construction surveying hardware, enabling reliable 3D positioning on complex job sites.
By Technology
Building Information Modeling emerged as the dominant technology in 2024 with nearly 42% share, driven by its strong role in 3D planning, clash detection, and lifecycle visualization across large commercial and infrastructure projects. BIM improved accuracy and minimized cost overruns, which encouraged broad integration by contractors and developers. IoT gained momentum as companies deployed connected devices for monitoring equipment, worker safety, and materials. Artificial Intelligence advanced through predictive analytics and automated scheduling, but BIM remained the leader because design coordination and project simulation form the core of digital transformation in construction workflows.
- For instance, Bentley Systems estimates that engineering users create at least 100 million new unique digital components every month inside ProjectWise, feeding BIM and digital twin workflows across infrastructure projects.
By Application
Project management held the largest share in 2024 with around 41%, supported by high demand for digital tools that improve planning, scheduling, resource control, and real-time progress tracking. Construction companies adopted advanced dashboards and automated reporting to reduce delays and enhance collaboration among teams. Asset management grew as firms used IoT tracking for machinery and materials, while risk management expanded through AI-based safety analytics. Field management also gained traction due to mobile platforms for on-site inspections. Still, project management stayed dominant because efficient execution and transparency remain top priorities in Construction 4.0 adoption.
Key Growth Drivers
Rising adoption of digital project execution
Digital tools gained strong traction as construction firms shifted toward data-driven workflows that enhance accuracy and reduce delays. Advanced platforms supported real-time progress tracking, automated scheduling, and better collaboration between teams. Companies used connected hardware and cloud systems to cut rework and improve accountability. This shift strengthened decision-making and helped contractors manage complex sites with fewer manual steps. The rise of digital execution became a key growth driver as firms sought higher efficiency and stronger control over large infrastructure projects.
- For instance, Oracle Primavera P6 is cited as being used on more than 1 million projects globally, helping planners manage thousands of activities and complex project schedules.
Expansion of IoT-enabled monitoring
IoT devices improved site safety, equipment visibility, and operational control through continuous data reporting. Contractors deployed sensors across machinery and structures to detect faults early and reduce downtime. These systems helped manage energy use, machine performance, and workforce safety with greater precision. Real-time analytics supported faster response to risk conditions, which encouraged broader integration across medium and large firms. This expansion of connected monitoring acted as a key growth driver because it reduced operating costs and supported predictive maintenance.
- For instance, Caterpillar states that it has more than 1.4 million connected assets sending telematics data from machines and engines, supporting remote monitoring and maintenance decisions.
Growing use of BIM for lifecycle planning
BIM adoption rose as companies relied on 3D modeling to plan, simulate, and coordinate complex designs. The technology improved clash detection and reduced material waste, which supported stronger cost control. Developers gained better visibility across the full project lifecycle, from initial design to maintenance. BIM platforms also strengthened communication among architects, engineers, and contractors. This wider use of modeling became a key growth driver because it reduced uncertainty and improved execution quality in commercial and infrastructure development.
Key Trends & Opportunities
Integration of AI-driven predictive analytics
AI tools created new opportunities by helping contractors forecast delays, cost overruns, and safety issues with greater accuracy. Predictive models used historical and real-time data to optimize schedules, allocate labor, and identify productivity gaps. These capabilities improved planning outcomes and supported proactive decision-making across diverse sites. AI adoption emerged as a key trend and opportunity because it raised efficiency and reduced manual analysis, enabling firms to compete more effectively in digital-first construction environments.
- For instance, Hexagon gathered input from more than 1,000 technology leaders, including nearly 300 executives, in a construction autonomy study that examined how data and automation improve project outcomes.
Growth of robotics and automated machinery
Robotics accelerated automation across repetitive and high-risk tasks such as bricklaying, surveying, and material handling. Automated systems improved safety, reduced human fatigue, and enabled faster project cycles. Companies explored opportunities to integrate drones, robotic arms, and autonomous equipment across large sites. This growth created a key trend and opportunity for contractors seeking productivity gains. Wider use of robotics also addressed labor shortages and supported higher consistency in quality across large-scale developments.
- For instance, Built Robotics reports over 30,000 hours of safe autonomous operation and more than 100 miles of trench excavated by its robots on energy and infrastructure projects.
Expansion of modular and off-site construction
Off-site fabrication gained momentum as firms pursued faster completion timelines and improved quality control. Digital design tools linked production lines with on-site assembly, creating a more streamlined workflow. Modular methods reduced waste, minimized weather delays, and enabled predictable outcomes. This shift became a key trend and opportunity as developers sought scalable solutions for housing shortages and infrastructure growth. The approach aligned well with Construction 4.0 technologies, boosting adoption across global markets.
Key Challenges
High upfront investment requirements
Digital transformation required substantial capital for hardware, software, training, and integration. Many small and mid-size firms found the entry cost hard to justify, especially when margins were tight. Implementation also demanded skilled staff to manage data systems and connected equipment. These financial and operational barriers slowed adoption in regions with limited technological readiness. High upfront investment emerged as a key challenge because it widened the gap between early adopters and firms with restricted budgets.
Skills gap and limited workforce readiness
Construction companies faced difficulty finding workers with strong digital, analytical, and technical skills. Many teams were familiar with traditional methods but lacked training in IoT systems, BIM tools, and AI platforms. This gap slowed integration efforts and increased reliance on external specialists. Firms needed structured training programs to build digital capability across field and management roles. Limited workforce readiness became a key challenge because it restricted the pace of Construction 4.0 execution across project environments.
Regional Analysis
North America
North America held the largest share in 2024 with about 34%. The region saw strong adoption of IoT devices, BIM platforms, and AI-based analytics across major construction firms. Government-backed infrastructure upgrades in the United States and Canada accelerated the shift toward digital workflows and automated on-site machinery. Contractors invested in robotics and 3D modeling to reduce delays and strengthen compliance with evolving building standards. Technology providers expanded cloud-based tools that improved collaboration among project teams. Rising demand for real-time monitoring and predictive maintenance supported steady growth throughout the region.
Europe
Europe accounted for nearly 29% share in 2024, driven by strict regulatory frameworks, energy-efficient construction goals, and strong modernization efforts across commercial and residential sectors. Countries such as Germany, the United Kingdom, and France advanced digital adoption through BIM mandates and large-scale public infrastructure programs. Companies relied on connected equipment and advanced simulation tools to improve project accuracy and reduce lifecycle costs. The region also saw higher use of automated machinery in industrial and transportation projects. Sustainability-driven retrofitting supported wider acceptance of Construction 4.0 technologies.
Asia Pacific
Asia Pacific captured about 27% share in 2024 and emerged as the fastest-growing region due to rapid urbanization, smart city development, and expanding industrial construction. China, India, Japan, and South Korea invested heavily in digital tools that enhanced productivity across mega infrastructure projects. Local firms adopted IoT-enabled equipment tracking, digital twins, and integrated project management systems. Growing labor shortages encouraged higher reliance on automation and robotics. Government-backed digital standards and construction technology partnerships further accelerated the shift toward connected and data-driven construction methods across the region.
Latin America
Latin America held roughly 6% share in 2024, supported by steady adoption of BIM and IoT systems in commercial buildings and public infrastructure. Countries such as Brazil, Mexico, and Chile advanced digital integration to reduce project delays and improve cost efficiency. Construction companies adopted cloud-based scheduling tools and mobile platforms to enhance field visibility. Despite economic constraints, interest in automation and digital safety tools continued to rise. Investments in industrial and energy projects helped expand opportunities for Construction 4.0 adoption across the region.
Middle East & Africa
Middle East and Africa accounted for about 4% share in 2024, driven by large-scale infrastructure, tourism, and urban development programs in the Gulf region. Countries such as the UAE and Saudi Arabia integrated BIM and connected machinery to support high-value construction projects. Digital twins and smart-site monitoring gained traction in new city developments and industrial zones. Africa saw gradual progress as firms adopted basic digital project tools to improve transparency. Although adoption remained uneven, rising interest in automation and modernization supported long-term growth potential for Construction 4.0 technologies.
Market Segmentations:
By Component
- Hardware
- Software
- Service
By Technology
- Internet of Things (IoT)
- Building Information Modeling (BIM)
- Artificial Intelligence (AI)
- Others
By Application
- Project management
- Asset management
- Risk management
- Field management
By End Use
- Residential
- Commercial
- Industrial
- Public infrastructure
By Geography
- North America
- U.S.
- Canada
- Mexico
- Europe
- Germany
- France
- U.K.
- Italy
- Spain
- Rest of Europe
- Asia Pacific
- China
- Japan
- India
- South Korea
- South-east Asia
- Rest of Asia Pacific
- Latin America
- Brazil
- Argentina
- Rest of Latin America
- Middle East & Africa
- GCC Countries
- South Africa
- Rest of the Middle East and Africa
Competitive Landscape
The Construction 4.0 market features strong competition from major technology and engineering innovators such as Hexagon AB, ABB Ltd., SAP SE, Hilti Corporation, Oracle Corporation, Trimble, Inc., NVIDIA Corporation, Autodesk Inc., Schneider Electric, Microsoft Corporation, Bentley Systems, IBM Corporation, and Topcon Corporation. Companies compete by expanding digital ecosystems that integrate cloud platforms, connected hardware, and advanced analytics. Vendors focus on delivering real-time monitoring, automated workflows, and AI-driven insights to improve project accuracy and reduce operational delays. Partnerships with construction firms and government bodies strengthen adoption across large infrastructure and commercial projects. Providers enhance market presence by improving interoperability between software and on-site equipment. Continuous investment in robotics, digital twins, IoT networks, and BIM-related innovations helps firms address rising demand for automation and predictive capabilities. Companies also expand training and support systems to accelerate digital transformation across global construction environments.
Key Player Analysis
- Hexagon AB
- ABB Ltd.
- SAP SE
- Hilti Corporation
- Oracle Corporation
- Trimble, Inc.
- NVIDIA Corporation
- Autodesk Inc.
- Schneider Electric
- Microsoft Corporation
- Bentley Systems
- IBM Corporation
- Topcon Corporation
Recent Developments
- In 2025, Hexagon AB showcased its latest construction technology solutions at bauma 2025, highlighting products that improve machine control, safety, surveying, reality capture, and construction insights with AI and automation integration.
- In 2025, Bentley expanded its iTwin platform capabilities to support greater interoperability and AI-driven analytics, facilitating improved project delivery and sustainability practices for infrastructure and building projects.
- In 2023, Trimble expanded its Trimble Construction One platform with new connected workflows and integrated with Hilti ON!Track for unified tool and equipment trackingmble Offered multiple connected workflows within its Trimble Construction One platform and integrated with the Hilti ON! Track Asset Management System for unified tool and equipment tracking.
Report Coverage
The research report offers an in-depth analysis based on Component, Technology, Application, End-Use and Geography. It details leading market players, providing an overview of their business, product offerings, investments, revenue streams, and key applications. Additionally, the report includes insights into the competitive environment, SWOT analysis, current market trends, as well as the primary drivers and constraints. Furthermore, it discusses various factors that have driven market expansion in recent years. The report also explores market dynamics, regulatory scenarios, and technological advancements that are shaping the industry. It assesses the impact of external factors and global economic changes on market growth. Lastly, it provides strategic recommendations for new entrants and established companies to navigate the complexities of the market.
Future Outlook
- Adoption of BIM, IoT, and AI will rise as firms pursue fully connected project environments.
- Robotics and automated machinery will gain wider use to reduce labor shortages and boost productivity.
- Digital twins will become standard for lifecycle planning and asset monitoring across major projects.
- Cloud-based collaboration platforms will expand as teams rely more on real-time data sharing.
- Predictive analytics will guide scheduling, safety planning, and cost control with higher accuracy.
- Modular and off-site construction will grow due to faster timelines and improved quality outcomes.
- Smart safety systems will advance through sensor-based monitoring and AI-driven risk detection.
- Energy-efficient and sustainable construction technologies will integrate more deeply with digital tools.
- Emerging markets will accelerate adoption as governments promote modernization and smart infrastructure.
- Training programs will expand to build a digitally skilled workforce for Construction 4.0 adoption.
Request a Free Sample
Fill in your details and we'll send you a free sample report.
- Sample data tables & charts
- Research methodology
Need a Custom Version of This Report?
Tailor the scope, geography, or segments to your exact requirements.
- Custom geography or segment scope
- Direct access to our analyst team
Frequently Asked Questions
What is the current market size for Construction 4.0 market, and what is its projected size in 2032?
At what Compound Annual Growth Rate is the Construction 4.0 market projected to grow between 2025 and 2032?
Which Construction 4.0 market segment held the largest share in 2024?
What are the primary factors fueling the growth of the Construction 4.0 market?
Who are the leading companies in the Construction 4.0 market?
Which region commanded the largest share of the Construction 4.0 market in 2024?
Table of Content
Chapter 1. Report Introduction
- 1.1 Report Description & Purpose
- 1.1.1 Report Title & Market Definition
- 1.1.2 Unique Selling Propositions (USP) & Key Differentiators
- 1.1.3 Value Proposition for Stakeholders
- 1.2 Research Objectives
- 1.2.1 Market Sizing Objectives (Volume & Revenue) (Volume Where Applicable)
- 1.2.2 Segmentation Objectives
- 1.2.3 Competitive Intelligence Objectives
- 1.2.4 Forecast & Scenario Objectives
- 1.3 Report Scope
- 1.3.1 Construction 4.0 Scope – Segments & Subsegments Covered
- 1.3.2 Geographic Scope – Regions & Countries Covered
- 1.3.3 Historical Period, Base Year & Forecast Period (2024; forecast to 2032)
- 1.3.4 Inclusions & Exclusions
- 1.4 Industry Classification & Applicable Codes
- 1.5 Currency, Measurement Units & Valuation Basis
- 1.6 Target Stakeholders
- 1.7 Limitations & Assumptions
Chapter 2. Executive Summary
- 2.1 Global Construction 4.0 Market Snapshot
- 2.1.1 Market Size – Historical (2024) & Forecast (2024-2032) (2024: USD 18,588 million → 2032: USD 51,917.81 million)
- 2.1.2 Volume & Revenue – Global Totals (Volume Where Applicable)
- 2.1.3 Key Market Highlights – Top Five Facts
- 2.2 Construction 4.0 Market Segmentation Snapshot
- 2.2.1 Market Split by Region – 2024 vs. 2032
- 2.3 Competitive Snapshot
- 2.3.1 Top 10 Players by Revenue Share – 2024
- 2.3.2 Top 10 Players by Volume Share – 2024 (Volume Where Applicable)
- 2.3.3 Recent Strategic Developments (18-Month Summary)
- 2.4 Key Investment Highlights & Strategic Conclusions
Chapter 3. Construction 4.0 Market Dynamics & Industry Analysis
- 3.1 Market Overview & Context
- 3.1.1 Construction 4.0 Market Position in the Broader Industry Value Chain
- 3.1.2 Demand Structure & Purchasing Dynamics
- 3.1.3 Market Maturity & Development Stage by Region
- 3.2 Construction 4.0 Market Drivers
- 3.3 Construction 4.0 Market Restraints & Challenges
- 3.4 Construction 4.0 Market Opportunities
- 3.5 Porter's Five Forces Analysis
- 3.5.1 Threat of New Entrants
- 3.5.2 Bargaining Power of Suppliers
- 3.5.3 Bargaining Power of Buyers
- 3.5.4 Threat of Substitutes
- 3.5.5 Competitive Rivalry – Intensity Assessment
- 3.6 Construction 4.0 Value Chain Analysis
- 3.6.1 Upstream – Key Inputs, Resources & Suppliers
- 3.6.1.1 Key Input/Resource 1
- 3.6.1.2 Key Input/Resource 2
- 3.6.1.3 Key Input/Resource 3
- 3.6.2 Midstream – Core Operations & Value Creation
- 3.6.2.1 Operating Model & Process Overview
- 3.6.2.2 Key Operating Locations & Capabilities by Company
- 3.6.3 Downstream – Market Channels & End Users
- 3.6.3.1 Direct Sales & Customer Engagement Channels
- 3.6.3.2 Indirect Sales, Intermediaries & Partner Channels
- 3.6.4 Value Chain Profitability Analysis
- 3.6.1 Upstream – Key Inputs, Resources & Suppliers
- 3.7 PESTEL Analysis
- 3.7.1 Political Factors
- 3.7.2 Economic Factors
- 3.7.3 Social Factors
- 3.7.4 Technological Factors
- 3.7.5 Environmental Factors
- 3.7.6 Legal Factors
- 3.8 Construction 4.0 Supply Chain Analysis
- 3.8.1 Critical Input & Resource Availability Risk Assessment
- 3.8.2 Supplier & Operational Concentration Risk (Geographic Exposure)
- 3.8.3 Supply & Service Disruption Impact Analysis
- 3.9 Regulatory & Policy Landscape
Note: The regulatory and policy landscape section covers regulations based on their applicability to the market, Construction 4.0 category, geography, and scope of the study. Only regulatory frameworks with a material impact on operations, compliance, trade, sustainability, or market access are analyzed in detail.
Chapter 4. Key Investment Pockets & Opportunity Analysis
- 4.1 Construction 4.0 Market Attractiveness Analysis
- 4.1.1 By Region – Investment Attractiveness Matrix (Market Size × CAGR)
- 4.2 Absolute Revenue Growth Opportunity
- 4.2.1 By Region – Absolute Revenue Growth Through 2032
- 4.3 Incremental Demand Opportunity
- 4.3.1 By Region – Incremental Demand Through 2032
- 4.3.2 Segment – Incremental Demand
- 4.4 Emerging Submarket Opportunity Deep Dive (Subject to Applicability)
- 4.5 Priority Market Opportunity Scorecards
- 4.5.1 United States
- 4.5.2 Europe
- 4.5.3 Asia
- 4.5.4 Middle East & Africa
Note: Priority market opportunity scorecards reflect the geographic scope and strategic relevance of the study. Listed markets are indicative and may be adapted to the industry.
Chapter 5. Construction 4.0 Cross-Border Trade & Market Access Analysis
- 5.1 International Trade & Cross-Border Activity Overview
- 5.1.1 Global Export Value by Country (2024)
- 5.1.2 Global Export Volume by Country (2024) (Volume Where Applicable)
- 5.1.3 Global Import Value by Country (2024)
- 5.1.4 Global Import Volume by Country (2024) (Volume Where Applicable)
- 5.1.5 Net Trade Balance by Country (2024)
- 5.2 Export Analysis – Segment
- 5.2.1 Category 1 (Applicable Classification Code)
- 5.2.2 Category 2 (Applicable Classification Code)
- 5.2.3 Category 3 (Applicable Classification Code)
- 5.2.4 Category 4 (Applicable Classification Code)
- 5.2.5 Category 5 (Applicable Classification Code)
- 5.3 Import Analysis – Segment
- 5.3.1 Category 1 (Applicable Classification Code)
- 5.3.2 Category 2 (Applicable Classification Code)
- 5.3.3 Category 3 (Applicable Classification Code)
- 5.3.4 Category 4 (Applicable Classification Code)
- 5.3.5 Category 5 (Applicable Classification Code)
- 5.4 Cross-Border Pricing & Transaction Benchmarks
- 5.4.1 Export Pricing – Segment & Country
- 5.4.2 Import Pricing – Segment & Source Country
- 5.4.3 Price Trends (2024)
- 5.5 Key Cross-Border Trade & Delivery Routes
- 5.5.1 Cross-Border Trade/Delivery Route 1
- 5.5.2 Cross-Border Trade/Delivery Route 2
- 5.5.3 Cross-Border Trade/Delivery Route 3
- 5.5.4 Cross-Border Trade/Delivery Route 4
- 5.5.5 Cross-Border Trade/Delivery Route 5
- 5.6 Trade Policy & Market Access Impact Assessment
- 5.6.1 Tariff & Non-Tariff Barriers
- 5.6.2 Regional Trade & Economic Integration Frameworks
- 5.6.3 Bilateral & Multilateral Trade Agreements
- 5.6.4 Cross-Border Operating, Licensing & Localization Requirements
Note: This chapter applies where cross-border trade or delivery is relevant to Construction 4.0. Goods, services, and digital offerings are assessed using applicable classifications and transaction measures. Import-export volumes, trade balances, and route analyses are included only where meaningful to the market.
Chapter 6. Competitive Landscape & Company Benchmarking
- 6.1 Construction 4.0 Market Concentration & Structure
- 6.1.1 Herfindahl-Hirschman Index (HHI) – vs. 2024
- 6.1.2 Leading, Mid-Sized & Emerging Player Structure
- 6.1.3 Global, Regional & Local Player Dynamics
- 6.2 Construction 4.0 Market Share Analysis – 2024
- 6.2.1 Global Revenue Share by Company
- 6.2.2 Global Volume Share by Company (Volume Where Applicable)
- 6.2.3 Regional Revenue Share
- 6.2.4 Market Share Evolution ( vs. 2024)
- 6.2.5 Company Market Share by Key Segment
- 6.2.6 Company Market Share by Customer Group
- 6.3 Operating Scale, Capacity & Infrastructure Analysis
- 6.3.1 Global Operating Scale & Supply Capacity
- 6.3.2 Resource Utilization & Operating Efficiency
- 6.3.3 Output, Service Delivery & Activity Metrics
- 6.3.4 Operating Footprint & Infrastructure Map
- 6.3.5 Planned Operational & Capacity Expansion
- 6.4 Construction 4.0 Competitive Benchmarking Matrix
- 6.4.1 Revenue, Growth, Profitability & Operating Metric Comparison
- 6.4.2 Channel Revenue Mix
- 6.4.3 Geographic Revenue Exposure
- 6.4.4 R&D Intensity
- 6.4.5 Sustainability Maturity
- 6.5 Strategic Developments in Construction 4.0 (Last 24 Months)
- 6.5.1 Mergers, Acquisitions & Divestments
- 6.5.2 New Products, Services & Solutions in Construction 4.0
- 6.5.3 Operational & Infrastructure Expansions
- 6.5.4 Strategic Alliances, Joint Ventures & Partnerships
- 6.5.5 Distribution Expansion & Market Entry
- 6.5.6 Sustainability & ESG Initiatives
- 6.6 Competitive Strategy Mapping
- 6.6.1 Leader, Challenger, Follower & Niche Classification
- 6.6.2 Pricing Strategy Comparison
- 6.6.3 Channel Strategy Matrix
Note: Strategic developments are included based on their materiality and the availability of reliable information.
Chapter 7. Global Construction 4.0 Market – By Sales & Delivery Channel
- 7.1 Segment Overview
- 7.1.1 Volume & Revenue Split by Channel (2024 & 2032) (Volume Where Applicable)
- 7.1.2 Channel Mix Evolution (2024-2032)
Chapter 8. Regional Market Analysis – Global Overview
- 8.1 Global Regional Overview
- 8.1.1 Regional Volume Share (Volume Where Applicable)
- 8.1.2 Regional Revenue Share
- 8.1.3 Regional Volume by Region (Volume Where Applicable)
- 8.1.4 Regional Revenue by Region
- 8.1.5 Regional Forecast Through 2032
- 8.2 Cross-Regional Segment Analysis
- 8.2.1 By Sales & Delivery Channel
- 8.2.2 By Competitive Positioning & Price Tier
Chapter 9. North America Construction 4.0 Market
- 9.1 United States
- 9.2 Canada
- 9.3 Mexico
Chapter 10. Europe Construction 4.0 Market
- 10.1 Germany
- 10.2 France
- 10.3 Italy
- 10.4 United Kingdom
- 10.5 Spain
- 10.6 Poland
- 10.7 Russia
- 10.8 Netherlands
- 10.9 Belgium
- 10.10 Sweden
- 10.11 Denmark
- 10.12 Norway
- 10.13 Rest of Europe
Chapter 11. Asia Pacific Construction 4.0 Market
- 11.1 China
- 11.2 India
- 11.3 Japan
- 11.4 South Korea
- 11.5 Thailand
- 11.6 Indonesia
- 11.7 Vietnam
- 11.8 Malaysia
- 11.9 Australia
- 11.10 Rest of Asia Pacific
Chapter 12. Latin America Construction 4.0 Market
- 12.1 Brazil
- 12.2 Argentina
- 12.3 Colombia
- 12.4 Chile
- 12.5 Rest of Latin America
Chapter 13. Middle East Construction 4.0 Market
- 13.1 Saudi Arabia
- 13.2 United Arab Emirates
- 13.3 Turkey
- 13.4 Israel
- 13.5 Iran
- 13.6 Rest of the Middle East
Chapter 14. Africa Construction 4.0 Market
- 14.1 South Africa
- 14.2 Egypt
- 14.3 Nigeria
- 14.4 Morocco
- 14.5 Rest of Africa
Chapter 15. Construction 4.0 Company Profiles
- 15.1 [Company 01]
- 15.1.1 Company Overview
- 15.1.2 Key Management Personnel
- 15.1.3 Products & Services Portfolio
- 15.1.4 Financial Performance
- 15.1.5 Key Market Focus & Geographic Presence
- 15.1.6 Recent Developments & Strategic Initiatives
Note: The company profile list is preliminary and may change based on research findings, market developments, data availability, and client requirements.
Chapter 16. Appendices
- Appendix A – List of Abbreviations & Acronyms
- Appendix B – Industry Classification Code Reference – Full Series
- Appendix C – Supply, Output & Operating Capacity Data Tables
- Appendix D – End-Use & Demand Base Tables
- Appendix E – Demand, Adoption & Usage Assumptions
- Appendix F – Pricing & Revenue Metric Reference Tables
- Appendix G – Company Operations & Infrastructure Database
- Appendix H – Cross-Border Trade & Activity Data Tables (Where Applicable)
- Appendix I – Regulatory Summary Tables
- Appendix J – Primary Research Participant List (Anonymized)
- Appendix K – Primary Research Questionnaire Framework
- Appendix L – Data Sources & Bibliography
- Appendix M – Market Size Divergence & Source Comparison
Chapter 17. Research Methodology
- 17.1 Research Framework & Philosophy
- 17.2 Secondary Research – Sources, Hierarchy & Data Extraction
- 17.3 Data Modeling – Bottom-Up & Top-Down Market Sizing
- 17.4 Primary Research – Stakeholder Framework, LOI & Sample Sizes
- 17.5 Forecast Methodology – Regression, Scenario & Sensitivity Analysis
- 17.6 Quality Control – Four-Layer Validation Framework
- 17.7 Limitations & Standard Assumptions
- 17.8 Disclaimer
