
Market Overview
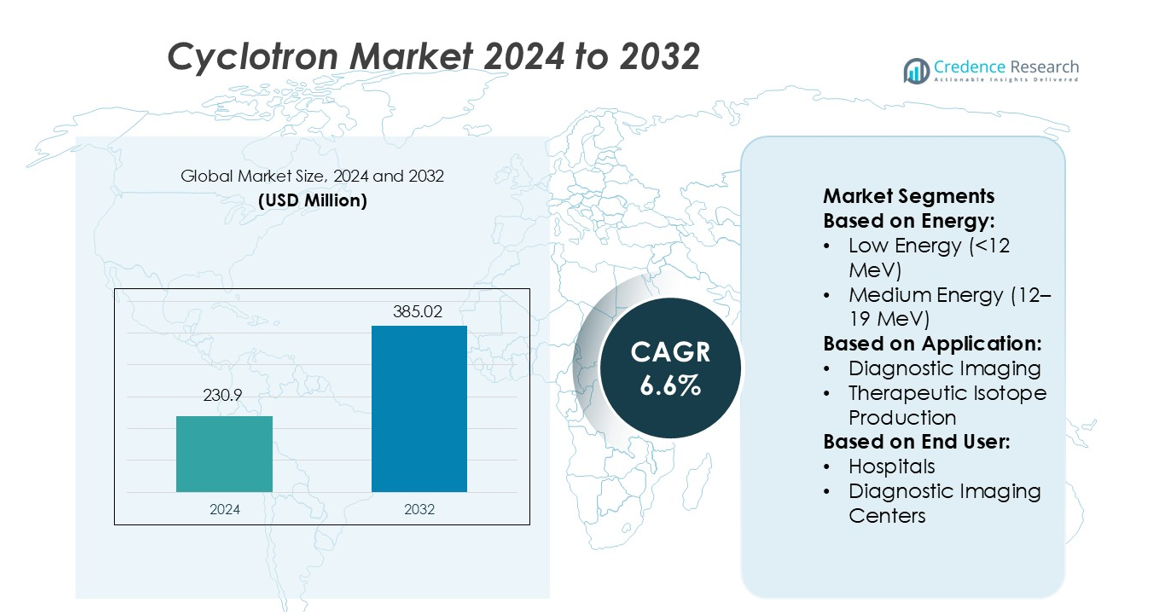
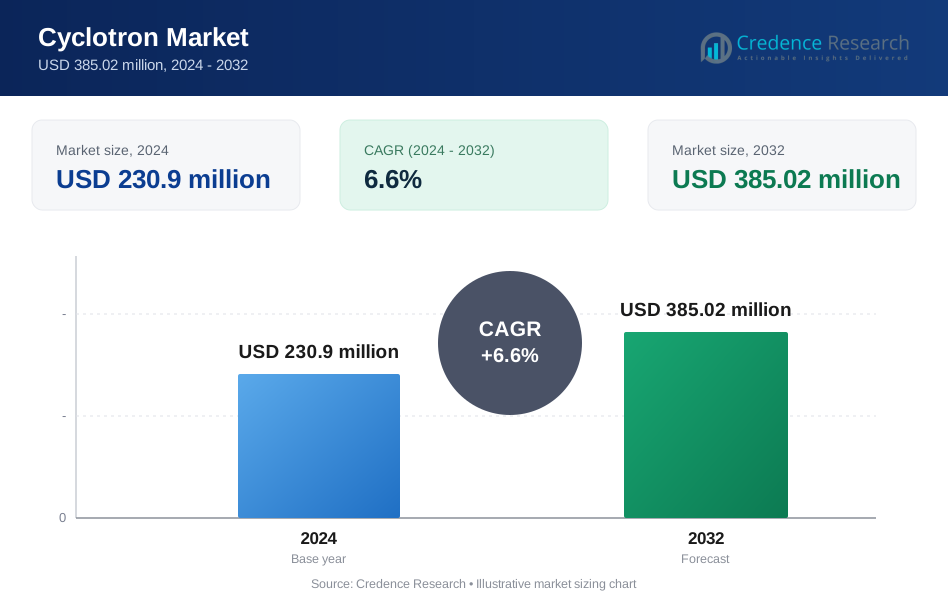
Cyclotron Market size was valued USD 230.9 million in 2024 and is anticipated to reach USD 385.02 million by 2032, at a CAGR of 6.6% during the forecast period.
| REPORT ATTRIBUTE | DETAILS |
|---|---|
| Historical Period | 2020-2023 |
| Base Year | 2024 |
| Forecast Period | 2025-2032 |
| Cyclotron Market Size 2024 | USD 230.9 million |
| Cyclotron Market, CAGR | 6.6% |
| Cyclotron Market Size 2032 | USD 385.02 million |
The cyclotron market is characterized by strong competition among leading manufacturers focused on innovation, automation, and compact system design. Top players emphasize precision engineering, energy efficiency, and enhanced isotope production capabilities to cater to the expanding needs of diagnostic and therapeutic applications. Companies are investing heavily in R&D to improve system reliability, reduce operational costs, and ensure compliance with global radiation safety standards. Strategic collaborations between medical institutions and technology providers strengthen their market positions. North America leads the global cyclotron market with a 36% share, supported by advanced healthcare infrastructure, high adoption of nuclear medicine imaging, and strong government support for isotope production initiatives.
Market Insights
- The Cyclotron Market was valued at USD 230.9 million in 2024 and is projected to reach USD 385.02 million by 2032, growing at a CAGR of 6.6%.
- Increasing demand for PET and SPECT imaging drives market growth, supported by expanding use of diagnostic and therapeutic isotopes in oncology and cardiology.
- Continuous advancements in compact and automated cyclotron designs enhance isotope yield, improve safety, and reduce operational costs, strengthening adoption across hospitals and research centers.
- High installation costs and strict radiation safety regulations act as restraints, limiting market penetration in low-income regions with limited nuclear medicine infrastructure.
- North America leads with 36% market share, followed by Europe at 29% and Asia-Pacific at 24%, while the medium-energy segment remains dominant due to its suitability for producing key medical isotopes and supporting advanced nuclear imaging applications globally.
Market Segmentation Analysis:
By Energy
The medium-energy segment (12–19 MeV) holds the dominant share in the cyclotron market. Its high adoption stems from optimal isotope yield, manageable operational costs, and compatibility with widely used radioisotopes such as fluorine-18 and carbon-11. Medium-energy cyclotrons are ideal for PET imaging centers and research institutes due to their reliability and compact size. The growing use of PET-based diagnostics in oncology and cardiology further drives installations. Manufacturers focus on integrating automation and energy-efficient designs to enhance throughput and reduce radiation exposure during isotope production.
- For instance, IBA’s Cyclone® 18/9 system delivers up to 9,000 µA beam current for efficient F-18 production while reducing shielding requirements by 30%.
By Application
Diagnostic imaging is the leading application segment in the cyclotron market, accounting for the largest market share. The demand is fueled by rising PET and SPECT imaging procedures for cancer detection, neurology, and cardiovascular diseases. Cyclotrons enable consistent production of short-lived isotopes, ensuring reliable diagnostic operations. The growing prevalence of chronic diseases and expansion of nuclear medicine departments in hospitals further support this segment’s growth. Advancements in isotope purity and production efficiency also encourage healthcare providers to adopt advanced cyclotron systems for clinical imaging.
- For instance, LG Chem’s Life Sciences division reports that their radiopharmaceutical manufacturing platform achieved a radiochemical purity of 99.8% for their FDG (fluorodeoxyglucose) batches and reduced synthesis time to 37 minutes per batch, which enabled production of 12,000 GBq of FDG in a single 8-hour run (as stated in their official company introduction).
By End User
Hospitals dominate the end-user segment due to their growing in-house isotope production capabilities and integration of PET/CT facilities. Establishing on-site cyclotron units allows hospitals to reduce dependency on third-party suppliers and ensure a continuous supply of radioisotopes for diagnostic and therapeutic purposes. Increasing investment in nuclear medicine infrastructure and government-funded programs enhance accessibility to radiopharmaceuticals. Diagnostic imaging centers also show steady growth as private healthcare facilities expand their imaging services. The trend toward cost-effective, high-performance compact cyclotrons further supports adoption across both hospital and independent diagnostic networks.
Key Growth Drivers
Rising Demand for Diagnostic Radioisotopes
Growing use of PET and SPECT imaging in oncology, neurology, and cardiology drives cyclotron installations. These machines produce key isotopes such as fluorine-18 and gallium-68 essential for early disease detection. The expansion of nuclear medicine facilities worldwide enhances the need for reliable, on-site isotope production. Additionally, the rise in chronic disease prevalence and focus on precision diagnostics push hospitals and research centers to invest in cyclotron technology to ensure consistent and high-purity isotope availability.
- For instance, Huntsman’s Araldite® EP 300 adhesive system reports a compressive strength of 11,000 psi (≈75.8 MPa) after cure at 77 °F (25 °C) for 5 days, supporting structural bonding in imaging-equipment assemblies.
Technological Advancements in Cyclotron Design
Continuous innovation in cyclotron design improves efficiency, reliability, and safety. Compact and automated cyclotrons enable faster isotope production while reducing operational complexity. Features like integrated shielding and remote control minimize radiation exposure for operators. Leading manufacturers focus on enhancing energy efficiency and output capacity to meet growing clinical demands. These innovations reduce maintenance costs, improve system uptime, and expand usability across both large hospitals and small imaging facilities, strengthening the market’s technological foundation.
- For instance, Siemens’ “Eclipse” cyclotron system delivers a maximum extracted proton current of 150 µA at 11 MeV (dual beam mode: two × 75 µA) for optimized isotope production.
Expansion of Nuclear Medicine Infrastructure
Governments and private healthcare organizations are investing heavily in nuclear medicine facilities. This expansion supports increased accessibility to radiopharmaceuticals and accelerates the adoption of cyclotron systems. Public–private partnerships encourage local isotope production and reduce import dependency. In emerging economies, favorable policies and funding initiatives promote PET/CT center development. These infrastructure upgrades not only enhance diagnostic capabilities but also establish new regional hubs for radioisotope supply, contributing to the steady growth of the cyclotron market globally.
Key Trends & Opportunities
Shift Toward Compact and Cost-Effective Cyclotrons
Manufacturers are developing compact, self-shielded cyclotrons to serve hospitals and smaller research facilities. These systems require less space and lower installation costs, making them attractive for decentralized healthcare setups. Portable cyclotrons support on-site isotope production and reduce logistical challenges associated with short-lived isotopes. This miniaturization trend opens opportunities for broader adoption in developing regions where large-scale infrastructure is limited, enabling more localized and timely access to diagnostic isotopes.
- For instance, IBA Cyclone® KEY 9.2 MeV medical cyclotron ranges from EUR 1.9 million to EUR 3.2 million (approximately USD 2.0 million to USD 3.4 million, exchange rates vary), depending on the specific configuration and options included.
Growing Research in Therapeutic Isotope Production
The expansion of theranostic applications, combining diagnosis and targeted therapy, boosts demand for cyclotrons capable of producing therapeutic isotopes like copper-67 and zirconium-89. Research organizations and pharmaceutical companies are investing in advanced cyclotron facilities to develop precision radiopharmaceuticals. This growing focus on personalized treatment approaches creates opportunities for cyclotron manufacturers to introduce systems tailored for both diagnostic and therapeutic isotope production, strengthening their role in modern nuclear medicine.
- For instance, GE HealthCare’s PETtrace 800 Series cyclotron provides proton beam options up to 160 µA (PETtrace 890 model) and offers a dual-beam mode allowing simultaneous irradiation of two targets.
Key Challenges
High Initial Investment and Maintenance Costs
The substantial capital required for cyclotron installation, facility shielding, and regulatory compliance remains a key barrier. Small hospitals and diagnostic centers often face challenges in securing funds for setup and ongoing maintenance. High energy consumption and the need for specialized operators add to operational expenses. These financial and technical constraints limit market penetration, particularly in developing countries with limited healthcare budgets or infrastructure for nuclear medicine.
Regulatory and Safety Constraints
Cyclotron operations involve strict regulatory oversight due to radiation safety concerns and isotope transport rules. Obtaining necessary licenses and approvals can delay project implementation. Variations in regional regulatory frameworks further complicate cross-border isotope supply. Inadequate operator training and non-compliance risks can result in costly penalties or operational shutdowns. Addressing these regulatory complexities is essential for ensuring sustainable growth and maintaining trust in cyclotron-based radioisotope production.
Regional Analysis
North America
North America dominates the cyclotron market with a 36% share, driven by well-established nuclear medicine infrastructure and high adoption of PET/CT imaging. The United States leads regional demand due to increasing investments in oncology diagnostics and isotope production facilities. Government support for medical radioisotope self-sufficiency further strengthens market growth. Key manufacturers and research institutes actively collaborate to enhance isotope yield and distribution efficiency. Canada also contributes significantly with public–private initiatives aimed at expanding domestic isotope production capabilities, ensuring a steady supply chain for clinical and research applications across the region.
Europe
Europe accounts for a 29% market share, supported by strong regulatory frameworks and advanced healthcare infrastructure. Countries such as Germany, the UK, and France are major contributors due to the growing use of PET-based diagnostics and cancer imaging programs. Collaborative research between medical institutes and cyclotron manufacturers enhances technology adoption. The European Commission’s initiatives to boost nuclear medicine innovation and radiopharmaceutical research also propel growth. Increasing investments in compact cyclotron installations across hospitals and research centers further strengthen the region’s focus on self-sustained isotope production and medical imaging expansion.
Asia-Pacific
Asia-Pacific holds a 24% market share, emerging as the fastest-growing region in the cyclotron market. Rapid healthcare infrastructure development and rising demand for diagnostic imaging in China, Japan, India, and South Korea drive expansion. Governments in the region support local isotope production to reduce reliance on imports. Technological advancements, combined with growing awareness of nuclear medicine’s clinical value, fuel equipment installation across both public and private sectors. Increasing partnerships between cyclotron manufacturers and healthcare providers strengthen the regional ecosystem, promoting localized production and accessibility of radioisotopes for clinical and research use.
Latin America
Latin America represents a 7% market share, with Brazil, Mexico, and Argentina driving growth through expanding nuclear medicine programs. Rising investments in healthcare modernization and regional partnerships with global cyclotron suppliers support the establishment of PET imaging centers. Government initiatives aimed at improving cancer diagnostics are promoting local isotope production. However, limited infrastructure and skilled workforce availability remain challenges. Continuous efforts by research institutes and public–private collaborations are expected to enhance accessibility and affordability, supporting gradual growth of the cyclotron market across the region’s developing healthcare landscape.
Middle East & Africa
The Middle East & Africa region accounts for a 4% market share, supported by increasing healthcare investments and the introduction of advanced diagnostic technologies. Countries such as the UAE, Saudi Arabia, and South Africa are investing in nuclear medicine facilities to strengthen cancer detection and treatment capabilities. Regional collaborations with international cyclotron manufacturers are enabling knowledge transfer and equipment deployment. Despite limited isotope production infrastructure, government-led healthcare modernization programs and rising private-sector participation are expected to accelerate market penetration, improving access to nuclear imaging services across key urban healthcare centers.
Market Segmentations:
By Energy:
- Low Energy (<12 MeV)
- Medium Energy (12–19 MeV)
By Application:
- Diagnostic Imaging
- Therapeutic Isotope Production
By End User:
- Hospitals
- Diagnostic Imaging Centers
By Geography
- North America
- U.S.
- Canada
- Mexico
- Europe
- Germany
- France
- U.K.
- Italy
- Spain
- Rest of Europe
- Asia Pacific
- China
- Japan
- India
- South Korea
- South-east Asia
- Rest of Asia Pacific
- Latin America
- Brazil
- Argentina
- Rest of Latin America
- Middle East & Africa
- GCC Countries
- South Africa
- Rest of the Middle East and Africa
Competitive Landscape
The cyclotron market features key players such as Haltermann Carless, LG Chem, Prasol Chemicals Pvt. Ltd., SK Global Chemical Co., Ltd., DYMATIC Chemicals, Inc., Merck KGaA, Huntsman Corporation, INEOS, Chevron Phillips Chemical Company LLC, and Eastman Chemical Company. The cyclotron market is defined by continuous technological advancement, strategic collaborations, and expanding global reach. Leading manufacturers focus on developing compact, energy-efficient cyclotrons to meet the growing demand for diagnostic and therapeutic radioisotopes. Companies are investing in R&D to improve isotope yield, reduce operational costs, and enhance automation for safer and faster production. Partnerships between healthcare institutions and technology providers drive innovation in isotope supply chains and system integration. Moreover, regional expansion initiatives and compliance with stringent radiation safety standards help strengthen market presence. The emphasis on sustainability, precision engineering, and long-term reliability continues to shape competition in this dynamic market.
Key Player Analysis
- Haltermann Carless
- LG Chem
- Prasol Chemicals Pvt. Ltd.
- SK Global Chemical Co., Ltd.
- DYMATIC Chemicals, Inc.
- Merck KGaA
- Huntsman Corporation
- INEOS
- Chevron Phillips Chemical Company LLC
- Eastman Chemical Company
Recent Developments
- In August 2024, INVISTA expanded its nylon 6,6 polymer facility at the Shanghai Chemical Industry Park, effectively doubling its annual output to 400,000 metric tons. The project aimed to boost local supply capacity and meet the rising demand for nylon-based products, especially in sectors that depend on cyclohexanone.
- In May 2024, Nylon Corporation of America (NYCOA) launched NY-Clear, a next-generation amorphous 6I/6T nylon developed for packaging and precision-molded uses. This transparent material delivers outstanding clarity and enhanced barrier performance, offering up to 30% greater resistance to oxygen, carbon dioxide, and water vapor transmission than alternative materials.
- In February 2023, HCS Group has launched a new low-carbon pentane product range that includes Cyclopentane, n- and iso-Pentane and their blends. This new product range is ISCC PLUS certified and has been introduced by the company for customers aiming to reduce their carbon footprint in specialty applications and industries.
Report Coverage
The research report offers an in-depth analysis based on Energy, Application, End-User and Geography. It details leading market players, providing an overview of their business, product offerings, investments, revenue streams, and key applications. Additionally, the report includes insights into the competitive environment, SWOT analysis, current market trends, as well as the primary drivers and constraints. Furthermore, it discusses various factors that have driven market expansion in recent years. The report also explores market dynamics, regulatory scenarios, and technological advancements that are shaping the industry. It assesses the impact of external factors and global economic changes on market growth. Lastly, it provides strategic recommendations for new entrants and established companies to navigate the complexities of the market.
Future Outlook
- Increasing use of PET and SPECT imaging will continue to boost cyclotron demand.
- Compact and self-shielded cyclotrons will gain traction in hospitals and research centers.
- Integration of automation and AI will enhance isotope production efficiency and safety.
- Rising investments in nuclear medicine infrastructure will support broader regional adoption.
- Demand for therapeutic isotopes will grow with advancements in targeted cancer therapies.
- Partnerships between manufacturers and healthcare providers will strengthen supply chains.
- Technological innovation will focus on reducing maintenance costs and energy consumption.
- Emerging economies will witness accelerated installation of small and mid-range cyclotrons.
- Regulatory harmonization across regions will simplify equipment approvals and exports.
- Sustainability-focused manufacturing practices will shape future cyclotron design and operations.
Request a Free Sample
Fill in your details and we'll send you a free sample report.
- Sample data tables & charts
- Research methodology
Need a Custom Version of This Report?
Tailor the scope, geography, or segments to your exact requirements.
- Custom geography or segment scope
- Direct access to our analyst team
Frequently Asked Questions
What is the current market size for the Cyclotron Market, and what is its projected size in 2032?
At what Compound Annual Growth Rate is the Cyclotron Market projected to grow between 2025 and 2032?
Which Cyclotron Market segment held the largest share in 2024?
What are the primary factors fueling the growth of the Cyclotron Market?
Who are the leading companies in the Cyclotron Market?
Table of Content
Chapter 1. Report Introduction
- 1.1 Report Description & Purpose
- 1.1.1 Report Title & Market Definition
- 1.1.2 Unique Selling Propositions (USP) & Key Differentiators
- 1.1.3 Value Proposition for Stakeholders
- 1.2 Research Objectives
- 1.2.1 Market Sizing Objectives (Volume & Revenue)
- 1.2.2 Segmentation Objectives
- 1.2.3 Competitive Intelligence Objectives
- 1.2.4 Forecast & Scenario Objectives
- 1.3 Report Scope
- 1.3.1 Cyclotron Scope – Types & Subtypes Covered
- 1.3.2 Geographic Scope – Regions & Countries Covered
- 1.3.3 Historical Period, Base Year & Forecast Period (2024; forecast to 2032)
- 1.3.4 Inclusions & Exclusions
- 1.4 HS Code & Classification Framework
- 1.5 Currency, Units & Pricing Basis
- 1.6 Target Stakeholders
- 1.7 Limitations & Assumptions
Chapter 2. Executive Summary
- 2.1 Global Cyclotron Market Snapshot
- 2.1.1 Market Size – Historical (2024) & Forecast (2024-2032) (2024: USD 230.9 million → 2032: USD 385.02 million)
- 2.1.2 Volume & Revenue – Global Totals
- 2.1.3 Key Market Highlights – Top Five Facts
- 2.2 Cyclotron Market Segmentation Snapshot
- 2.2.1 Market Split by Region – 2024 vs. 2032
- 2.3 Competitive Snapshot
- 2.3.1 Top 10 Players by Revenue Share – 2024
- 2.3.2 Top 10 Players by Volume Share – 2024
- 2.3.3 Recent Strategic Developments (18-Month Summary)
- 2.4 Key Investment Highlights & Strategic Conclusions
Chapter 3. Cyclotron Market Dynamics & Industry Analysis
- 3.1 Market Overview & Context
- 3.1.1 Cyclotron Market Position in the Broader Automotive Value Chain
- 3.1.2 OEM vs. Replacement Market Dynamics
- 3.1.3 Market Maturity & Development Stage by Region
- 3.2 Cyclotron Market Drivers
- 3.3 Cyclotron Market Restraints & Challenges
- 3.4 Cyclotron Market Opportunities
- 3.5 Porter's Five Forces Analysis
- 3.5.1 Threat of New Entrants
- 3.5.2 Bargaining Power of Suppliers
- 3.5.3 Bargaining Power of Buyers
- 3.5.4 Threat of Substitutes
- 3.5.5 Competitive Rivalry – Intensity Assessment
- 3.6 Cyclotron Value Chain Analysis
- 3.6.1 Upstream – Raw Material/Input Suppliers
- 3.6.1.1 Raw Material/Input 1
- 3.6.1.2 Raw Material/Input 2
- 3.6.1.3 Raw Material/Input 3
- 3.6.2 Midstream – Production/Manufacturing/Service Delivery
- 3.6.2.1 Production/Process Overview
- 3.6.2.2 Key Facility Locations & Capacity by Manufacturer
- 3.6.3 Downstream – Distribution & End Consumer
- 3.6.3.1 Primary Channel – B2B/OEM
- 3.6.3.2 Secondary Channels – Dealer, Retail, Online, Direct
- 3.6.4 Value Chain Profitability Analysis
- 3.6.1 Upstream – Raw Material/Input Suppliers
- 3.7 PESTEL Analysis
- 3.7.1 Political Factors
- 3.7.2 Economic Factors
- 3.7.3 Social Factors
- 3.7.4 Technological Factors
- 3.7.5 Environmental Factors
- 3.7.6 Legal Factors
- 3.8 Cyclotron Supply Chain Analysis
- 3.8.1 Raw Material/Input Supply Risk Assessment
- 3.8.2 Manufacturing Concentration Risk (Geographic Exposure)
- 3.8.3 Trade Disruption Impact Analysis
- 3.9 Regulatory & Policy Landscape
Note: The regulatory and policy landscape section covers regulations based on their applicability to the market, Cyclotron category, geography, and scope of the study. Only regulatory frameworks with a material impact on operations, compliance, trade, sustainability, or market access are analyzed in detail.
Chapter 4. Key Investment Pockets & Opportunity Analysis
- 4.1 Cyclotron Market Attractiveness Analysis
- 4.1.1 By Region – Investment Attractiveness Matrix (Volume × CAGR)
- 4.2 Absolute Revenue Growth Opportunity
- 4.2.1 By Region – Absolute USD Growth Through 2032
- 4.3 Incremental Volume Opportunity
- 4.3.1 By Region – Incremental Volume Through 2032
- 4.3.2 Segment – Incremental Volume
- 4.4 Emerging Submarket Opportunity Deep Dive (Subject to Applicability)
- 4.5 Emerging Market Opportunity Scorecards
- 4.5.1 United States
- 4.5.2 Europe
- 4.5.3 Asia
- 4.5.4 Middle East & Africa
Note: Emerging Market Opportunity Scorecards will be included based on relevance and strategic importance. Regions listed are indicative and may vary depending on data availability and market dynamics.
Chapter 5. Cyclotron Import-Export Analysis & Trade Flows
- 5.1 Global Trade Overview
- 5.1.1 Global Export Value by Country (2024)
- 5.1.2 Global Export Volume by Country (2024)
- 5.1.3 Global Import Value by Country (2024)
- 5.1.4 Global Import Volume by Country (2024)
- 5.1.5 Net Trade Balance by Country (2024)
- 5.2 Export Analysis – Segment
- 5.2.1 Type 1 (HS Code)
- 5.2.2 Type 2 (HS Code)
- 5.2.3 Type 3 (HS Code)
- 5.2.4 Type 4 (HS Code)
- 5.2.5 Type 5 (HS Code)
- 5.3 Import Analysis – Segment
- 5.3.1 Type 1 (HS Code)
- 5.3.2 Type 2 (HS Code)
- 5.3.3 Type 3 (HS Code)
- 5.3.4 Type 4 (HS Code)
- 5.3.5 Type 5 (HS Code)
- 5.4 Average Unit Trade Prices
- 5.4.1 Average Export Price – Segment & Country
- 5.4.2 Average Import Price – Segment & Source Country
- 5.4.3 Price Trends (2024)
- 5.5 Key Trade Route Analysis
- 5.5.1 Trade Route 1
- 5.5.2 Trade Route 2
- 5.5.3 Trade Route 3
- 5.5.4 Trade Route 4
- 5.5.5 Trade Route 5
- 5.6 Trade Policy Impact Assessment
- 5.6.1 US Anti-Dumping & Section 301 Tariffs
- 5.6.2 EU Customs Union Impact
- 5.6.3 Major Free Trade Agreements
- 5.6.4 USMCA Rules of Origin
Note: Trade policy analysis will be included only where relevant to the Cyclotron market.
Chapter 6. Competitive Landscape & Company Benchmarking
- 6.1 Cyclotron Market Concentration & Structure
- 6.1.1 Herfindahl-Hirschman Index (HHI) – vs. 2024
- 6.1.2 Tier 1, Tier 2 & Tier 3 Market Structure
- 6.1.3 Global, Regional & Local Player Dynamics
- 6.2 Cyclotron Market Share Analysis – 2024
- 6.2.1 Global Revenue Share by Company
- 6.2.2 Global Volume Share by Company
- 6.2.3 Regional Revenue Share
- 6.2.4 Market Share Evolution ( vs. 2024)
- 6.2.5 OEM Segment Share by Company
- 6.2.6 Replacement Segment Share by Company
- 6.3 Production/Delivery Capacity & Facility Analysis
- 6.3.1 Global Installed Capacity
- 6.3.2 Capacity Utilization Rates
- 6.3.3 Production/Output Volume
- 6.3.4 Facility Locations & Capacity Map
- 6.3.5 Planned Capacity Additions
- 6.4 Cyclotron Competitive Benchmarking Matrix
- 6.4.1 Revenue, Volume, CAGR & Profitability Comparison
- 6.4.2 Channel Revenue Mix
- 6.4.3 Geographic Revenue Exposure
- 6.4.4 R&D Intensity
- 6.4.5 Sustainability Maturity
- 6.5 Strategic Developments in Cyclotron (Last 24 Months)
- 6.5.1 Mergers, Acquisitions & Divestments
- 6.5.2 New Cyclotron Launches
- 6.5.3 Facility Expansions
- 6.5.4 Strategic Alliances, Joint Ventures & Partnerships
- 6.5.5 Distribution Expansion & Market Entry
- 6.5.6 Sustainability & ESG Initiatives
- 6.6 Competitive Strategy Mapping
- 6.6.1 Leader, Challenger, Follower & Niche Classification
- 6.6.2 Pricing Strategy Comparison
- 6.6.3 Channel Strategy Matrix
Note: Strategic developments are included based on their materiality and the availability of reliable information.
Chapter 7. Global Cyclotron Market – By Distribution Channel
- 7.1 Segment Overview
- 7.1.1 Volume & Revenue Split by Channel (2024 & 2032)
- 7.1.2 Channel Mix Evolution (2024-2032)
Chapter 8. Regional Market Analysis – Global Overview
- 8.1 Global Regional Overview
- 8.1.1 Regional Volume Share
- 8.1.2 Regional Revenue Share
- 8.1.3 Regional Volume by Region
- 8.1.4 Regional Revenue by Region
- 8.1.5 Regional Forecast Through 2032
- 8.2 Cross-Regional Segment Analysis
- 8.2.1 By Distribution Channel
- 8.2.2 By Brand/Price Tier
Chapter 9. North America Cyclotron Market
- 9.1 United States
- 9.2 Canada
- 9.3 Mexico
Chapter 10. Europe Cyclotron Market
- 10.1 Germany
- 10.2 France
- 10.3 Italy
- 10.4 United Kingdom
- 10.5 Spain
- 10.6 Poland
- 10.7 Russia
- 10.8 Netherlands
- 10.9 Belgium
- 10.10 Sweden
- 10.11 Denmark
- 10.12 Norway
- 10.13 Rest of Europe
Chapter 11. Asia Pacific Cyclotron Market
- 11.1 China
- 11.2 India
- 11.3 Japan
- 11.4 South Korea
- 11.5 Thailand
- 11.6 Indonesia
- 11.7 Vietnam
- 11.8 Malaysia
- 11.9 Australia
- 11.10 Rest of Asia Pacific
Chapter 12. Latin America Cyclotron Market
- 12.1 Brazil
- 12.2 Argentina
- 12.3 Colombia
- 12.4 Chile
- 12.5 Rest of Latin America
Chapter 13. Middle East Cyclotron Market
- 13.1 Saudi Arabia
- 13.2 United Arab Emirates
- 13.3 Turkey
- 13.4 Israel
- 13.5 Iran
- 13.6 Rest of the Middle East
Chapter 14. Africa Cyclotron Market
- 14.1 South Africa
- 14.2 Egypt
- 14.3 Nigeria
- 14.4 Morocco
- 14.5 Rest of Africa
Chapter 15. Cyclotron Company Profiles
- 15.1 [Company 01]
- 15.1.1 Company Overview
- 15.1.2 Key Management Personnel
- 15.1.3 Products & Services Portfolio
- 15.1.4 Financial Performance
- 15.1.5 Key Market Focus & Geographic Presence
- 15.1.6 Recent Developments & Strategic Initiatives
Note: The company profile list is preliminary and may change based on research findings, market developments, data availability, and client requirements.
Chapter 16. Appendices
- Appendix A – List of Abbreviations & Acronyms
- Appendix B – Industry Classification Code Reference – Full Series
- Appendix C – Production & Capacity Data Tables
- Appendix D – End-Use & Demand Base Tables
- Appendix E – Consumption & Replacement Rate Assumptions
- Appendix F – ASP Reference Tables
- Appendix G – Manufacturing & Facility Database
- Appendix H – Import-Export Data Tables
- Appendix I – Regulatory Summary Tables
- Appendix J – Primary Research Participant List (Anonymized)
- Appendix K – Primary Research Questionnaire Framework
- Appendix L – Data Sources & Bibliography
- Appendix M – Market Size Divergence & Source Comparison
Chapter 17. Research Methodology
- 17.1 Research Framework & Philosophy
- 17.2 Secondary Research – Sources, Hierarchy & Data Extraction
- 17.3 Data Modeling – Bottom-Up & Top-Down Market Sizing
- 17.4 Primary Research – Stakeholder Framework, LOI & Sample Sizes
- 17.5 Forecast Methodology – Regression, Scenario & Sensitivity Analysis
- 17.6 Quality Control – Four-Layer Validation Framework
- 17.7 Limitations & Standard Assumptions
- 17.8 Disclaimer
