Market Overview
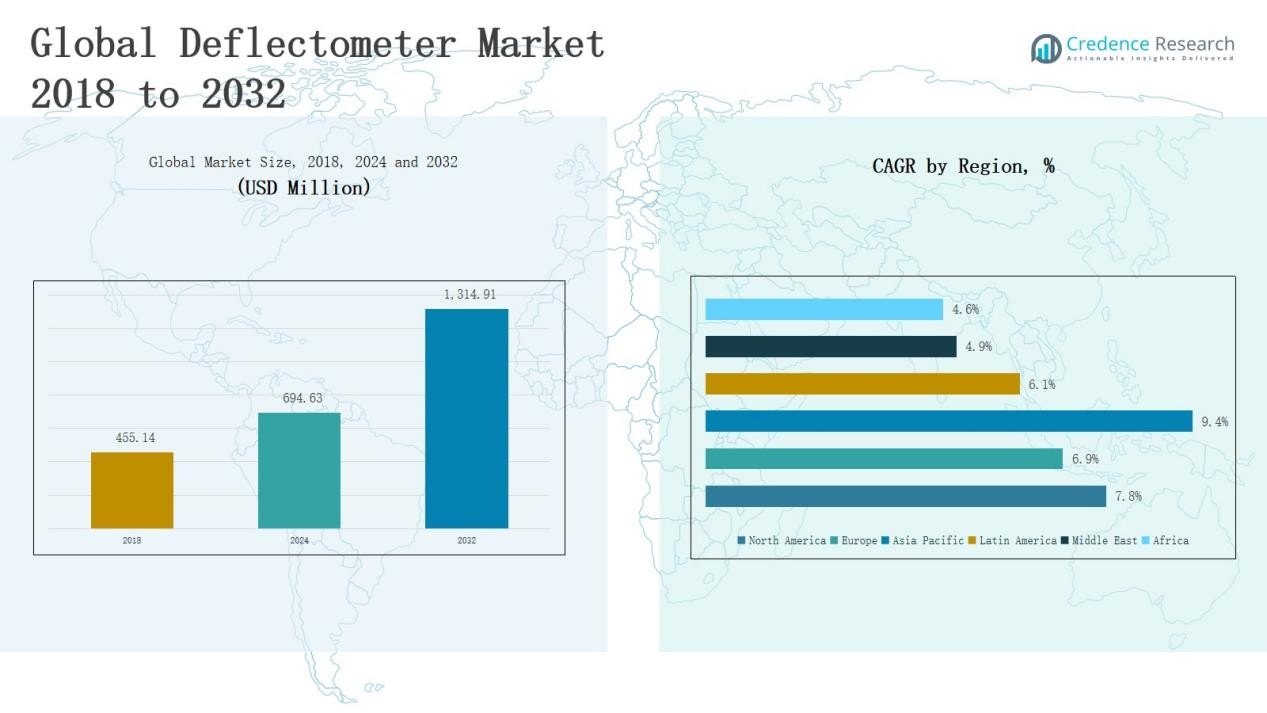
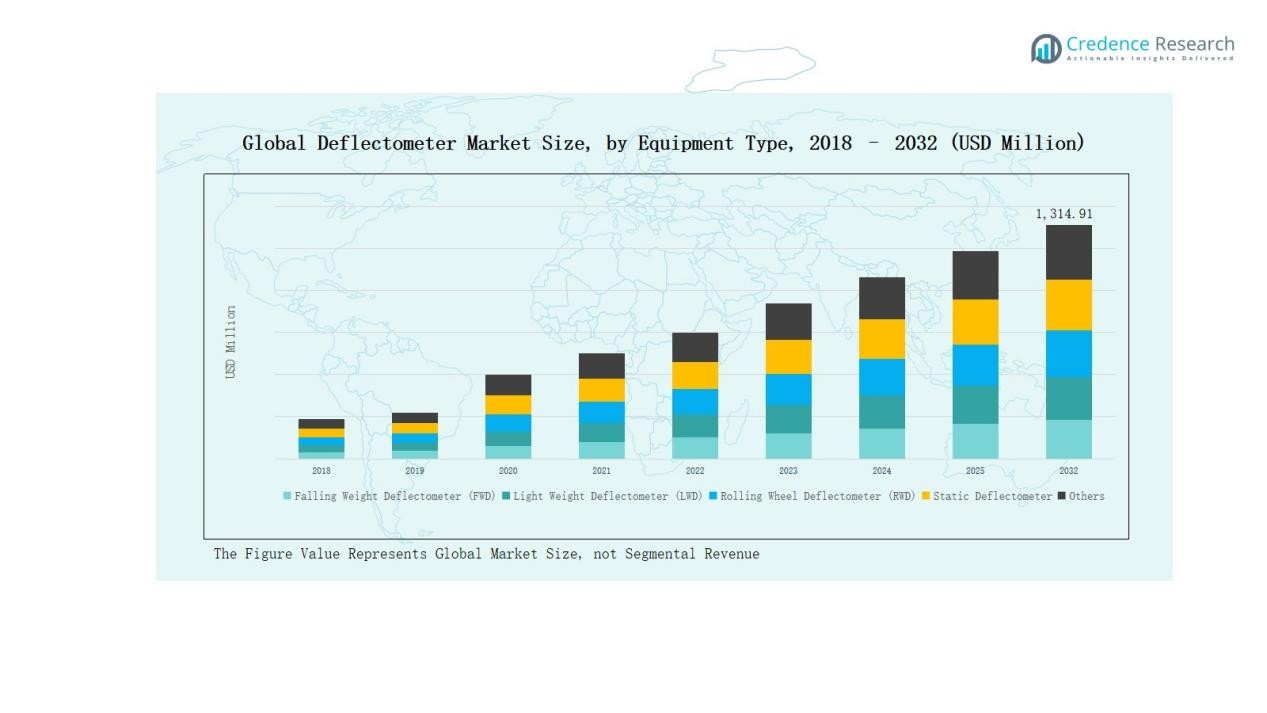
Deflectometer Market size was valued at USD 455.14 million in 2018 to USD 694.63 million in 2024 and is anticipated to reach USD 1,314.91 million by 2032, at a CAGR of 7.73% during the forecast period.
| REPORT ATTRIBUTE |
DETAILS |
| Historical Period |
2020-2024 |
| Base Year |
2024 |
| Forecast Period |
2025-2032 |
| Deflectometer Market Size 2024 |
USD 694.63 Million |
| Deflectometer Market, CAGR |
7.73% |
| Deflectometer Market Size 2032 |
USD 1,314.91 Million |
The Deflectometer Market is shaped by leading players such as Illinois Tool Works Inc., Dynatest, PaveTesting Limited, Humboldt Mfg. Co., Controls Group, Aimil Ltd., Olson Instruments, EPSILON Technology Corp, Abatech, and ARA (Applied Research Associates), along with specialized firms like Greenwood Engineering, ZORN Instruments, HMP GmbH & Co. KG, KUAB, and Cooper Research Technology. These companies compete through advanced product portfolios, digital integration, and strategic collaborations to strengthen their market positions. North America emerged as the leading region with a 37% market share in 2024, supported by strict pavement testing standards, high infrastructure spending, and strong adoption of Falling Weight and Rolling Wheel Deflectometers.
Access crucial information at unmatched prices!
Request your sample report today & start making informed decisions powered by Credence Research Inc.!
Download Sample
Market Insights
- The Deflectometer Market grew from USD 455.14 million in 2018 to USD 694.63 million in 2024, and is projected to reach USD 1,314.91 million by 2032.
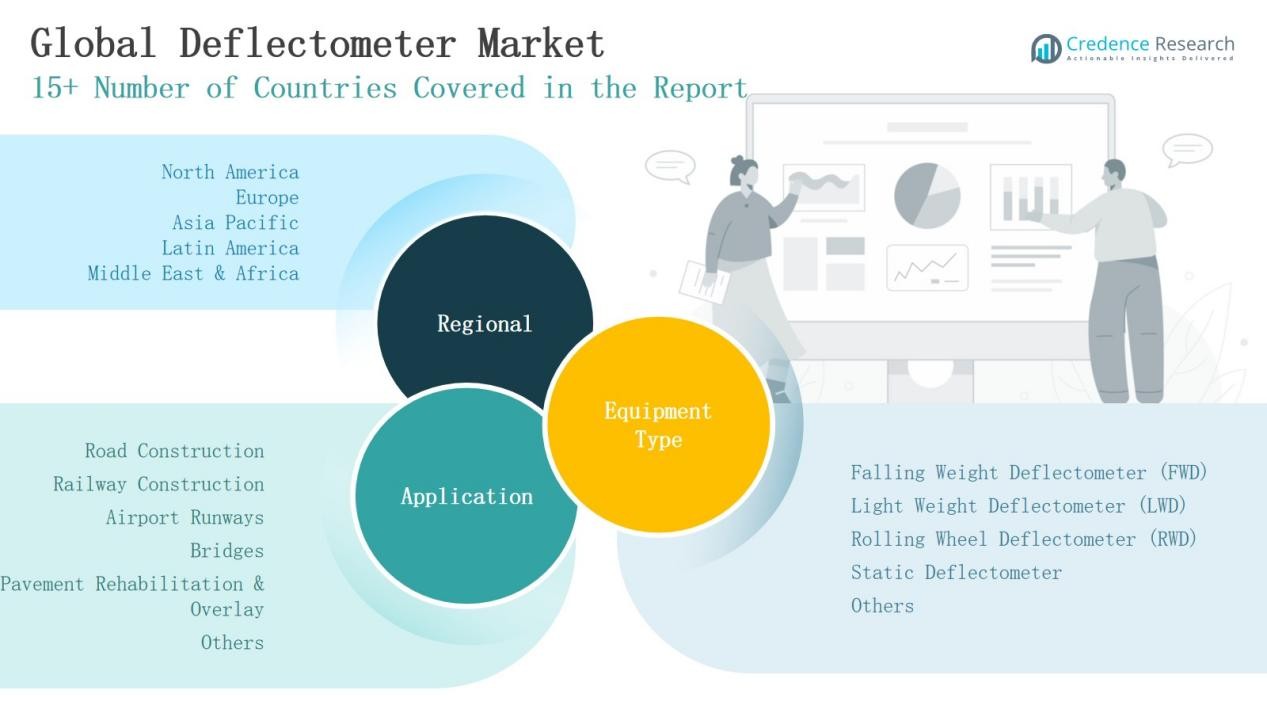
- Falling Weight Deflectometer (FWD) led with 41% share in 2024, followed by Light Weight Deflectometer (27%), Rolling Wheel Deflectometer (15%), Static Deflectometer (10%), and others (7%).
- By application, road construction dominated with 46% share in 2024, while railway construction held 18%, airport runways 12%, pavement rehabilitation 11%, bridges 9%, and others 4%.
- North America led with 37% share in 2024, followed by Europe (24%) and Asia Pacific (22%), while Latin America (4%), Middle East (2%), and Africa (1%) showed smaller shares.
- Key players include Illinois Tool Works Inc., Dynatest, PaveTesting Limited, Humboldt Mfg. Co., Controls Group, Aimil Ltd., Olson Instruments, EPSILON Technology Corp, Abatech, ARA, Greenwood Engineering, ZORN Instruments, HMP GmbH & Co. KG, KUAB, and Cooper Research Technology.
Market Segment Insights
By Equipment Type
Falling Weight Deflectometer (FWD) led the market with a 41% share in 2024, driven by its accuracy and standardization in highway evaluations. Light Weight Deflectometer (LWD) followed with 27%, supported by its portability and cost-effectiveness in urban and small-scale projects. Rolling Wheel Deflectometer (RWD) accounted for 15%, offering continuous pavement monitoring for large road networks, while Static Deflectometer held 10%, mainly in geotechnical and bridge studies. Other advanced models, including hybrid and IoT-enabled systems, captured the remaining 7%, reflecting niche adoption in research and smart infrastructure.
- For instance, Dynatest’s LWD has been utilized in municipal road projects in Germany for quick on-site compaction control, reducing testing time significantly compared to traditional plate load methods.
By Application
Road construction dominated applications with a 46% share in 2024, supported by global investments in highway expansion and rehabilitation. Railway construction contributed 18%, with demand rising from high-speed rail and metro projects in Asia Pacific. Airport runways represented 12%, driven by safety requirements and rising air traffic, while bridges held 9%, supported by static deflectometer use in structural analysis. Pavement rehabilitation and overlay projects accounted for 11%, reflecting maintenance-led infrastructure spending, and other applications such as mining and industrial pavements made up the remaining 4%.
- For instance, Delhi International Airport (DIAL) completed its fourth runway in 2023, which along with other expansion work, helped enhance the airport’s overall airside capacity.
 Key Growth Drivers
Expanding Road and Highway Infrastructure
The surge in road and highway construction is a major growth driver for the deflectometer market. Governments in emerging economies are prioritizing transportation networks, leading to significant investments in new highways and upgrades. Falling Weight Deflectometers (FWD) and Rolling Wheel Deflectometers (RWD) are widely adopted for pavement strength analysis in these projects. The rising emphasis on preventive maintenance also fuels recurring demand, as road agencies increasingly rely on deflectometers to ensure safety and extend pavement service life.
- For instance, the National Highways Authority of India (NHAI) commissioned multiple Falling Weight Deflectometer surveys in 2022 to evaluate more than 1,200 km of national highways under its performance-based maintenance program.
Rising Demand for Pavement Rehabilitation
Aging road networks in developed regions, especially North America and Europe, create consistent demand for pavement rehabilitation. Deflectometers play a crucial role in evaluating pavement condition before overlay and repair work. The shift toward cost-effective maintenance over full reconstruction amplifies the use of FWD and LWD devices. Additionally, large-scale government-funded rehabilitation programs drive stable adoption. This demand extends to urban infrastructure where increasing vehicle traffic necessitates precise pavement monitoring, further strengthening market growth across both developed and developing countries.
- For instance, Highways England employs FWD testing across its 4,300-mile strategic road network to extend pavement life without resorting to full reconstruction.
Growth in Aviation and Rail Infrastructure
Expanding investments in airport runways and rail networks also boost deflectometer demand. Aviation authorities deploy deflectometers to ensure runways withstand increasing aircraft loads. Similarly, railway construction projects in Asia Pacific and Europe integrate LWD and static deflectometers for subgrade evaluation and compaction control. The global push for high-speed rail projects in countries like China and India further accelerates adoption. The integration of advanced testing equipment ensures structural reliability and safety standards, making aviation and rail infrastructure expansion a vital growth contributor.
Key Trends & Opportunities
Integration of Smart and Digital Technologies
The market is witnessing a strong trend toward smart deflectometers equipped with IoT sensors, cloud connectivity, and automated data analysis. These technologies enable real-time pavement monitoring, predictive maintenance, and integration with digital infrastructure platforms. Governments and contractors are increasingly adopting smart systems to improve testing efficiency and reduce manual errors. This trend creates opportunities for manufacturers to differentiate products with advanced analytics and software-enabled solutions. Long-term, digital transformation positions deflectometers as integral tools in smart city and intelligent transport systems.
- For instance, Advantech offers smart IoT sensing solutions with industrial-grade sensors that support versatile monitoring and data collection for infrastructure projects, including road and pavement assessments.
Rising Adoption in Emerging Economies
Developing nations present significant opportunities for deflectometer manufacturers. Rapid urbanization, industrial growth, and government-led infrastructure programs in Asia Pacific, Latin America, and Africa are expanding the market base. Countries like India and Brazil are investing heavily in highways, airports, and bridges, driving demand for both portable and advanced testing equipment. Lower-cost Light Weight Deflectometers (LWD) are particularly gaining traction in these regions due to their affordability and ease of use. Expanding distribution networks and localized manufacturing further unlock untapped market potential.
- For instance, Brazil’s Ministry of Infrastructure was dissolved in 2023, and public investments in federal highway upgrades that year were far below $5 billion, with significant private and public spending being channeled through other programs like the New Growth Acceleration Programme (PAC).
Key Challenges
High Equipment and Maintenance Costs
The high upfront cost of advanced deflectometers, particularly Rolling Wheel Deflectometers (RWD), limits adoption among smaller contractors and developing markets. Beyond acquisition, ongoing calibration, servicing, and maintenance add to operational expenses. Many local contractors prefer cheaper alternatives or traditional testing methods. This cost barrier restricts wider penetration, especially in price-sensitive regions. To overcome this challenge, manufacturers must explore modular pricing, leasing models, or localized production to reduce costs while expanding reach to emerging infrastructure markets.
Limited Skilled Workforce
The operation of deflectometers requires skilled technicians capable of handling advanced software, calibration, and interpretation of test results. Many regions, particularly in developing economies, face a shortage of trained professionals. This knowledge gap leads to underutilization of equipment and inaccurate data interpretation, reducing the effectiveness of deflectometer testing. Manufacturers and agencies must invest in training programs, workshops, and digital tutorials to bridge this skills shortage. Without adequate workforce training, the reliability of deflectometer-based evaluations risks being compromised.
Competition from Alternative Testing Methods
Deflectometers face competition from other pavement testing techniques such as ground-penetrating radar (GPR), laser scanning, and automated imaging systems. These alternatives often provide faster results with less traffic disruption, appealing to agencies prioritizing efficiency. While deflectometers remain the standard for load-response testing, advancements in competing technologies threaten market share. Agencies are increasingly exploring hybrid testing strategies that combine GPR or imaging with deflection data. Sustained innovation and integration with complementary technologies are crucial for deflectometer manufacturers to remain competitive.
Regional Analysis
North America
North America led the deflectometer market with a 37% share in 2024, reaching a value of USD 301.41 million. The region is projected to expand at a CAGR of 7.8%, driven by heavy investments in road rehabilitation and advanced highway infrastructure. The U.S. dominates demand due to strict pavement testing standards and large-scale transportation funding programs. Adoption of Falling Weight Deflectometers (FWD) and Rolling Wheel Deflectometers (RWD) is particularly strong. By 2032, North America is expected to reach USD 572.15 million, reinforcing its position as the global leader in deflectometer adoption.
Europe
Europe accounted for a 24% share in 2024, valued at USD 193.26 million, with steady growth projected at a CAGR of 6.9%. Countries such as Germany, France, and the UK are major contributors, supported by advanced research and strict road quality regulations. Europe’s focus on pavement maintenance and sustainability initiatives is driving the demand for Light Weight Deflectometers (LWD) in both urban and rural projects. By 2032, the market is expected to reach USD 344.81 million, supported by ongoing infrastructure modernization programs across Western and Eastern Europe.
Asia Pacific
Asia Pacific represented a 22% market share in 2024, with revenues of USD 141.34 million, and is the fastest-growing region with a CAGR of 9.4%. Rapid urbanization, large-scale highway construction, and expansion of rail and airport projects in China, India, and Southeast Asia are fueling demand. LWDs are widely adopted due to affordability and mobility, while increasing use of FWD supports major infrastructure upgrades. By 2032, the region is projected to achieve USD 303.90 million, driven by government-backed infrastructure investment and smart city development programs.
Latin America
Latin America held a 4% share in 2024, valued at USD 32.48 million, and is expected to grow at a CAGR of 6.1%. Brazil and Argentina lead adoption due to rising investments in highway and airport infrastructure. Pavement rehabilitation programs and urban development initiatives contribute to the growing use of deflectometers. While the market is smaller compared to other regions, steady economic recovery and public-private partnerships are creating opportunities. By 2032, Latin America’s market size will reach USD 54.43 million, reflecting gradual but consistent infrastructure demand.
Middle East
The Middle East accounted for a 2% share in 2024, reaching USD 14.47 million, and is projected to expand at a CAGR of 4.9%. Growth is supported by investments in airport expansion, road networks, and mega construction projects in GCC countries. Adoption is still limited compared to developed regions due to reliance on imported testing technologies. However, government focus on long-term transport infrastructure is fostering steady demand. By 2032, the market is expected to grow to USD 22.13 million, supported by high-profile infrastructure modernization initiatives.
Africa
Africa contributed a 1% share in 2024, with a market value of USD 11.66 million, and is expected to grow at a CAGR of 4.6%. South Africa, Nigeria, and Egypt are the primary markets, driven by selective road and bridge projects. Limited budget allocations and lack of skilled workforce hinder wider adoption of deflectometers. However, international funding and aid-based infrastructure projects are creating opportunities for gradual growth. By 2032, the African market is anticipated to reach USD 17.49 million, reflecting its emerging but relatively small role in the global market.
Market Segmentations:
By Equipment Type
- Falling Weight Deflectometer (FWD)
- Light Weight Deflectometer (LWD)
- Rolling Wheel Deflectometer (RWD)
- Static Deflectometer
- Others
By Application
- Road Construction
- Railway Construction
- Airport Runways
- Bridges
- Pavement Rehabilitation & Overlay
- Others
By Region
- North America: U.S., Canada, Mexico
- Europe: UK, France, Germany, Italy, Spain, Russia, Rest of Europe
- Asia Pacific: China, Japan, South Korea, India, Australia, Southeast Asia, Rest of Asia Pacific
- Latin America: Brazil, Argentina, Rest of Latin America
- Middle East: GCC Countries, Israel, Turkey, Rest of Middle East
- Africa: South Africa, Egypt, Rest of Africa
Competitive Landscape
The deflectometer market is moderately consolidated, with global players and regional manufacturers competing through product innovation, technology integration, and strategic partnerships. Leading companies such as Illinois Tool Works Inc., Dynatest, PaveTesting Limited, Humboldt Mfg. Co., and Controls Group hold significant market share due to their wide product portfolios and established global presence. These firms emphasize advanced technologies, including automated data collection, IoT-enabled sensors, and software-driven analytics, to strengthen market positioning. Regional players like Aimil Ltd., Abatech, and Olson Instruments focus on cost-effective solutions and cater primarily to developing markets, offering portable devices such as Light Weight Deflectometers (LWDs). Collaborations with government agencies and research institutes play a vital role in expanding market reach. Competition is further shaped by new entrants introducing hybrid and digital-enabled deflectometers for smart infrastructure projects. Overall, the landscape reflects a mix of established leaders and emerging players targeting niche applications, ensuring steady innovation and competitive intensity.
Shape Your Report to Specific Countries or Regions & Enjoy 30% Off!
Key Players
- Illinois Tool Works Inc. (ITW)
- PaveTesting Limited
- Olson Instruments
- Dynatest
- Aimil Ltd.
- Humboldt Mfg. Co.
- Controls Group
- EPSILON TECHNOLOGY CORP
- Abatech
- ARA (Applied Research Associates)
- Greenwood Engineering (Traffic Speed Deflectometer)
- ZORN Instruments
- HMP GmbH & Co. KG
- KUAB
- Cooper Research Technology (Cooper Technology)
Recent Developments
- In May 2025, infraTest Prüftechnik GmbH acquired the WEBER Prüftechnik brand, known for its Light Weight Deflectometer (LWD WEBERconnect). Following the acquisition, infraTest continues to use the WEBER brand while providing LWD devices, calibration, servicing, and repair solutions.
- In February 2025, Greenwood Engineering held a webinar focused on the latest Traffic Speed Deflectometer (TSD) applications for road and runway management.
- In April 2025, ICC-IMS launched the Fast-Falling Weight Deflectometer (FastFWD), offering advanced pavement testing services with rapid, repeatable, and objective evaluations.
Report Coverage
The research report offers an in-depth analysis based on Equipment Type, Application and Region. It details leading market players, providing an overview of their business, product offerings, investments, revenue streams, and key applications. Additionally, the report includes insights into the competitive environment, SWOT analysis, current market trends, as well as the primary drivers and constraints. Furthermore, it discusses various factors that have driven market expansion in recent years. The report also explores market dynamics, regulatory scenarios, and technological advancements that are shaping the industry. It assesses the impact of external factors and global economic changes on market growth. Lastly, it provides strategic recommendations for new entrants and established companies to navigate the complexities of the market.
Future Outlook
- Demand for deflectometers will increase with rising investments in global road infrastructure.
- Adoption of smart and IoT-enabled deflectometers will enhance real-time pavement monitoring.
- Light Weight Deflectometers will gain traction in developing regions due to cost-effectiveness.
- Rolling Wheel Deflectometers will see wider use for large highway network assessments.
- Growth in airport and rail projects will strengthen the role of advanced testing equipment.
- Preventive maintenance strategies will drive recurring demand for pavement evaluation tools.
- Manufacturers will expand product offerings with digital integration and automated analytics.
- Partnerships with governments and research bodies will shape future adoption trends.
- Emerging economies will provide untapped opportunities through urbanization and smart city programs.
- Competition from alternative pavement testing technologies will push firms toward continuous innovation.


