
Antidiabetic drugs shift value toward incretin therapies
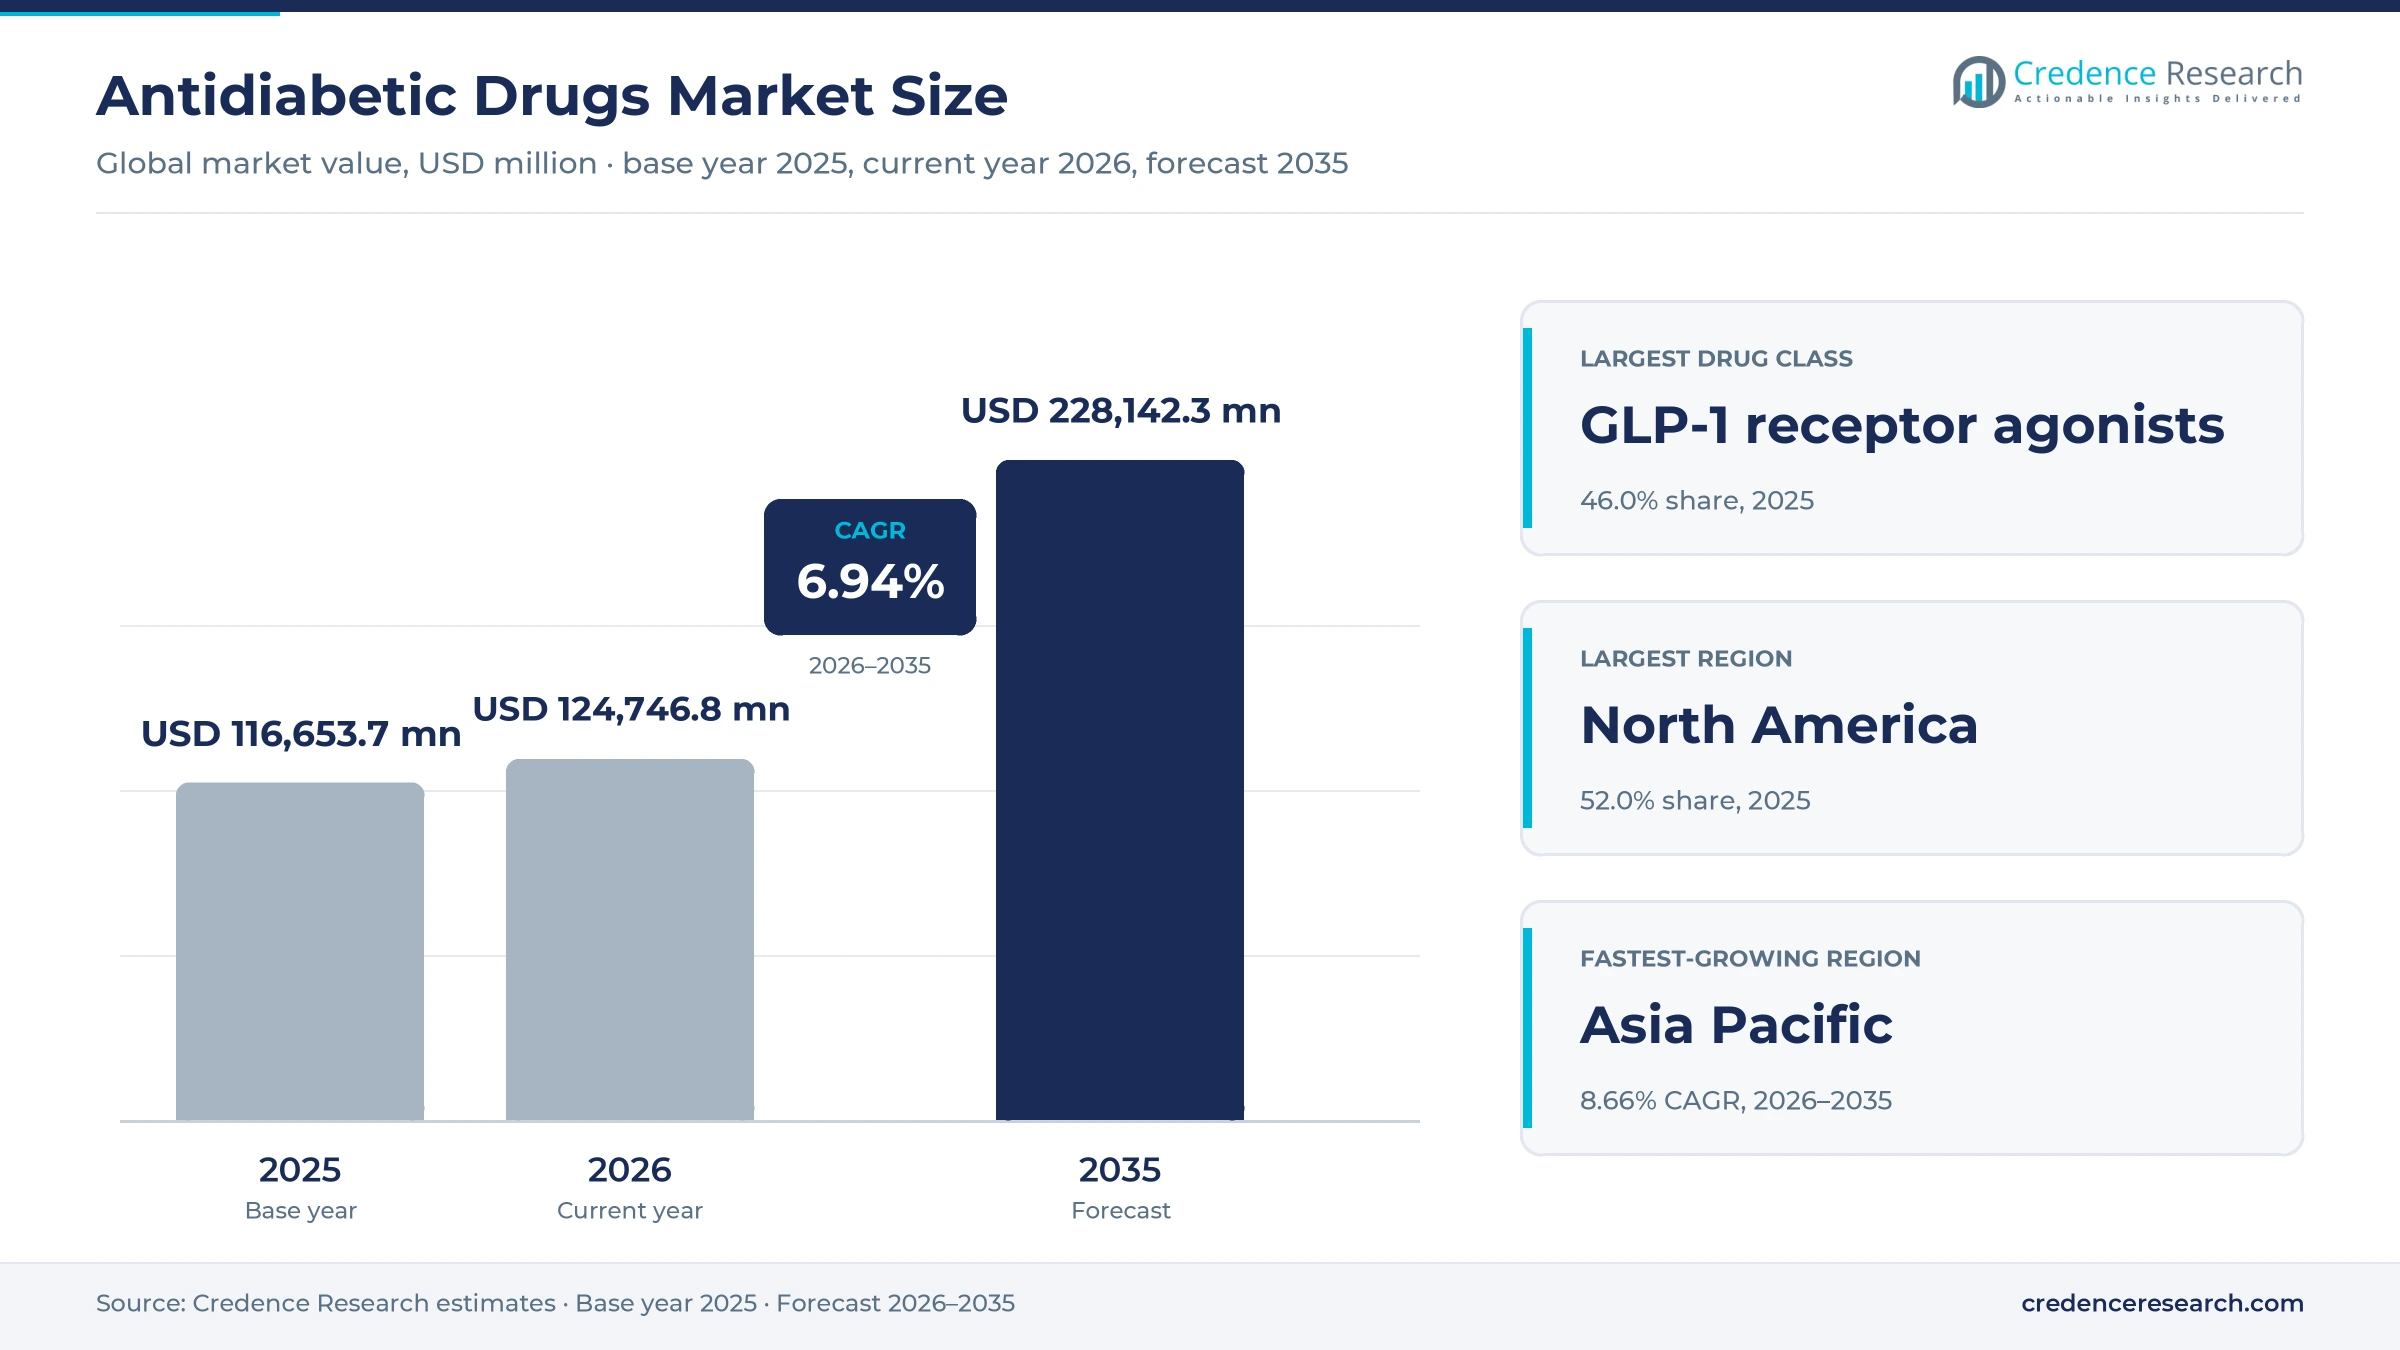
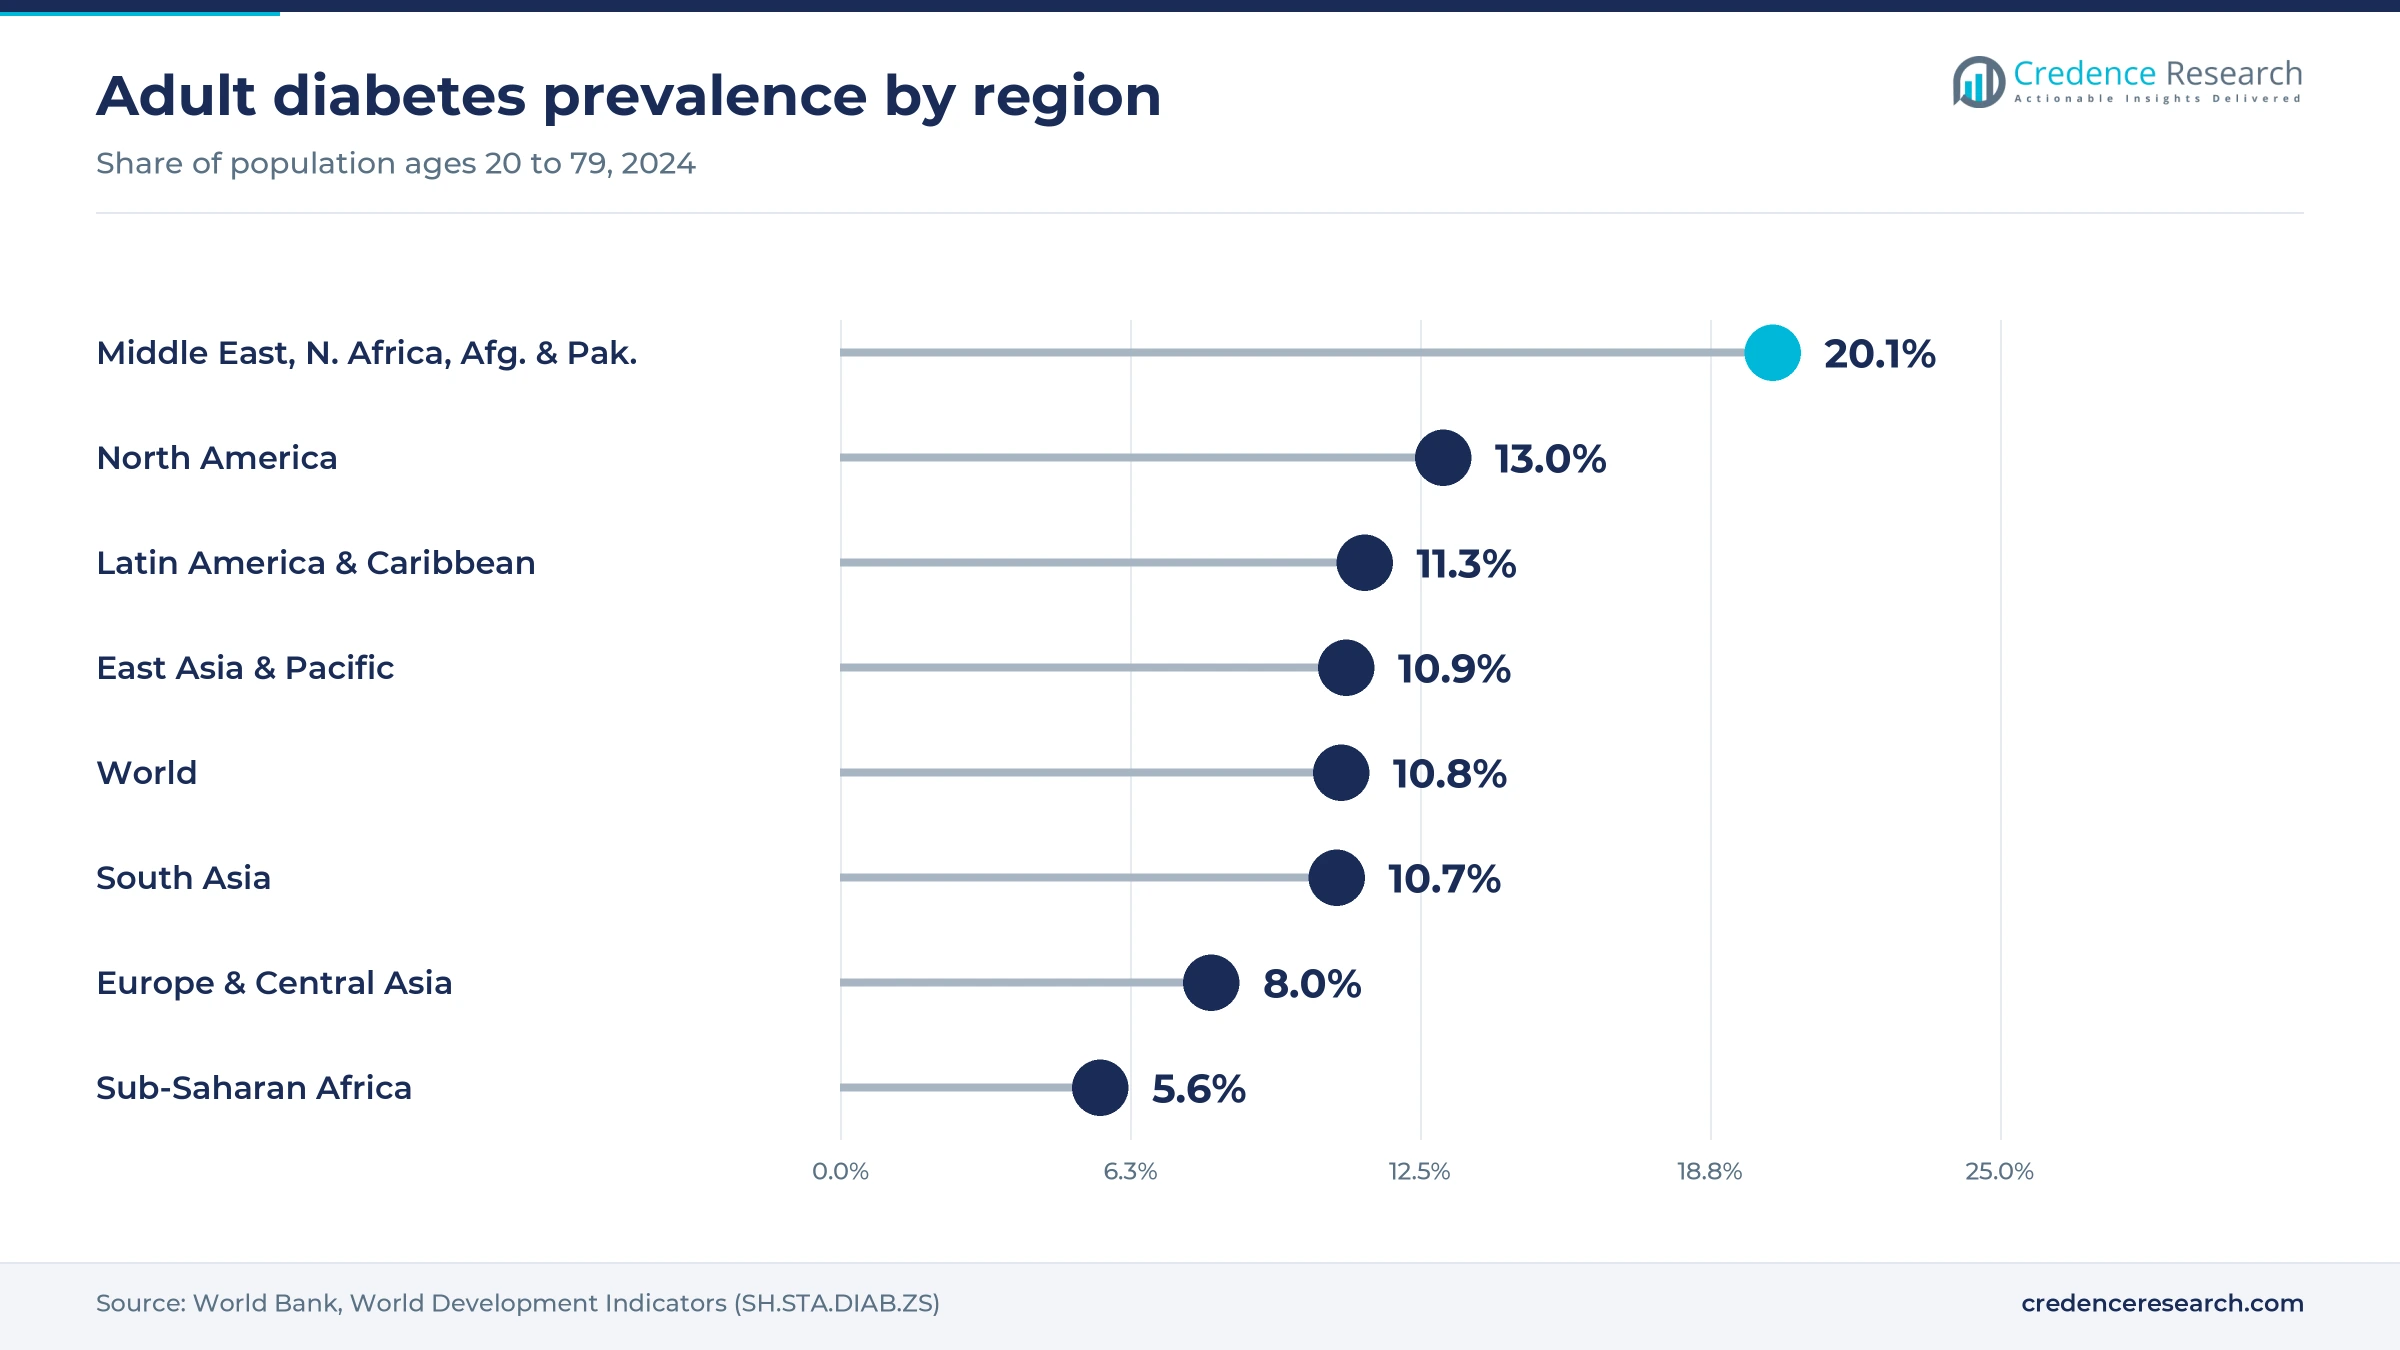
The global antidiabetic drugs market was valued at USD 116.65 billion in 2025 and is projected to increase from USD 124.75 billion in 2026 to USD 228.14 billion by 2035, registering a CAGR of 6.94% during 2026–2035. Demand rests on a large and growing treated population, since the World Bank puts adult diabetes prevalence at 10.8% worldwide in 2024. Spending has shifted toward GLP-1 receptor agonists and dual agonists, which carry higher prices than older oral agents and now anchor most treatment intensification. North America held the largest regional share, 52.0% in 2025, because U.S. prices for incretin and insulin brands remain far above those elsewhere. Asia Pacific is the fastest-growing region at 8.66% a year, as diagnosis and reimbursement widen in China and India. Medicare negotiated prices for four diabetes medicines took effect in January 2026, which tempers U.S. growth while once-weekly insulin and oral GLP-1 pills widen treatment options.
What do antidiabetic drugs include in this report?
The scope counts revenue from prescription medicines labeled to lower blood glucose in type 1 and type 2 diabetes. It covers insulins, GLP-1 receptor agonists including dual agonists such as tirzepatide, SGLT2 and DPP-4 inhibitors, metformin, sulfonylureas and fixed-dose combinations. Hospitals, retail chains and online pharmacies dispense these products, while payers control access through formularies, reimbursement lists and national tenders.
Brands labeled only for chronic weight management, such as Wegovy, Zepbound and Foundayo, sit outside the scope even though they share molecules with diabetes brands. Glucose monitors, insulin pumps and stand-alone pen needles are also excluded, because they are device purchases rather than drug spending. The value chain runs from active ingredient and peptide synthesis through fill-finish, wholesale distribution and pharmacy dispensing.
Antidiabetic Drugs Market Insights
- The antidiabetic drugs market grows from USD 116.65 billion in 2025 to USD 228.14 billion by 2035, a CAGR of 6.94% during 2026–2035.
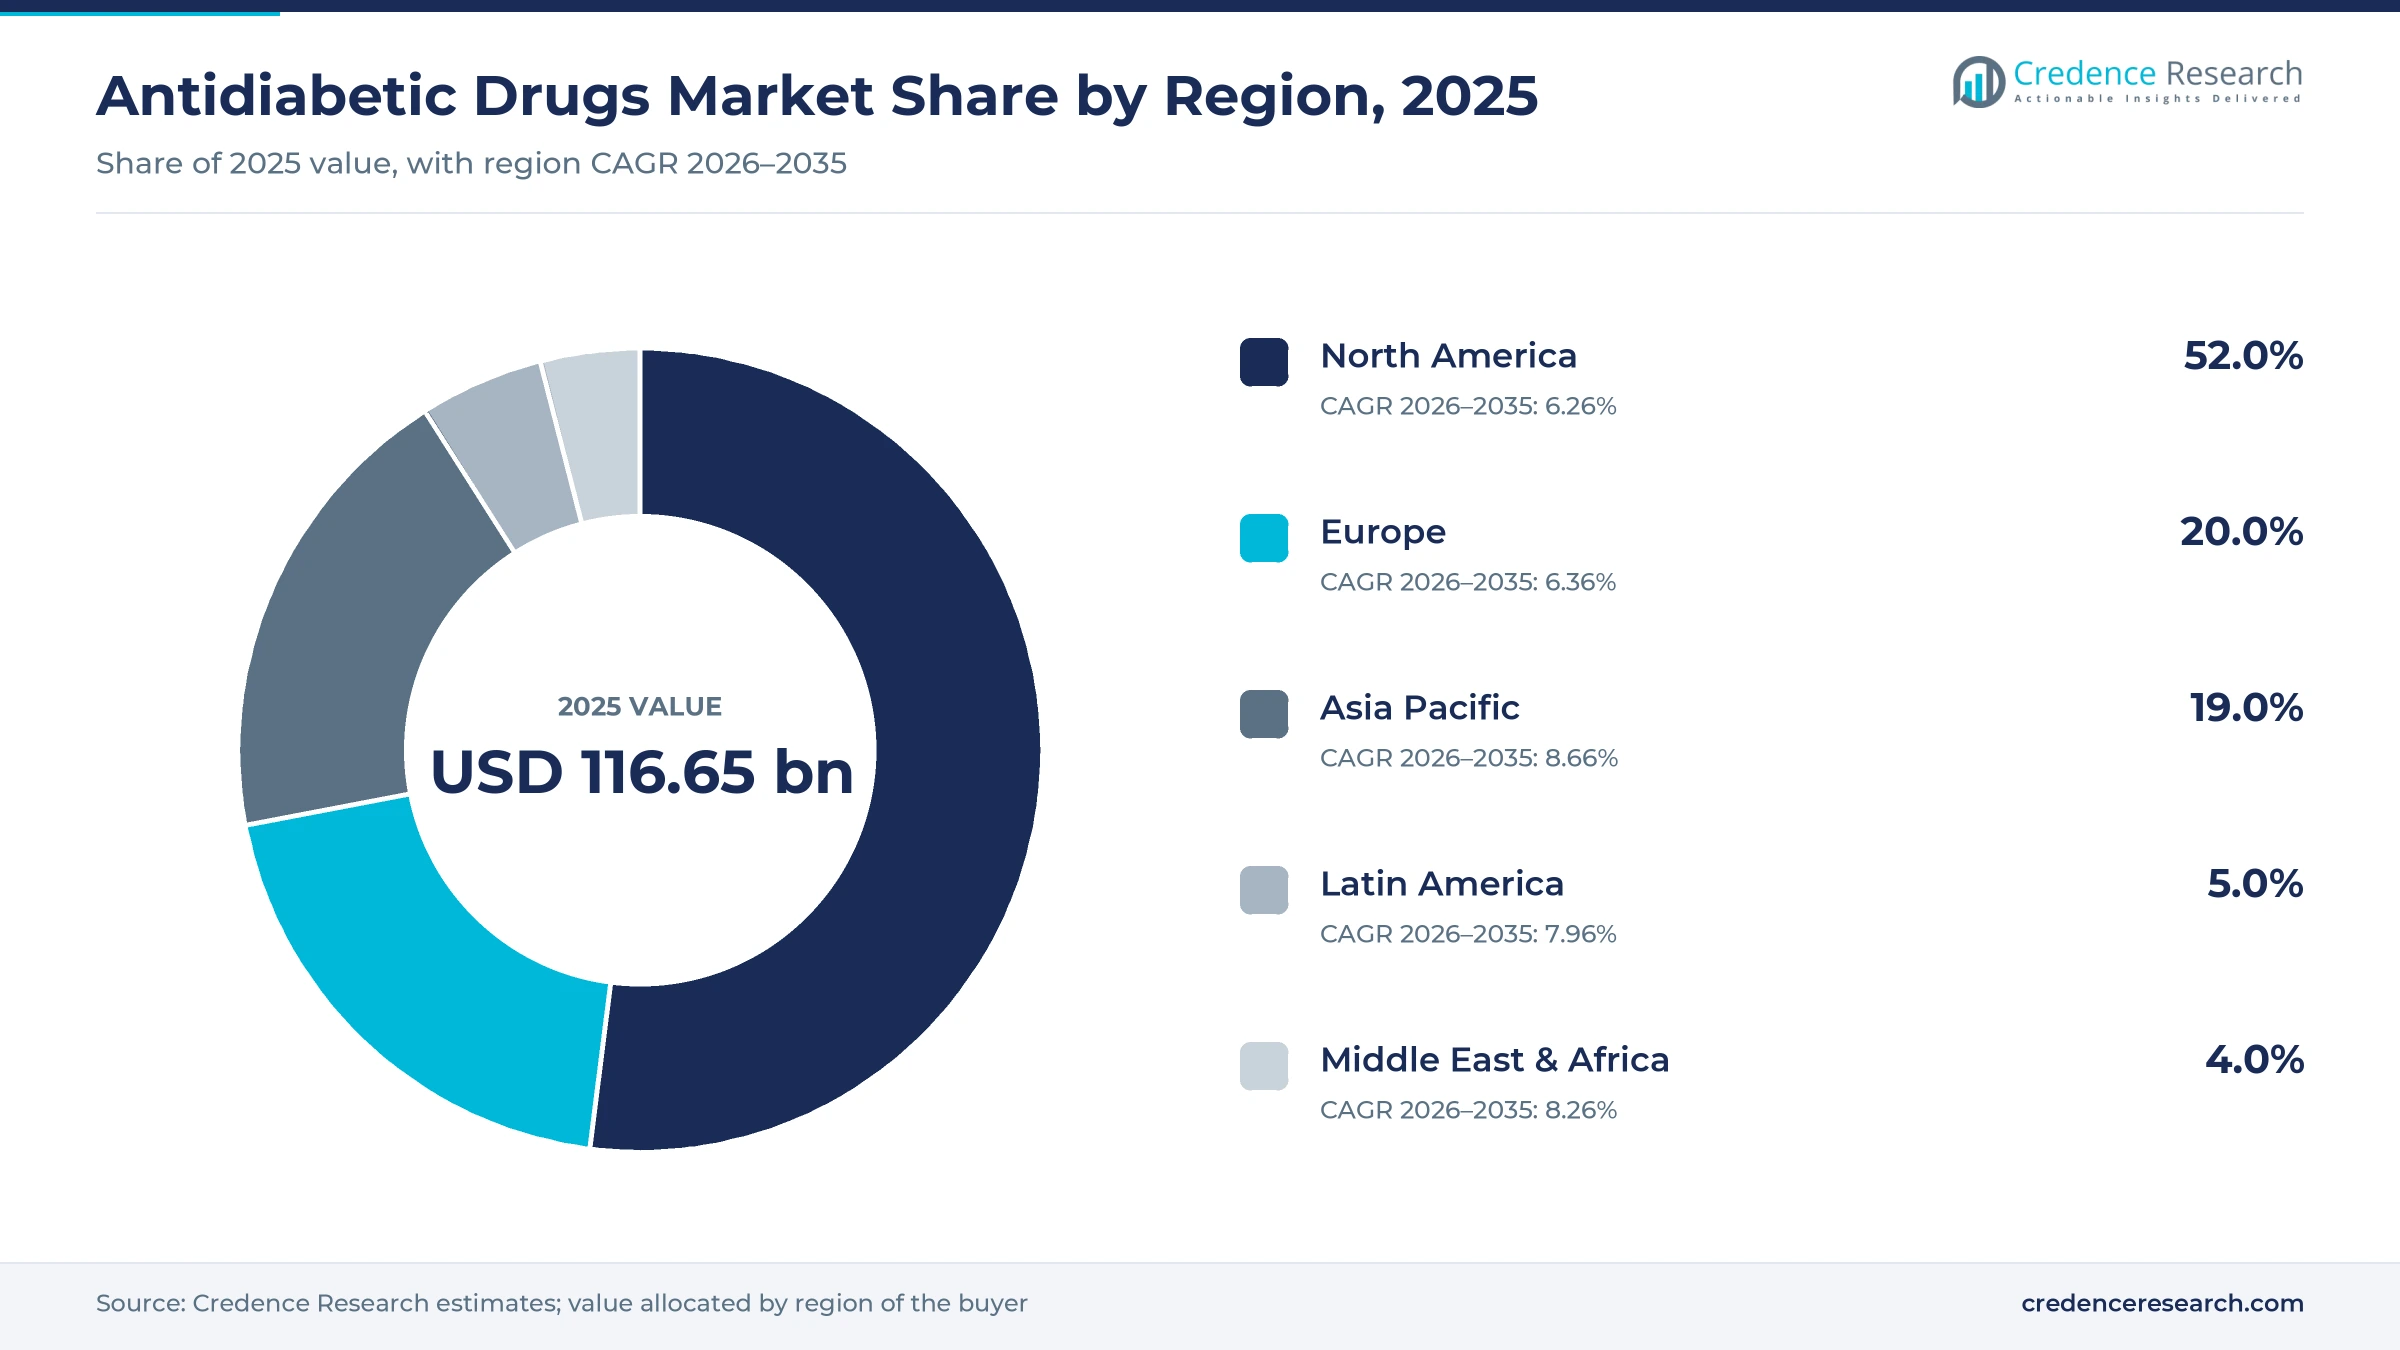
- North America held 52.0% of global value in 2025, supported by high U.S. net prices for incretin, insulin and SGLT2 brands.
- GLP-1 receptor agonists, including dual agonists such as tirzepatide, led drug classes with 46.0% of 2025 value and grow fastest at 9.36%.
- Novo Nordisk announced FDA approval of Awiqli in March 2026, making it the first once-weekly basal insulin cleared for U.S. adults with type 2 diabetes.
- Medicare negotiated prices for Januvia, Jardiance, Farxiga and NovoLog took effect in January 2026, shifting competition toward volume, access and newer incretin therapies.
GLP-1 agonists and injectables hold the largest share
Why do GLP-1 receptor agonists dominate drug class value?
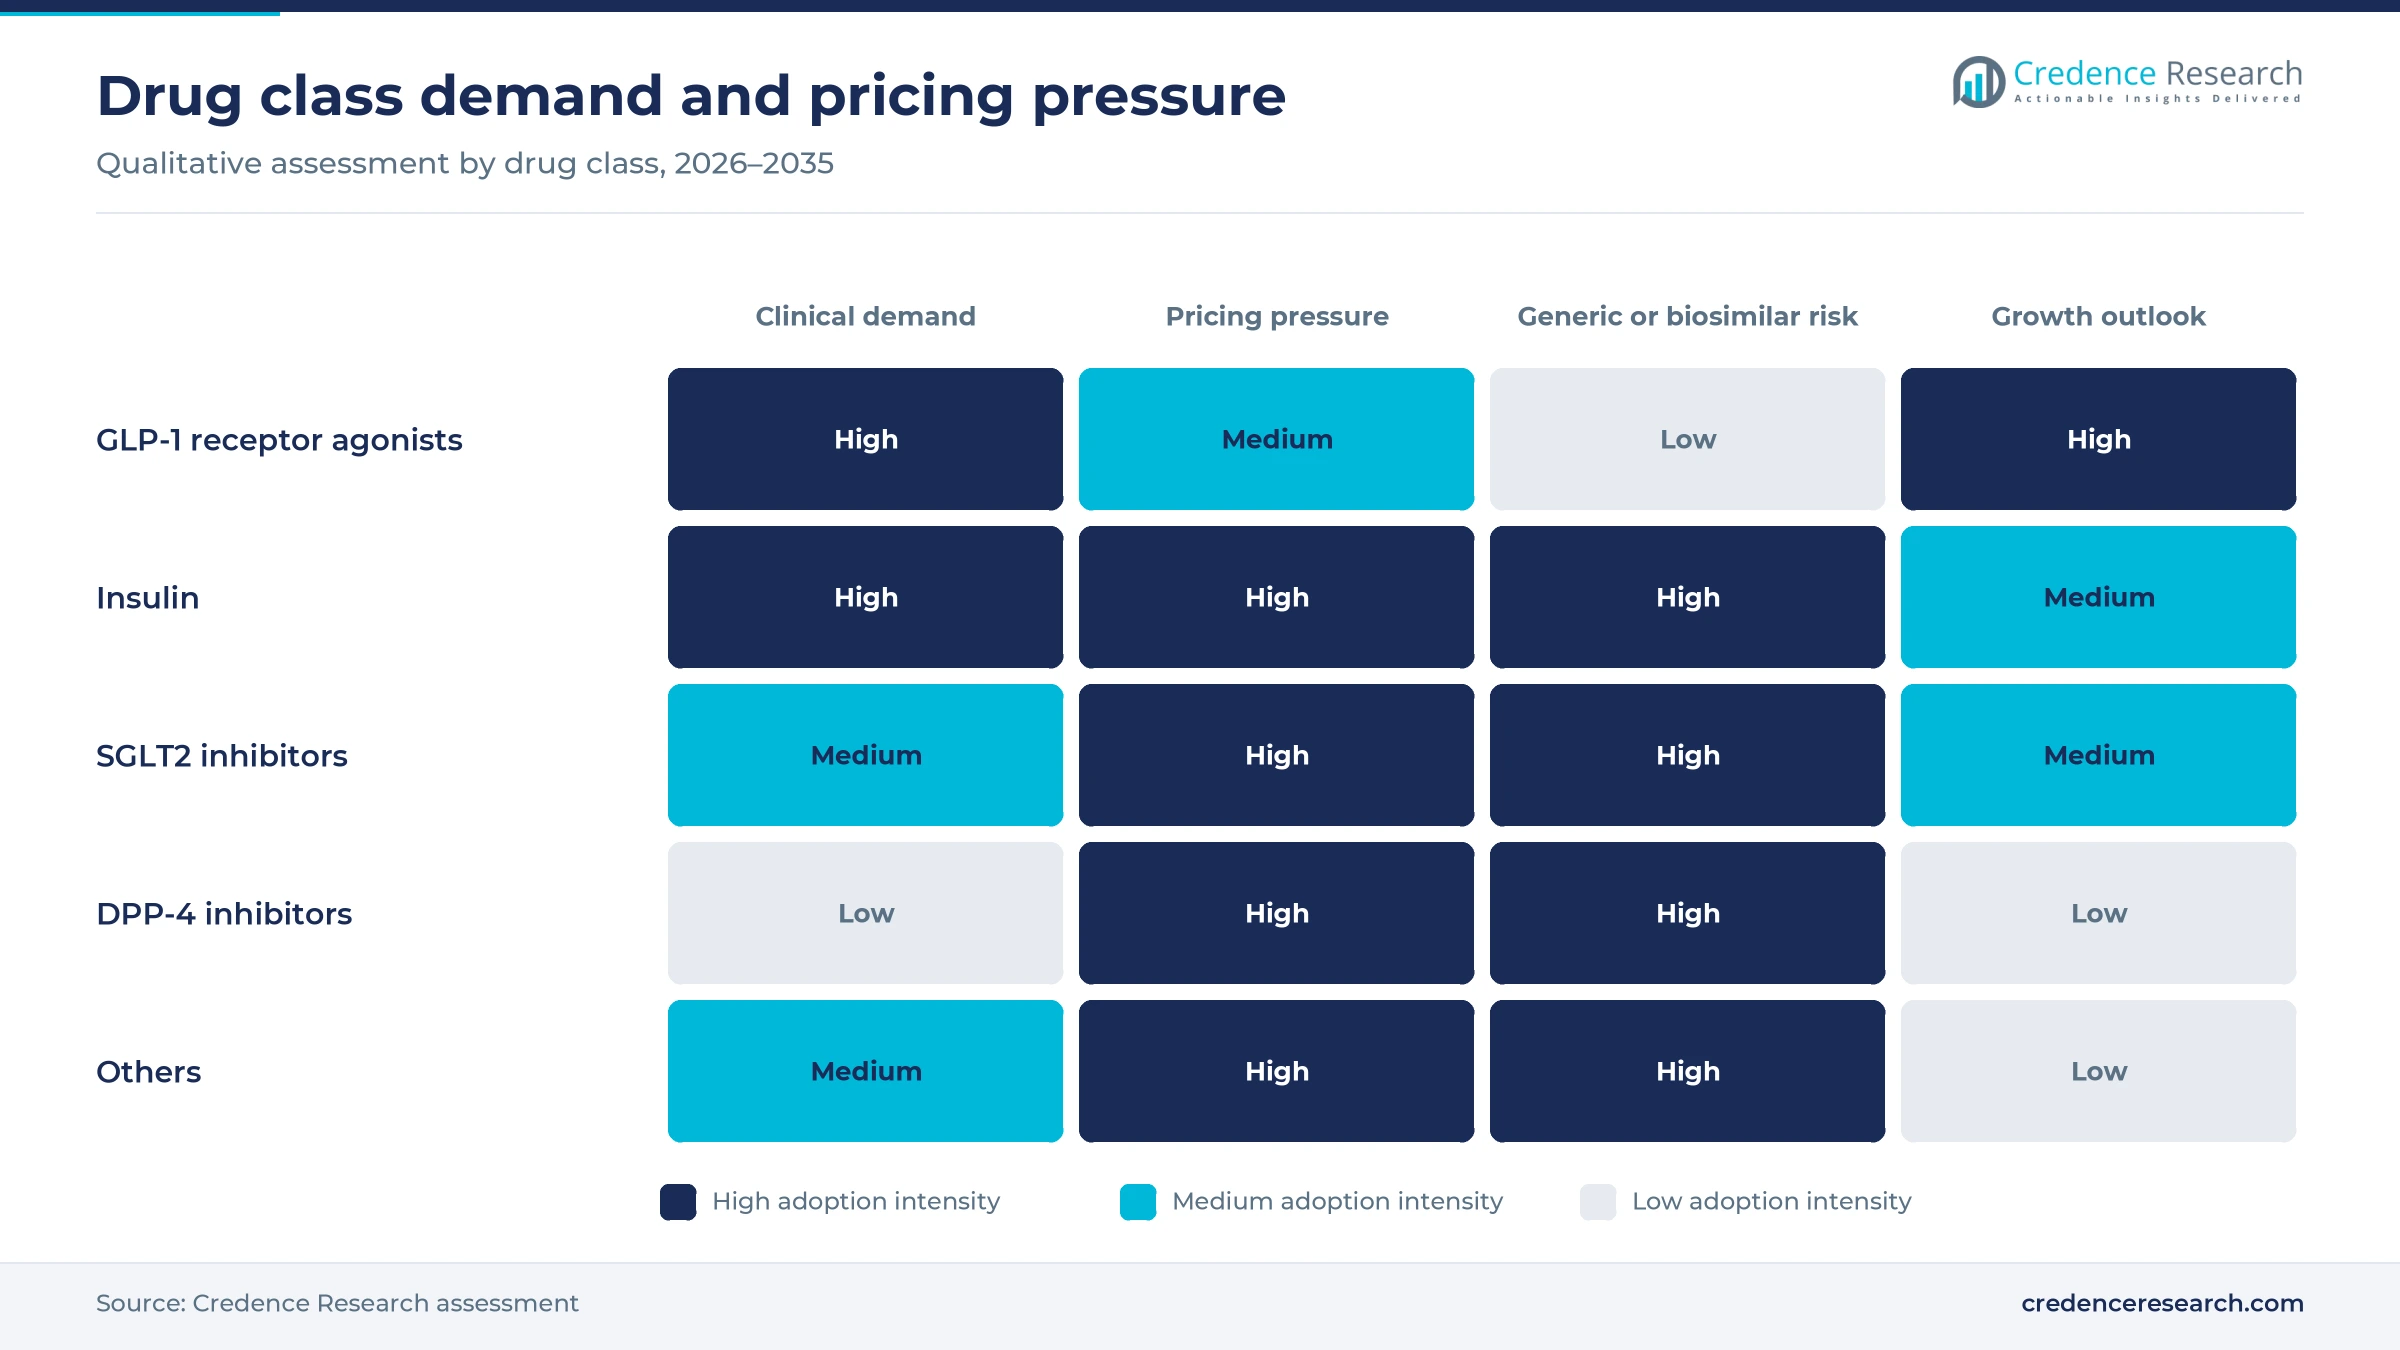
Based on drug class, the market is categorized into insulin, GLP-1 receptor agonists, DPP-4 inhibitors, SGLT2 inhibitors and others. GLP-1 receptor agonists led with 46.0% of 2025 value, because semaglutide and tirzepatide combine strong glucose lowering with weight loss and cardiovascular benefit. The same class grows fastest at 9.36% a year as oral forms reach more patients. Demand for GLP-1 receptor agonist therapy also benefits from guideline preference in patients with heart or kidney disease.
How much of the spending goes to type 2 diabetes?
Based on diabetes type, the market is categorized into type 1 and type 2 diabetes. Type 2 diabetes accounted for 88.0% of 2025 value, because it represents the large majority of diagnosed adults and carries the broadest drug use. Type 2 treatment also grows fastest at 7.10% a year as GLP-1 and SGLT2 use spreads into earlier lines of therapy. Type 1 spending depends almost entirely on insulin, so biosimilar entry and price caps limit its value growth.
Why are oral products gaining on injectables?
Based on route of administration, the market is categorized into oral and subcutaneous products. Subcutaneous injections led with 71.0% of 2025 value, since insulin and most GLP-1 brands are injected through prefilled pens. Oral products grow fastest at 7.50% a year, because GLP-1 pills such as oral semaglutide and orforglipron remove the injection barrier for many patients. Generic metformin, DPP-4 and SGLT2 tablets add volume to the oral segment but offer limited value growth.
Which pharmacy channels dispense most diabetes prescriptions?
Based on distribution channel, the market is categorized into hospital pharmacies, retail pharmacies, online pharmacies and others. Retail pharmacies led with 55.0% of 2025 value, because most patients refill chronic prescriptions at community stores. Online pharmacies grow fastest at 9.92% a year as mail-order benefit designs and telehealth prescribing expand. Hospital pharmacies remain important for insulin initiation, inpatient glucose control and newly diagnosed type 1 patients.
| Segment Group | Leading Sub-segment | Share, 2025 | Fastest-growing Sub-segment | CAGR, 2026–2035 |
|---|---|---|---|---|
| By Drug Class | GLP-1 Receptor Agonists | 46.0% | GLP-1 Receptor Agonists | 9.36% |
| By Type | Type 2 | 88.0% | Type 2 | 7.10% |
| By Route of Administration | Subcutaneous | 71.0% | Oral | 7.50% |
| By Distribution Channel | Retail Pharmacies | 55.0% | Online Pharmacies | 9.92% |
Request a Free Sample
Fill in your details and we'll send you a free sample report.
- Sample data tables & charts
- Research methodology
Prevalence and cardiorenal evidence lift drug spending
Rising adult prevalence keeps treated populations growing
Diabetes prevalence keeps expanding the pool of patients who need lifelong drug therapy across every region. The World Bank reports adult diabetes prevalence of 10.8% worldwide in 2024, with the highest rate in the Middle East and North Africa. Because type 2 diabetes progresses over time, most patients add a second or third agent within a decade of diagnosis. As a result, demand for antidiabetic drugs grows with both new diagnoses and treatment intensification through 2035, even in markets where prices per prescription are falling.
Cardiorenal outcome data move GLP-1 and SGLT2 use earlier
Outcome trials showing fewer heart and kidney events have moved GLP-1 receptor agonists and SGLT2 inhibitors ahead of older agents in clinical guidelines. This shift raises spending per patient, because branded incretins and gliflozins cost far more than metformin or sulfonylureas. The WHO added semaglutide, dulaglutide, liraglutide and tirzepatide to its Essential Medicines List in September 2025 for adults with type 2 diabetes and heart or kidney disease. In turn, public payers in middle-income countries gain a clear reference for procurement decisions.
Insulin biosimilars widen access at lower prices
Biosimilar insulins lower the cost of basal and mealtime therapy for health systems that buy primarily on price. The FDA approved Sanofi’s Merilog in February 2025 as the first rapid-acting insulin biosimilar, referencing NovoLog for adults and children with diabetes. The agency noted that about 8.4 million Americans rely on insulin, which gives lower-cost products a large addressable base. Because biosimilars trade value for volume, they expand treated patients while restraining growth in insulin revenue across the United States and Europe.
Manufacturing investment eases incretin supply limits
Shortages of injectable GLP-1 brands between 2022 and 2025 showed that fill-finish capacity limits how fast the class can grow. Novo Nordisk responded by completing its acquisition of three manufacturing sites from Novo Holdings in December 2024, after the Catalent purchase closed. Eli Lilly announced plans in February 2025 to invest in four new U.S. manufacturing sites for active ingredients and injectable medicines. As capacity rises, the market can convert prescription demand into dispensed volume rather than backorders.
Weekly insulin and oral GLP-1 pills reshape treatment
Shift from daily to once-weekly basal insulin
Insulin therapy is shifting toward fewer injections, which can improve adherence among people who start basal treatment late. Novo Nordisk announced FDA approval of Awiqli in March 2026 as the first once-weekly basal insulin for adults with type 2 diabetes. Weekly dosing cuts basal injections from 365 to 52 a year, which lowers a long-standing barrier to insulin initiation. This format is likely to draw further competition as other originators develop weekly basal analogs for both diabetes types.
Rise of oral GLP-1 pills that skip injections
Oral incretins are emerging as a second growth wave, because many patients and primary care doctors prefer tablets to pens. Eli Lilly announced FDA approval of Foundayo, the oral GLP-1 agonist orforglipron, in April 2026 for chronic weight management. The company has submitted orforglipron for weight management, type 2 diabetes or both in more than 40 countries. In turn, oral GLP-1 tablets are expected to lift the oral share of antidiabetic drugs spending over the forecast period.
Opportunity in middle-income markets as semaglutide patents lapse
Middle-income countries represent the largest untreated opportunity, because diagnosis rates are rising faster than access to newer drug classes. Core semaglutide patents expire in China, India and Brazil in 2026, and a Canadian patent has lapsed, which opens room for lower-cost versions. The essential-medicines listing for GLP-1 drugs also gives health ministries a basis to tender for them. As a result, companies with low-cost peptide manufacturing can win public tenders and private-pay volume in Asia Pacific and Latin America.
Opportunity in fixed-dose combinations and connected pens
Combination products and connected delivery offer a value opening as many molecules lose exclusivity in mature markets. Fixed-dose pairings of SGLT2 inhibitors, DPP-4 inhibitors and metformin reduce pill burden, which helps adherence in patients on three or more agents. Prefilled injection pens with dose memory and app links also let insulin and GLP-1 brands differentiate beyond price. Because payers reward adherence, such formats can protect margins after generic entry.
Price negotiation and generics cap value growth
Medicare price negotiation compresses U.S. net prices
U.S. price controls are the main restraint on value growth, because the country generates most global spending on branded diabetes medicines. CMS reported that negotiated prices for 10 drugs, including Januvia, Jardiance, Farxiga and NovoLog, would have saved Medicare about $6 billion in a year. Those prices took effect on Jan. 1, 2026, for Part D enrollees. Semaglutide brands were selected for the next negotiation cycle, which adds further pressure on incretin revenue from 2027.
Generic entry erodes DPP-4 and SGLT2 franchises
Loss of exclusivity is cutting prices for the oral classes that once drove growth in type 2 diabetes treatment. Generic sitagliptin and dapagliflozin are already sold in India and other markets, and U.S. generic entry follows patent and settlement timelines. Because generic tablets often sell for a fraction of the brand price, DPP-4 inhibitors grow slowest among drug classes over the forecast. Originators respond with fixed-dose combinations, authorized generics and a shift of promotion toward incretins.
Affordability gaps limit insulin access in low-income countries
Access to insulin and newer medicines remains uneven in countries where patients pay out of pocket. Many health systems in low-income countries still procure human insulin because analog and incretin prices exceed public budgets. Cold-chain gaps, unreliable supply and limited specialist care also delay insulin starts in rural areas. As a result, prevalence growth in Sub-Saharan Africa and parts of South Asia converts into drug spending more slowly than in high-income countries.
Compounded and counterfeit GLP-1 copies divert demand
Shortages of branded incretins encouraged compounded and counterfeit copies, which divert demand and create safety risks for patients. The FDA removed semaglutide and tirzepatide from its shortage list after supply recovered, which ended the main legal basis for mass compounding. However, unapproved online sellers continue to market copies, and regulators have warned patients about fake pens. Originators therefore invest in supply security, pricing programs and enforcement to recapture this volume.
North America leads while Asia Pacific grows fastest
| Region | Value, 2025 (USD billion) | Share, 2025 | CAGR, 2026–2035 |
|---|---|---|---|
| North America | 60.66 | 52.0% | 6.26% |
| Europe | 23.33 | 20.0% | 6.36% |
| Asia Pacific | 22.16 | 19.0% | 8.66% |
| Latin America | 5.83 | 5.0% | 7.96% |
| Middle East & Africa | 4.67 | 4.0% | 8.26% |
North America leads on high incretin and insulin prices
North America held 52.0% of 2025 value and grows at 6.26% a year through 2035. The United States drives this lead, because list and net prices for GLP-1, insulin and SGLT2 brands remain well above those in other high-income markets. The FDA reports that more than 38 million Americans have been diagnosed with diabetes, which sustains a large treated base. However, Medicare negotiation and insulin copay caps keep regional growth below the global rate.
Europe grows steadily under tender pricing
Europe accounted for 20.0% of 2025 value and grows at 6.36% a year, the slowest rate among regions. National health systems in Germany, France, the United Kingdom, Italy and Spain negotiate prices tightly, which narrows the gap between new and older classes. Biosimilar insulin uptake is high across the region, and SGLT2 generic entry continues to reduce spending per patient. Even so, wider GLP-1 reimbursement for patients with cardiovascular disease supports steady value growth.
Asia Pacific adds treated patients fastest
Asia Pacific held 19.0% of 2025 value and is the fastest-growing region at 8.66% a year. China and India hold the two largest diabetic populations in the world, and diagnosis rates continue to rise with urbanization and aging. China’s volume-based procurement has cut prices for insulin and oral agents, which expands volume while limiting value per patient. Japan and Australia add premium demand for incretins, while lower-cost semaglutide could widen access in India after 2026.
Latin America expands public diabetes coverage
Latin America accounted for 5.0% of 2025 value and grows at 7.96% a year. Brazil and Mexico lead regional demand, supported by public programs that dispense insulin and metformin at little or no cost. Rising obesity rates keep type 2 diabetes incidence high, which favors gradual uptake of GLP-1 and SGLT2 therapies among privately insured patients.
Middle East & Africa pairs high prevalence with low access
Middle East & Africa held 4.0% of 2025 value and grows at 8.26% a year. Gulf states record some of the highest adult prevalence rates in the world and fund newer drug classes through public insurance. Sub-Saharan Africa, by contrast, relies heavily on human insulin and generic oral agents, which keeps spending per patient low.
Approvals and capacity deals from 2024 to 2026
| Development | Status and market relevance |
|---|---|
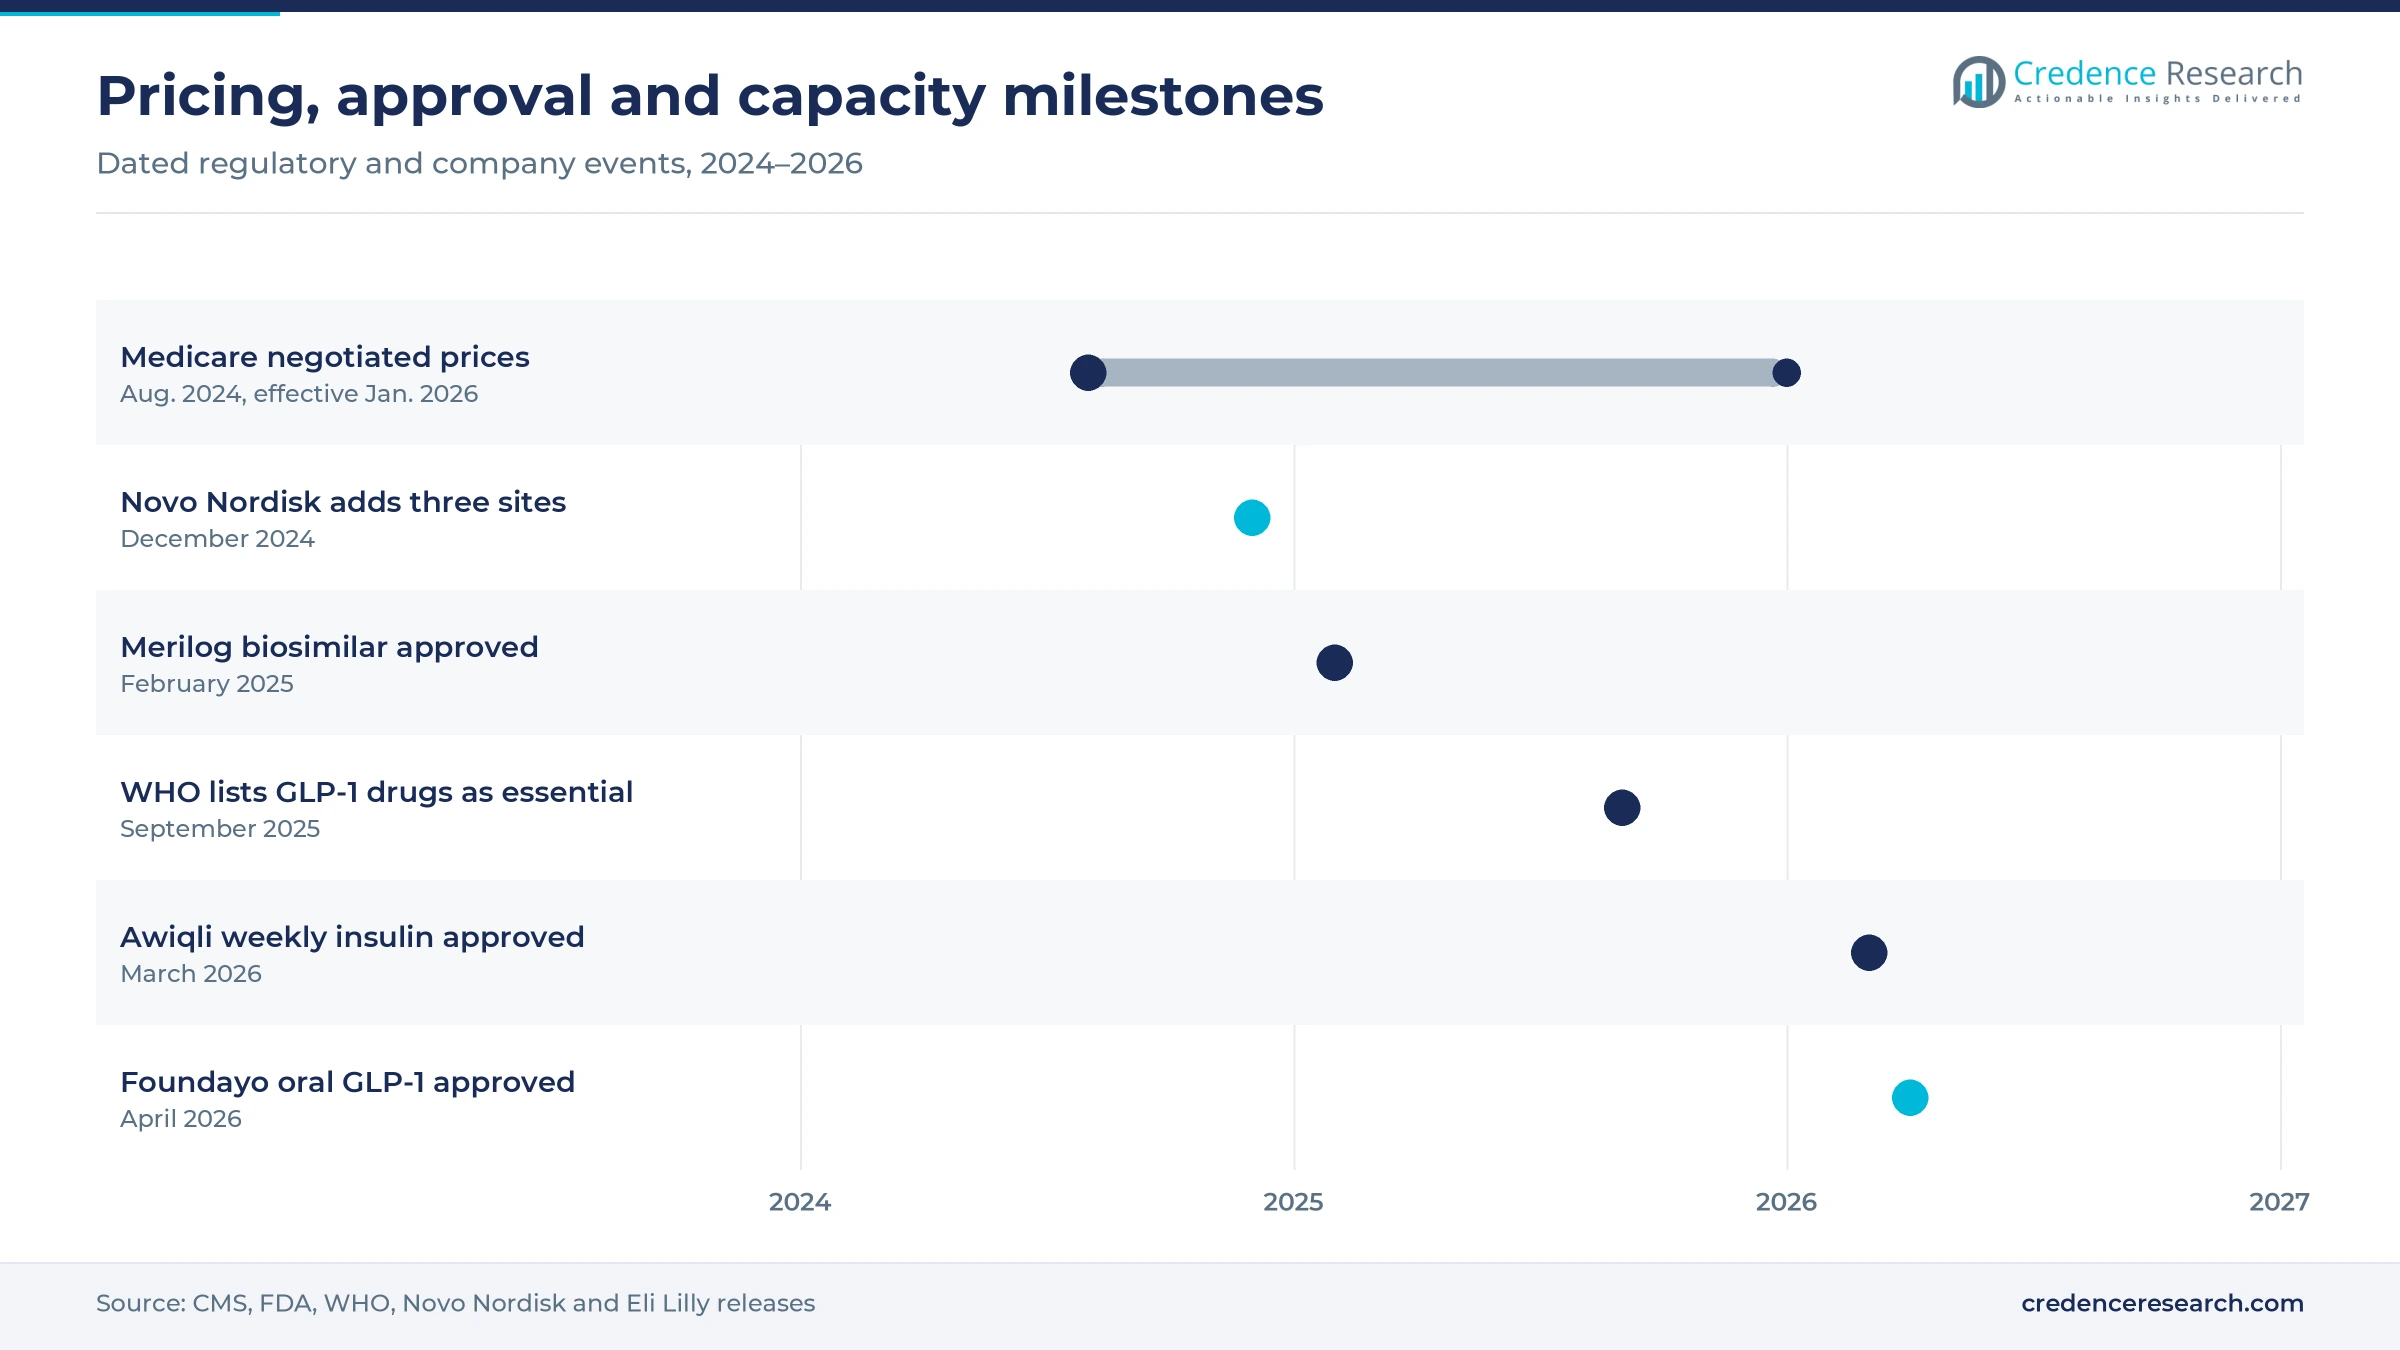
| In August 2024, CMS announced negotiated Medicare prices for 10 drugs, including Januvia, Jardiance, Farxiga and NovoLog. | Prices took effect on Jan. 1, 2026, and cut U.S. net revenue for DPP-4, SGLT2 and insulin brands. |
| In December 2024, Novo Nordisk completed its acquisition of three manufacturing sites from Novo Holdings after the Catalent deal. | Completed, adding fill-finish capacity for injectable GLP-1 and insulin supply. |
| In February 2025, the FDA approved Sanofi’s Merilog as the first rapid-acting insulin biosimilar. | Approved, widening lower-cost mealtime insulin options in the United States. |
| In March 2026, Novo Nordisk announced FDA approval of Awiqli, the first once-weekly basal insulin. | Approved for adults with type 2 diabetes, reducing basal injections to one a week. |
| In April 2026, Eli Lilly announced FDA approval of Foundayo, the oral GLP-1 agonist orforglipron. | Approved for chronic weight management, with type 2 diabetes filings submitted in multiple countries. |
Delivery formats that cut injections and costs
- Once-weekly basal insulin reduces basal injections from 365 to 52 a year and should lift persistence among adults who delay insulin.
- Oral small-molecule GLP-1 agonists such as orforglipron avoid peptide synthesis and food restrictions, which can lower manufacturing cost and widen primary care use.
- Multi-agonist peptides that combine GLP-1 with GIP, glucagon or amylin activity aim for larger glucose and weight effects than single agonists.
- Connected pens and dose logging link injections to glucose data, which helps clinicians adjust insulin doses remotely and lets payers track adherence.
Need a Custom Version of This Report?
Tailor the scope, geography, or segments to your exact requirements.
- Custom geography or segment scope
- Direct access to our analyst team
Novo Nordisk and Eli Lilly set the incretin pace
Competition centers on the incretin class, where Novo Nordisk and Eli Lilly hold most branded GLP-1 and dual-agonist sales for type 2 diabetes. Both companies compete on clinical differentiation, manufacturing scale and payer contracts rather than list price alone. Sanofi, Novo Nordisk and Eli Lilly also lead insulin, where biosimilars and U.S. price caps have shifted competition toward volume and device convenience. In oral therapy, Merck, AstraZeneca, Boehringer Ingelheim with Eli Lilly, and Johnson & Johnson defend DPP-4 and SGLT2 franchises against generic entry. Takeda, Novartis and Bayer keep regional portfolios of older agents such as alogliptin, vildagliptin and acarbose. Indian manufacturers, including Sun Pharmaceutical and USV, compete on low-cost branded generics of metformin, gliptins and gliflozins at home and in export markets. As semaglutide patents lapse in large emerging markets, generic peptide makers are expected to enter the GLP-1 class.
Companies profiled and their roles in this market
| Company | Type | Role in the market |
|---|---|---|
| Novo Nordisk | Originator | Semaglutide (Ozempic, Rybelsus), insulin analogs and once-weekly Awiqli |
| Eli Lilly and Company | Originator | Tirzepatide (Mounjaro), dulaglutide, insulin lispro and the Jardiance alliance |
| Sanofi | Originator and biosimilar maker | Insulin glargine (Lantus, Toujeo) and the Merilog insulin aspart biosimilar |
| Merck & Co., Inc. | Originator | Sitagliptin franchise (Januvia, Janumet) in the DPP-4 class |
| AstraZeneca plc | Originator | Dapagliflozin (Farxiga) in the SGLT2 class and exenatide |
| Johnson & Johnson Services Inc. | Originator | Canagliflozin (Invokana) in the SGLT2 class |
| Novartis AG | Originator | Vildagliptin (Galvus) in markets outside the United States |
| Takeda Pharmaceutical Company | Originator | Alogliptin and pioglitazone oral agents |
| Bayer AG | Originator | Acarbose (Glucobay) alpha-glucosidase inhibitor |
| USV Private Ltd | Branded generics | Metformin (Glycomet) and oral combinations in India |
| Sun Pharmaceutical Industries Ltd. | Generics and branded generics | Low-cost gliptins, gliflozins and metformin in India and export markets |
Why incretins will hold more than half of value
Credence Research’s view is that the antidiabetic drugs market will keep growing faster than the wider pharmaceutical market, but its value will concentrate further in incretin therapies. GLP-1 receptor agonists and dual agonists should account for more than half of value by the early 2030s, while insulin and older oral classes face price erosion from biosimilars, generics and U.S. negotiation. The key swing factor is the speed of oral GLP-1 adoption in primary care, which could expand treated patients faster than injectable brands. Supply capacity, rather than demand, remains the main constraint on near-term growth.
How the 2025 baseline and forecast were built
The report uses 2025 as the base year, 2026 as the first forecast year and 2035 as the final forecast year. Market values come from the Credence Research model, which builds spending from treated patient populations, drug class mix and prevailing prices. Segment and regional splits are Credence Research estimates based on prescribing patterns, pricing levels and access conditions. Inputs drew on regulator approvals and notices from the FDA, WHO and CMS, company press releases and filings, and World Bank prevalence data. No primary interviews or surveys were conducted for this edition of the report.
Growth to 2035 rests on access in emerging markets
By 2035, the market reaches USD 228.14 billion, with growth spread across new patients, treatment intensification and a shift to higher-value classes. Incretin therapies should take a rising share as oral forms and lower-cost versions widen use in Asia Pacific, Latin America and the Middle East. Insulin value grows more slowly, because biosimilars and weekly formulations compete on price and convenience. North America remains the largest region, although its share declines as negotiated U.S. prices spread across more brands. Companies that pair low-cost peptide manufacturing with strong payer access are best placed to gain share through 2035.
Frequently Asked Questions
How big is the antidiabetic drugs market?
Which drug class leads the antidiabetic drugs market?
Which region holds the largest share?
What is driving growth in antidiabetic drugs?
How does Medicare price negotiation affect the market?
Which route of administration grows fastest?
Who are the leading companies?
Which recent approvals matter most for the market?
Table of Content
Chapter 1 Market Segmentation
- 1.1 Segmentation Framework
- 1.1.1 Product and Service Classification
- 1.1.2 Application and End-Use Classification
- 1.1.3 Technology and Solution Classification
- 1.1.4 Customer and Distribution Channel Classification
- 1.1.5 Geographic Segmentation
- 1.1.6 Market Segment Definitions and Boundaries
- 1.2 By Drug Class
- 1.2.1 GLP-1 Receptor Agonists
- 1.2.2 Insulin
- 1.2.3 SGLT2 Inhibitors
- 1.2.4 DPP-4 Inhibitors
- 1.2.5 Others
- 1.3 By Type
- 1.3.1 Type 2
- 1.3.2 Type 1
- 1.4 By Route of Administration
- 1.4.1 Subcutaneous
- 1.4.2 Oral
Chapter 2 Introduction
- 2.1 Report Objectives and Scope
- 2.2 Product Definition and Industry Terminology
- 2.3 Market Inclusions and Exclusions
- 2.4 Research Process
- 2.4.1 Primary Research and Expert Interviews
- 2.4.2 Secondary Research and Source Review
- 2.4.3 Top-Down and Bottom-Up Estimation
- 2.4.4 Data Triangulation and Verification
- 2.5 Market Size Measurement Basis
- 2.5.1 2025: USD 116.65 billion → 2035: USD 228.14 billion
- 2.6 Historical and Forecast Reference Periods
- 2.6.1 Historical Period: 2018-2025
- 2.6.2 Base Year: 2025
- 2.6.3 Forecast Period: 2025-2035
- 2.7 Research Assumptions and Limitations
Chapter 3 Executive Summary
- 3.1 Market Snapshot and Key Findings
- 3.2 Base-Year Market Size, 2025
- 3.3 Forecast Market Size, 2035
- 3.4 Revenue and Volume Growth Outlook
- 3.5 Key Demand and Supply Indicators
- 3.6 Leading Market Segments
- 3.7 Fastest-Growing Market Opportunities
- 3.8 Regional Performance Highlights
- 3.9 Technology and Industry Transformation
- 3.10 Competitive Landscape Summary
- 3.11 Analyst View and Strategic Implications
Chapter 4 Global Antidiabetic Drugs Market Trends and Developments
- 4.1 Historical Industry Development, 2018-2025
- 4.2 Recent Market Trends and Developments
- 4.3 Demand and Customer Behavior Trends
- 4.4 Technology and Product Innovation
- 4.5 Artificial Intelligence, Automation and Digitalization
- 4.6 Local Manufacturing and Supply Chain Realignment
- 4.7 Industry Partnerships, Mergers and Acquisitions
- 4.8 Sustainability and Circular Economy Developments
- 4.9 Government and Private Sector Investment Trends
- 4.10 Emerging Business Models and Commercialization
- 4.11 Industry Developments and Announcements
Chapter 5 Global Antidiabetic Drugs Market Production, Supply and Demand Analysis
- 5.1 Demand Trend and Consumption Analysis, 2018-2025
- 5.2 Demand Forecast, 2025-2035
- 5.3 Production and Output Trend, 2018-2025
- 5.4 Production and Output Forecast, 2025-2035
- 5.5 Installed Capacity and Capacity Utilization
- 5.6 Company-Wise Production Plants and Statistics
- 5.6.1 Installed Production Capacity
- 5.6.2 Actual Production
- 5.6.3 Planned Capacity and Expansion Targets
- 5.7 Supply Chain Structure and Procurement Trends
- 5.8 Supply-Demand Gap and Bottlenecks
- 5.9 Import Dependence and Sourcing Structure
- 5.10 Contract Manufacturing and Outsourcing
- 5.11 Regional Supply and Demand Concentration
Chapter 6 Global Antidiabetic Drugs Market Pricing Analysis
- 6.1 Pricing Structure and Measurement
- 6.2 Historical Pricing Trends, 2018-2025
- 6.3 Pricing Outlook, 2025-2035
- 6.4 Average Selling Price and Unit Economics
- 6.5 Pricing by Product and Market Segment
- 6.6 Geographic Pricing Differences
- 6.7 Key Input, Energy, Labor and Logistics Costs
- 6.8 Contract Pricing and Purchasing Models
- 6.9 Pricing Sensitivity and Competitive Positioning
- 6.10 Price, Margin and Profitability Implications
Chapter 7 Global Antidiabetic Drugs Market Dynamics
- 7.1 Market Growth Drivers
- 7.1.1 Demand-Side Drivers
- 7.1.2 Technology and Innovation Drivers
- 7.1.3 Infrastructure and Investment Drivers
- 7.1.4 Regulatory and Policy Drivers
- 7.2 Market Restraints
- 7.2.1 Cost and Affordability Constraints
- 7.2.2 Technology and Adoption Barriers
- 7.2.3 Supply Chain and Operational Constraints
- 7.3 Market Challenges
- 7.3.1 Competitive Pressure and Margin Erosion
- 7.3.2 Skills, Infrastructure and Implementation Gaps
- 7.4 Emerging Market Opportunities
- 7.5 Market Dynamics Impact and Time-Horizon Assessment
Chapter 8 Global Antidiabetic Drugs Value Chain Analysis
- 8.1 Industry Value Chain Overview
- 8.2 Upstream Suppliers and Critical Inputs
- 8.3 Technology and Component Providers
- 8.4 Manufacturing or Service Delivery
- 8.5 Distribution, Channel Partners and Integrators
- 8.6 Downstream Applications and End Users
- 8.7 Value Addition and Profit Pools
- 8.8 Vertical Integration and Outsourcing
- 8.9 Supplier Concentration and Risk
- 8.10 Supply Chain Localization and Resilience
Chapter 9 Global Antidiabetic Drugs Market Regulations and Policies
- 9.1 Relevant Laws, Standards and Compliance Frameworks
- 9.2 Product, Service, Safety and Quality Requirements
- 9.3 Government Policies, Incentives and Subsidies
- 9.4 Imports, Exports and Trade Barriers
- 9.5 Public Procurement and Local Content Requirements
- 9.6 Environmental and Sustainability Compliance
- 9.7 Upcoming Policy Changes and Market Implications
Chapter 10 Global Antidiabetic Drugs Market Hotspots and Opportunities
- 10.1 Market Opportunity Mapping and Growth Hotspots
- 10.2 High-Growth Applications and Customer Groups
- 10.3 Underserved Markets and White-Space Opportunities
- 10.4 Emerging Technology and Product Opportunities
- 10.5 New Capacity and Investment Hotspots
- 10.6 Market Entry and Expansion Opportunities
- 10.7 Distribution and Partnership Opportunities
- 10.8 Near-Term and Long-Term Commercial Potential
- 10.9 Opportunity Attractiveness and Execution Risks
Chapter 11 Global Antidiabetic Drugs Market Outlook, 2025-2035
- 11.1 Market Size and Analysis
- 11.1.1 Revenue (Market Measurement: 2025: USD 116.65 billion → 2035: USD 228.14 billion)
- 11.1.2 Market Volume and Quantity Sold
- 11.1.3 Historical Market Size, 2018-2025
- 11.1.4 Base-Year Market Size, 2025
- 11.2 Market Forecast, 2025-2035
- 11.2.1 Revenue Forecast to 2035
- 11.2.2 Volume Forecast to 2035
- 11.2.3 CAGR and Year-on-Year Growth
- 11.2.4 Incremental Revenue Opportunity
- 11.3 Forecast Assumptions and Scenario Analysis
- 11.3.1 Base-Case Forecast
- 11.3.2 Optimistic and Conservative Scenarios
- 11.3.3 Technology, Pricing and Policy Sensitivities
- 11.4 Market Attractiveness and Growth Outlook
Chapter 12 Global Antidiabetic Drugs Market Segmentation and Outlook
- 12.1 Segmentation Summary and Market Shares, 2025
- 12.2 Largest and Fastest-Growing Segments
- 12.3 By Drug Class - Market Size and Forecast, 2025-2035
- 12.3.1 Segment Definition and Scope
- 12.3.2 Historical Market Size, 2018-2025
- 12.3.3 Revenue Forecast, 2025-2035
- 12.3.4 Volume Forecast, 2025-2035
- 12.3.5 Base-Year Market Share, 2025
- 12.3.6 Segment CAGR and Growth Drivers
- 12.3.7 Subsegment Market Size and Forecast
- 12.3.7.1 GLP-1 Receptor Agonists
- 12.3.7.2 Insulin
- 12.3.7.3 SGLT2 Inhibitors
- 12.3.7.4 DPP-4 Inhibitors
- 12.3.7.5 Others
- 12.3.8 Subsegment Pricing and Adoption Trends
- 12.3.9 Leading Suppliers and Competition
- 12.3.10 Regional Demand and Opportunities
- 12.4 By Type - Market Size and Forecast, 2025-2035
- 12.4.1 Segment Definition and Scope
- 12.4.2 Historical Market Size, 2018-2025
- 12.4.3 Revenue Forecast, 2025-2035
- 12.4.4 Volume Forecast, 2025-2035
- 12.4.5 Base-Year Market Share, 2025
- 12.4.6 Segment CAGR and Growth Drivers
- 12.4.7 Subsegment Market Size and Forecast
- 12.4.7.1 Type 2
- 12.4.7.2 Type 1
- 12.4.8 Subsegment Pricing and Adoption Trends
- 12.4.9 Leading Suppliers and Competition
- 12.4.10 Regional Demand and Opportunities
- 12.5 By Route of Administration - Market Size and Forecast, 2025-2035
- 12.5.1 Segment Definition and Scope
- 12.5.2 Historical Market Size, 2018-2025
- 12.5.3 Revenue Forecast, 2025-2035
- 12.5.4 Volume Forecast, 2025-2035
- 12.5.5 Base-Year Market Share, 2025
- 12.5.6 Segment CAGR and Growth Drivers
- 12.5.7 Subsegment Market Size and Forecast
- 12.5.7.1 Subcutaneous
- 12.5.7.2 Oral
- 12.5.8 Subsegment Pricing and Adoption Trends
- 12.5.9 Leading Suppliers and Competition
- 12.5.10 Regional Demand and Opportunities
- 12.6 Segment Growth Comparison
- 12.7 Segment Attractiveness and Priority Matrix
Chapter 13 Global Antidiabetic Drugs Geographic Market Outlook, 2025-2035
- 13.1 Regional Market Size and Share, 2025
- 13.2 Regional Market Forecast, 2025-2035
- 13.3 Regional Pricing, Production and Demand Differences
- 13.4 North America
- 13.4.1 United States
- 13.4.2 Canada
- 13.4.3 Mexico
- 13.5 Europe
- 13.5.1 Germany
- 13.5.2 France
- 13.5.3 Italy
- 13.5.4 United Kingdom
- 13.5.5 Spain
- 13.5.6 Poland
- 13.5.7 Russia
- 13.5.8 Netherlands
- 13.5.9 Belgium
- 13.5.10 Sweden
- 13.5.11 Denmark
- 13.5.12 Norway
- 13.5.13 Rest of Europe
- 13.6 Asia Pacific
- 13.6.1 China
- 13.6.2 India
- 13.6.3 Japan
- 13.6.4 South Korea
- 13.6.5 Thailand
- 13.6.6 Indonesia
- 13.6.7 Vietnam
- 13.6.8 Malaysia
- 13.6.9 Australia
- 13.6.10 Rest of Asia Pacific
- 13.7 Latin America
- 13.7.1 Brazil
- 13.7.2 Argentina
- 13.7.3 Colombia
- 13.7.4 Chile
- 13.7.5 Rest of Latin America
- 13.8 Middle East
- 13.8.1 Saudi Arabia
- 13.8.2 United Arab Emirates
- 13.8.3 Turkey
- 13.8.4 Israel
- 13.8.5 Iran
- 13.8.6 Rest of the Middle East
- 13.9 Africa
- 13.9.1 South Africa
- 13.9.2 Egypt
- 13.9.3 Nigeria
- 13.9.4 Morocco
- 13.9.5 Rest of Africa
- 13.10 Regional Investment, Policy and Supply Chain Differences
- 13.11 Regional Competitive Landscape
- 13.12 Geographic Growth Hotspots
Chapter 14 Global Antidiabetic Drugs Technology, Innovation and Sustainability Outlook
- 14.1 Technology Landscape and Maturity
- 14.2 Product, Process and Service Innovation
- 14.3 AI, Automation and Digital Tools in the Industry
- 14.4 Technology Adoption and Performance Benchmarking
- 14.5 Innovation Pipeline and R&D Investment
- 14.6 Patent and Intellectual Property Trends
- 14.7 Energy Efficiency and Resource Management
- 14.8 Sustainability, Recycling and Circularity
- 14.9 Technology Roadmap, 2025-2035
- 14.10 Risks of Obsolescence and Technology Substitution
Chapter 15 Global Antidiabetic Drugs Market Key Strategic Imperatives
- 15.1 Growth and Market Entry Priorities
- 15.2 High-Return Products and Segments
- 15.3 Pricing, Profitability and Cost Optimization
- 15.4 Technology Investment and Product Differentiation
- 15.5 Supply Chain Localization and Resilience
- 15.6 Distribution and Customer Acquisition
- 15.7 Partnership, Acquisition and Capacity Strategy
- 15.8 Regional Expansion Priorities
- 15.9 Short-, Medium- and Long-Term Actions
Chapter 16 Competition Outlook
- 16.1 Industry Competition Characteristics
- 16.2 Market Structure and Concentration
- 16.3 Market Share and Competitive Positioning, 2025
- 16.4 Company-Wise Revenue and Product Benchmarking
- 16.5 Production and Service Capacity Benchmarking
- 16.6 Technology, Pricing and Differentiation
- 16.7 Regional Footprint and Distribution Strength
- 16.8 Mergers, Acquisitions and Strategic Alliances
- 16.9 New Entrants and Competitive Threats
- 16.10 Porter's Five Forces and Industry Attractiveness
- 16.11 Competitive Outlook, 2025-2035
Chapter 17 Company Profiles
- 17.1 Company Coverage and Selection Criteria
- 17.2 Novo Nordisk
- 17.2.1 Business Description
- 17.2.2 Company Ownership and Geographic Presence
- 17.2.3 Product and Service Portfolio
- 17.2.4 Manufacturing and Operating Footprint
- 17.2.5 Production Capacity and Expansion Plans
- 17.2.6 Financial Performance and Investment
- 17.2.7 Market Share and Competitive Position
- 17.2.8 Technology and Innovation Capabilities
- 17.2.9 Strategic Alliances or Partnerships
- 17.2.10 Recent Developments
- 17.2.11 Growth Strategy and Outlook
- 17.3 Eli Lilly and Company
- 17.4 Sanofi
- 17.5 Merck & Co., Inc.
- 17.6 AstraZeneca plc
- 17.7 Johnson & Johnson Services Inc.
- 17.8 Novartis AG
- 17.9 Takeda Pharmaceutical Company
- 17.10 Bayer AG
- 17.11 USV Private Ltd
- 17.12 Sun Pharmaceutical Industries Ltd.
- 17.13 Other Relevant Market Participants
Note: Every listed company is profiled on the structure shown under the first company. The company list is preliminary and may change based on research findings, market developments, data availability and client requirements.
Chapter 18 Disclaimer
- 18.1 Research and Forecast Disclaimer
- 18.2 Data Source and Estimation Limitations
Note: The depth of individual sections depends on data availability for this market. Volume, capacity, trade and other unit-based metrics are included where applicable.

