Market Overview
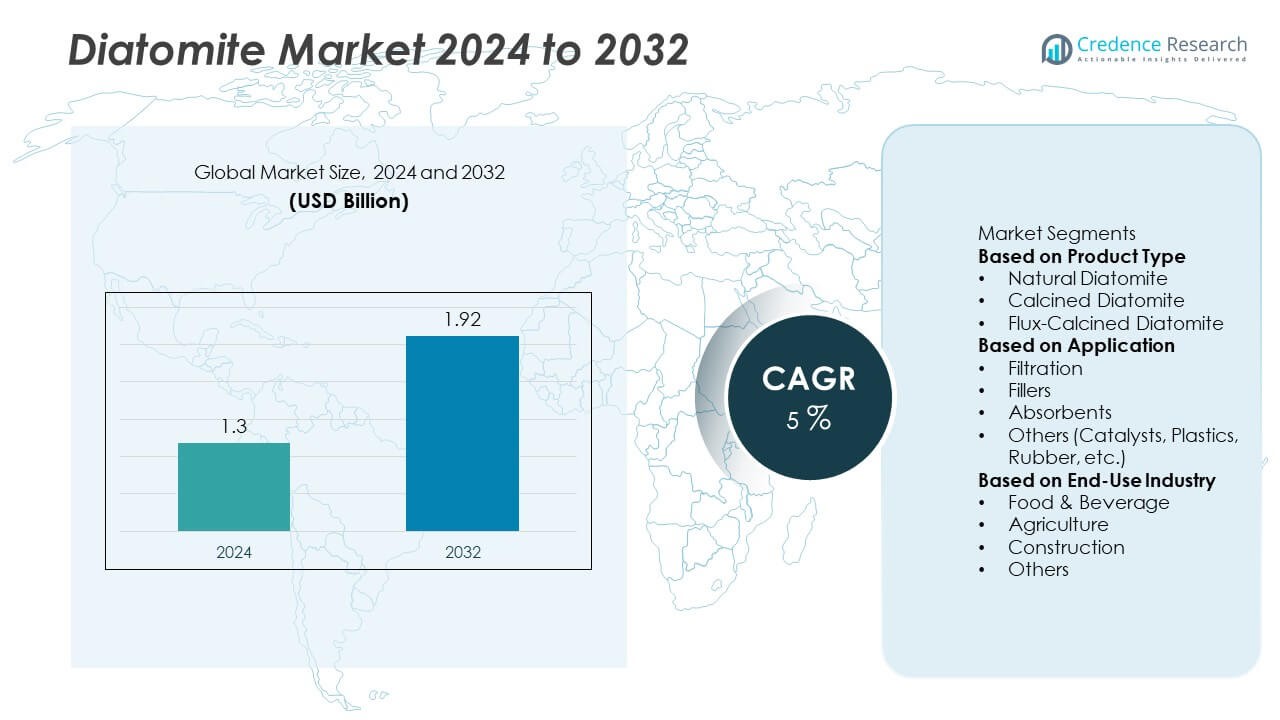
The Diatomite Market reached USD 1.3 billion in 2024 and is projected to hit USD 1.92 billion by 2032, growing at a CAGR of 5% during the forecast period.
| REPORT ATTRIBUTE |
DETAILS |
| Historical Period |
2020-2023 |
| Base Year |
2024 |
| Forecast Period |
2025-2032 |
| Diatomite Market Size 2024 |
USD 1.3 Billion |
| Diatomite Market, CAGR |
5% |
| Diatomite Market Size 2032 |
USD 1.92 Billion |
Top players in the Diatomite market include Imerys S.A., EP Minerals, Showa Chemical Industry Co., Ltd., Dicalite Management Group, Calgon Carbon Corporation, Chuanshan International, Jilin Yuantong Mineral Co., Ltd., Diatomite CJSC, Qingdao Best Chemical Co., Ltd., and Xuancheng Jingrui New Material Co., Ltd. These companies dominate through strong mining capabilities, advanced processing technologies, and diverse product portfolios serving filtration, construction, and agriculture. The market is led by North America with a 34% share, supported by large-scale industrial usage and established production sites. Asia Pacific follows closely with a 30% share, driven by expanding manufacturing and construction activities. Europe maintains steady demand with a 28% share, supported by strict environmental regulations and mature industrial applications.
Access crucial information at unmatched prices!
Request your sample report today & start making informed decisions powered by Credence Research Inc.!
Download Sample
Market Insights
- The Diatomite market reached USD 1.3 billion in 2024 and is projected to hit USD 1.92 billion by 2032 at a 5% CAGR, reflecting steady demand across filtration, construction, and agriculture.
- Demand grows as strong filtration needs drive adoption in beverages, pharmaceuticals, and wastewater treatment, with the filtration segment holding a 56% share due to high porosity and consistent performance.
- Market trends highlight a shift toward natural and eco-friendly materials, supported by rising use of diatomite in sustainable construction, organic farming, and high-purity industrial applications.
- Competitive intensity remains high as leading players enhance processing technologies and expand global supply capabilities, while substitutes such as perlite and activated carbon pose restraints in specific applications.
- Asia Pacific leads emerging demand with a 30% share, while North America holds 34% due to strong industrial usage; Europe follows with 28%, supported by strict quality and environmental standards that sustain adoption across key end-use industries.
Market Segmentation Analysis:
By Product Type
Natural diatomite led the market with a 48% share in 2024, supported by strong demand in filtration and construction applications. The product type offers high porosity and strong absorption, which drives use in food processing and water treatment. Calcined diatomite followed due to its higher purity and stability, making the grade suitable for paints and industrial fillers. Flux-calcined diatomite gained traction in high-temperature insulation and chemical processing. Growth in natural grade remained strong because industries prefer mineral-based, low-impact additives that support consistent performance and safe handling across large-volume industrial operations.
- For instance, Imerys is the world’s leading producer of diatomite for filtration, enabling consistent supply for multiple industrial applications. The company uses thermal calcination as a known process to improve purity and mechanical strength.
By Application
Filtration dominated the segment with a 56% share in 2024, driven by rising use in beverages, pharmaceuticals, and wastewater systems. Filtration media made from diatomite delivers strong particle retention and stable flow rates, supporting high-quality output. Fillers ranked second as manufacturers used the material to reduce weight and improve texture in paints, plastics, and rubber. Absorbents gained use in spill control and agriculture due to high porosity and moisture uptake. Growing interest in natural filtration materials helped the filtration segment maintain its clear lead.
- For instance, EP Minerals offers filtration-grade diatomite, such as its Celatom Filter White (FW) products, with a wide range of filtration capabilities that enable compliance with beverage clarity standards. The company operates a network of processing plants with kiln systems to produce consistent media properties.
By End-Use Industry
Food and beverage held the largest share of 41% in 2024, driven by strict filtration needs in brewing, edible oils, and beverage clarification. The industry relied on diatomite because the mineral supports consistent purity and smooth processing. Agriculture followed as the mineral was used in crop protection and soil conditioning. Construction gained steady demand due to use in lightweight aggregates, insulation, and cement additives. Other industries, including chemicals and pharmaceuticals, expanded adoption as diatomite offered strong stability, low density, and natural composition that supported cleaner production processes.
Key Growth Drivers
Rising Demand for Filtration-Grade Diatomite
Demand for strong filtration media drives market growth as industries seek reliable solutions for beverage processing, pharmaceuticals, and wastewater treatment. Diatomite’s porous structure supports efficient clarification and stable flow performance. Food and beverage processors rely on the mineral for consistent product quality. Regulatory pressure on water treatment enhances adoption. Investments in industrial filtration systems continue to strengthen long-term demand across major regions.
- For instance, Showa Chemical Industry in Japan operates diatomite filtration media plants, producing products that support precise filtration across various sectors.
Increasing Use in Construction and Insulation
Construction activity supports market expansion as diatomite becomes a preferred additive in cement, lightweight aggregates, and insulation materials. The mineral improves mechanical strength, reduces density, and enhances thermal resistance. Demand rises as builders prioritize energy-efficient structures. Infrastructure development across Asia Pacific accelerates adoption. Diatomite’s natural profile aligns well with sustainable building practices, supporting steady use in modern construction materials.
- For instance, Jilin Yuantong Mineral Co., Ltd. in China is a significant supplier of high-grade diatomite, possessing substantial reserves and claiming a major market share in China.
Expanding Applications in Agriculture
Agriculture drives strong demand as diatomite gains traction in soil improvement, crop protection, and moisture control. Farmers choose the mineral because it enhances soil structure and offers natural pest-management benefits. The shift toward sustainable farming boosts interest in chemical-free inputs. Adoption grows across emerging markets focused on yield improvement and soil health. Diatomite’s eco-friendly nature supports rising use in organic and regenerative agriculture.
Key Trends & Opportunities
Shift Toward Natural and Eco-Friendly Materials
Industries increasingly favor natural minerals that meet sustainability standards. Diatomite fits this trend due to its non-toxic, biodegradable, and low-impact properties. Food, agriculture, and filtration sectors adopt natural inputs to comply with regulatory expectations. This shift opens opportunities in green construction, organic farming, and clean-label food production. Rising awareness of environmental safety strengthens demand for diatomite across several sectors.
- For instance, Dicalite Management Group supplies natural diatomite for food and agricultural applications, with food-grade products achieving low crystalline silica levels below 1%, meeting global safety requirements.
Advancements in Diatomite Processing Technologies
Processing innovations enable higher-purity and specialized grades used in coatings, pharmaceuticals, and insulation. Modern calcination and purification technologies improve product quality and consistency. Automation in mining enhances yield and reduces waste, supporting cost efficiency. As industries seek engineered materials tailored for specific performance needs, producers benefit from differentiation and higher-value applications.
- For instance, certain companies modernize their mineral processing lines with high-frequency vibratory separators capable of achieving particle-size separation for fine particles.
Key Challenges
Environmental Regulations and Mining Constraints
Environmental regulations pose a major challenge because diatomite mining requires land clearance and controlled extraction. Governments enforce strict rules on land restoration, water use, and ecological protection. Compliance raises operational costs and limits new mining approvals. Producers must invest in sustainable extraction techniques to maintain supply stability. Limited availability of high-quality deposits adds pressure to optimize resource management.
Availability of Substitute Materials
Substitutes such as perlite, activated carbon, and synthetic additives challenge diatomite use in specific applications. These materials may offer competitive performance or cost advantages depending on industry needs. Some sectors test alternatives for high-purity filtration and specialty fillers. As substitutes gain attention, diatomite suppliers must improve product quality and application efficiency to preserve market share.
Regional Analysis
North America
North America held a 34% share in the Diatomite market in 2024, supported by strong demand from filtration, construction, and industrial processing. The region benefits from established mining operations in the United States, which ensure steady raw material availability. Food and beverage producers rely heavily on diatomite for clarification and purification processes, while wastewater treatment plants use the mineral for improved filtration efficiency. Growth in advanced insulation materials also strengthens demand. Regulatory support for clean water systems and industrial safety encourages broader adoption across key sectors, helping the region maintain a stable position.
Europe
Europe accounted for a 28% share of the global market in 2024, driven by mature demand in food processing, chemicals, and construction. Stringent environmental regulations encourage industries to adopt natural filtration and filler materials such as diatomite. Countries like Germany, France, and Spain remain major consumers due to advanced industrial networks. Growth in sustainable construction materials increases usage of diatomite-based additives and insulation products. Rising focus on water treatment and eco-friendly processing enhances market penetration. The region benefits from stable supply chains and strong technological capabilities across end-use sectors.
Asia Pacific
Asia Pacific led many fast-growing applications with a 30% share in 2024, supported by expanding manufacturing, agriculture, and construction activities. China remains the largest contributor due to high diatomite production and strong demand from paints, agriculture, and filtration. India and Southeast Asia adopt diatomite for crop protection, lightweight construction materials, and water purification. Industrial expansion and rising investment in infrastructure reinforce consumption across multiple sectors. Growing awareness of natural and sustainable inputs further accelerates demand. The region’s cost advantages and growing industrial base allow it to remain a key growth hub.
Latin America
Latin America represented a 5% share of the market in 2024, driven by moderate demand from agriculture, food processing, and mining industries. Countries such as Brazil, Mexico, and Chile adopt diatomite for soil improvement, crop protection, and filtration uses. Rising investment in water treatment facilities supports steady adoption. Growth in construction materials also contributes to demand for lightweight aggregates and insulation applications. Limited local production increases reliance on imports, influencing cost dynamics. However, expanding agricultural activities and interest in sustainable inputs continue to support regional growth prospects.
Middle East & Africa
The Middle East & Africa region held a 3% share in 2024, supported by rising demand in water treatment, agriculture, and construction. The region’s strong focus on improving water quality increases the use of diatomite-based filtration systems. Agriculture-driven markets in Africa adopt the mineral for soil conditioning and pest control. Urban development across Gulf nations boosts demand for insulation and cement additives. Limited production capacity results in higher import dependence, but growing industrial diversification and infrastructure investment continue to create opportunities for diatomite suppliers across key sectors.
Market Segmentations:
By Product Type
- Natural Diatomite
- Calcined Diatomite
- Flux-Calcined Diatomite
By Application
- Filtration
- Fillers
- Absorbents
- Others (Catalysts, Plastics, Rubber, etc.)
By End-Use Industry
- Food & Beverage
- Agriculture
- Construction
- Others
By Geography
- North America
- Europe
- Germany
- France
- U.K.
- Italy
- Spain
- Rest of Europe
- Asia Pacific
- China
- Japan
- India
- South Korea
- South-east Asia
- Rest of Asia Pacific
- Latin America
- Brazil
- Argentina
- Rest of Latin America
- Middle East & Africa
- GCC Countries
- South Africa
- Rest of the Middle East and Africa
Competitive Landscape
The competitive landscape in the Diatomite market features leading companies such as Imerys S.A., EP Minerals, Showa Chemical Industry Co., Ltd., Dicalite Management Group, Calgon Carbon Corporation, Chuanshan International, Jilin Yuantong Mineral Co., Ltd., Diatomite CJSC, Qingdao Best Chemical Co., Ltd., and Xuancheng Jingrui New Material Co., Ltd. These companies focus on expanding processing capabilities, improving product purity, and supplying specialized grades tailored for filtration, construction, and agriculture. Market leaders invest in advanced calcination and purification technologies to enhance efficiency and reduce impurities. Geographic expansion remains a key strategy as players strengthen distribution networks to serve fast-growing regions, especially in Asia Pacific and Latin America. Sustainability-driven mining practices and regulatory compliance shape long-term competitiveness. Companies also prioritize cost optimization, resource management, and partnerships with end-use industries to secure stable demand. Continuous innovation in engineered diatomite grades supports broader adoption across high-value industrial applications.
Key Player Analysis
- Imerys S.A.
- EP Minerals (a U.S. Silica Company)
- Showa Chemical Industry Co., Ltd.
- Jilin Yuantong Mineral Co., Ltd.
- Chuanshan International
- Diatomite CJSC
- Xuancheng Jingrui New Material Co., Ltd.
- Qingdao Best Chemical Co., Ltd.
- Dicalite Management Group
- Calgon Carbon Corporation
Recent Developments
- In January 2025, Imerys S.A. completed the acquisition of the European diatomite and perlite business of Chemviron (a subsidiary of Calgon Carbon Corporation), thereby extending its footprint in France and Italy.
- In May 2024, U.S. Silica Holdings, Inc. (parent of EP Minerals LLC) announced price increases for its diatomaceous earth and related industrial minerals.
- In June 2023, Dicalite Management Group announced a price increase across its diatomaceous earth product line for all shipments starting August 1, 2023.
Shape Your Report to Specific Countries or Regions & Enjoy 30% Off!
Report Coverage
The research report offers an in-depth analysis based on Product Type, Application, End-Use Industry and Geography. It details leading market players, providing an overview of their business, product offerings, investments, revenue streams, and key applications. Additionally, the report includes insights into the competitive environment, SWOT analysis, current market trends, as well as the primary drivers and constraints. Furthermore, it discusses various factors that have driven market expansion in recent years. The report also explores market dynamics, regulatory scenarios, and technological advancements that are shaping the industry. It assesses the impact of external factors and global economic changes on market growth. Lastly, it provides strategic recommendations for new entrants and established companies to navigate the complexities of the market.
Future Outlook
- Demand for high-performance filtration grades will rise as food, beverage, and pharmaceutical industries expand quality requirements.
- Adoption in construction materials will grow as developers seek lightweight and energy-efficient building solutions.
- Use in agriculture will increase as farmers shift toward natural soil enhancers and chemical-free pest control.
- Manufacturers will invest in advanced processing technologies to supply higher-purity and specialty diatomite grades.
- Sustainability regulations will push industries to replace synthetic additives with natural mineral alternatives.
- Water treatment infrastructure upgrades will drive stronger demand for diatomite-based filtration systems.
- Emerging markets will boost consumption as industrial activity and urbanization accelerate.
- Competition will intensify as suppliers focus on cost efficiency and product differentiation.
- Supply chain optimization will gain importance due to the limited availability of high-quality diatomite deposits.
- Partnerships between producers and end-use industries will expand to support application-specific product development.



