
Market Overview
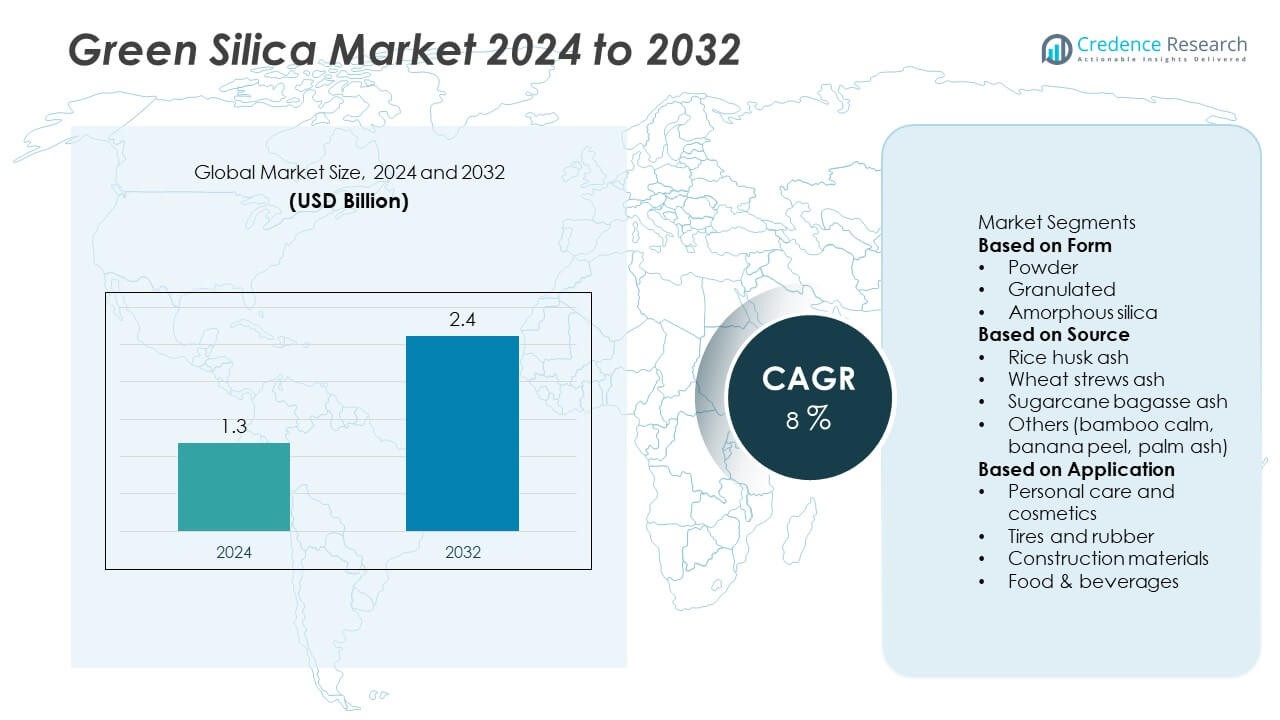
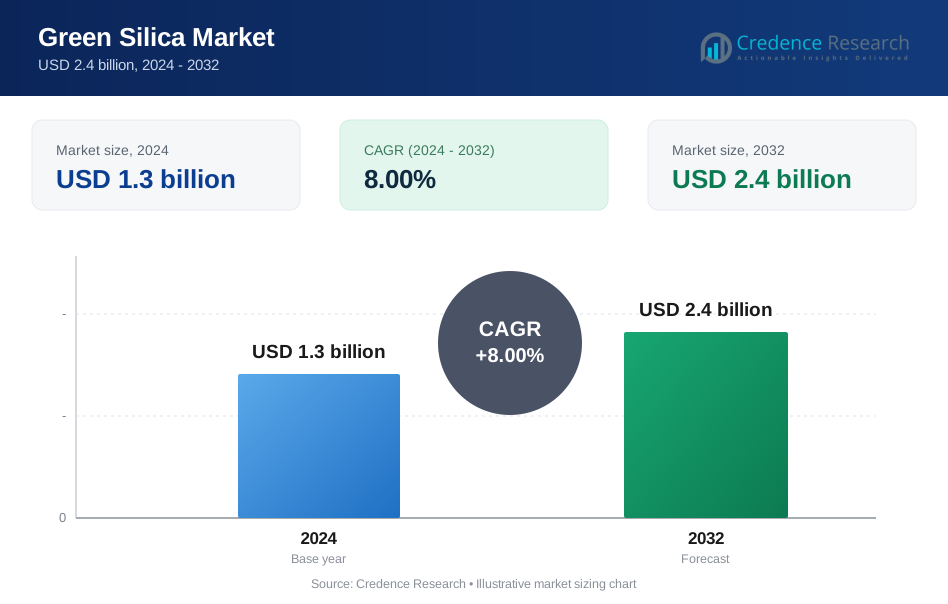
The Green Silica Market reached USD 1.3 billion in 2024 and is expected to grow to USD 2.4 billion by 2032, registering a strong 8% CAGR during the forecast period.
| REPORT ATTRIBUTE | DETAILS |
|---|---|
| Historical Period | 2020-2023 |
| Base Year | 2024 |
| Forecast Period | 2025-2032 |
| Green Silica Market Size 2024 | USD 1.3 Billion |
| Green Silica Market, CAGR | 8% |
| Green Silica Market Size 2032 | USD 2.4 Billion |
Top players in the Green Silica market include Green Vision Silica, Refratechnik, Brisil, Solvay, Palamatic PROCESS, Katyayani Organic, Evonik, Green Silica, Dow Corporate, and Biosilico. These companies strengthen their position through advanced biomass-based extraction technologies, high-purity product lines, and strong partnerships in automotive, cosmetics, and construction sectors. Asia Pacific leads the market with a 34% share, driven by abundant agricultural waste resources and expanding tire production. North America follows with a 32% share, supported by strong demand for sustainable materials and advanced R&D capabilities. Europe holds a 28% share, backed by strict environmental regulations and high adoption of bio-based industrial ingredients.
 Market Insights
- The Green Silica market reached USD 1.3 billion in 2024 and is projected to hit USD 2.4 billion by 2032 at an 8% CAGR, reflecting strong demand for sustainable, bio-based materials.
- Demand grows as the tires and rubber segment dominates with a 46% share, driven by the need for energy-efficient, low-rolling-resistance tires adopting green silica for better reinforcement and reduced emissions.
- Market trends highlight rising adoption of bio-based materials, advanced biomass-extraction technologies, and growing use in personal care, coatings, and green construction applications.
- Competitive activity intensifies as companies invest in high-purity product development and circular-economy processing while facing restraints from high production costs and biomass supply variability.
- Asia Pacific leads with a 34% share, followed by North America at 32% and Europe at 28%, supported by strong manufacturing bases, sustainability policies, and expanding applications across automotive, personal care, and construction sectors.
Market Segmentation Analysis:
By Form
Powder form led the Green Silica market with a 52% share in 2024, supported by strong adoption in personal care, coatings, and rubber reinforcement. The fine particle structure improves dispersion, stability, and absorption, making it suitable for cosmetics, adhesives, and specialty chemicals. Granulated silica followed due to rising use in construction additives and filtration media. Amorphous silica gained traction for high-purity applications but remained a smaller segment. The dominance of powder form comes from its compatibility with diverse industrial processes and its ability to meet performance and sustainability requirements across multiple sectors.
- For instance, Evonik commissioned a new plant for its innovative AEROSIL® Easy-to-Disperse (E2D) silicas at its Rheinfelden site in June 2024, an upgrade designed to improve processing efficiency, sustainability, and performance in paints and coatings.
By Source
Rice husk ash dominated the segment with a 58% share in 2024, driven by its high silica content, consistent quality, and strong availability in major agricultural regions. The material supports circular economy practices by converting biomass waste into high-value green silica. Wheat straw ash ranked second as industries adopt low-carbon alternatives for rubber, plastics, and fillers. Sugarcane bagasse ash also expanded due to its suitability for reinforced composites. Other sources, including bamboo and palm ash, contributed niche demand. Rice husk ash leads because it offers stable yield, low production cost, and reliable purity.
- For instance, Brisil's green silica unit in Gujarat processes approximately 18,250 tons of rice husk ash annually (50 tons daily) and extracts silica with a range of technical specifications, which can be customized to meet client requirements.
By Application
Tires and rubber held the largest share of 46% in 2024, supported by strong demand for sustainable reinforcement materials in fuel-efficient and low-rolling-resistance tires. Green silica enhances tensile strength, abrasion resistance, and energy efficiency, making it a preferred choice for automotive OEMs. Personal care and cosmetics followed as brands adopted bio-based silica for exfoliants, oil absorbers, and clean-label formulations. Construction materials gained steady demand from green concrete and lightweight composites. Food and beverage applications grew gradually through use in anticaking and clarifying agents. Tires and rubber remain dominant due to performance and sustainability advantages.
Key Growth Drivers
Rising Demand for Sustainable and Bio-Based Materials
Demand for eco-friendly materials drives strong growth as industries shift toward low-carbon inputs. Green silica produced from agricultural waste supports emission reduction and circular economy goals. Manufacturers in automotive, personal care, and construction adopt bio-based silica to replace conventional synthetic variants. Regulatory pressure to reduce carbon footprints strengthens this transition. Growing consumer preference for clean-label and sustainable products accelerates adoption across multiple end-use industries.
- For instance, Solvay advanced its bio-silica program by integrating a proprietary process that uses bio-based sodium silicate derived from rice husk ash to produce high-purity renewable silica.
Increasing Use in High-Performance Tire Manufacturing
The tire industry fuels major demand as manufacturers adopt green silica to improve rolling resistance, durability, and fuel efficiency. Green silica enhances grip and wear performance while supporting sustainability goals. Automotive OEMs increasingly require eco-friendly reinforcement materials to meet global emission standards. Expansion of electric vehicles further boosts use because green silica improves energy efficiency and battery range. Tire producers also benefit from stable sourcing of agricultural waste-derived silica.
- For instance, Pirelli has integrated bio-based silica derived from rice processing waste (rice husk ash) into its high-performance tire lines to improve wet grip and rolling resistance.
Expanding Applications in Personal Care and Cosmetics
Personal care brands drive strong adoption as green silica replaces microplastics in exfoliators, powders, and oil-absorbing formulations. The material offers safe, biodegradable performance and supports clean-label positioning. Regulatory restrictions on microbeads accelerate demand for plant-based alternatives. Green silica’s high absorption, smooth texture, and skin-friendly profile strengthen its use in premium cosmetic products. Innovation in bio-derived functional ingredients continues to widen opportunities in skincare and hygiene applications.
Key Trends & Opportunities
Shift Toward Circular Economy and Waste Valorization
A major trend involves transforming agricultural residues into high-value green silica. Industries adopt circular processing to reduce waste and minimize environmental impact. Rice husk ash, wheat straw ash, and bagasse ash emerge as reliable feedstocks, creating opportunities for large-scale biomass utilization. Governments support waste-to-resource technologies through sustainability policies. This trend strengthens supply stability, lowers production costs, and supports rapid expansion in developing markets with strong agricultural output.
- For instance, the general process of creating silica from rice husk ash is a known industrial application, and facilities can achieve high purity levels (up to 99.7%) and generate energy as a by product.
Advancements in Green Silica Extraction and Purification
Technological improvements create opportunities to deliver higher-purity, nano-structured, and application-specific silica. Advanced thermal treatment, controlled combustion, and chemical purification enhance consistency and performance. These innovations help green silica meet strict quality requirements for tires, electronics, cosmetics, and advanced composites. Improved efficiency also reduces energy use and processing cost, strengthening competitiveness against traditional silica. Companies adopting these technologies gain access to high-value industrial applications.
- For instance, Cabot Corporation operates multiple fumed silica manufacturing facilities globally, including in Barry, Wales, and Wuhai, China, to meet growing demand in applications such as silicones, paints/coatings, and adhesives/sealants.
Key Challenges
Limited Standardization and Quality Variability
Green silica faces quality variation due to differences in biomass sources, combustion methods, and processing conditions. Inconsistent purity and particle structure create challenges for industries requiring strict performance standards, such as tires and electronics. Lack of global standardization slows large-scale adoption. Manufacturers must invest in advanced purification and quality control systems to achieve stable output. This challenge increases operational cost and limits competitiveness in high-precision applications.
High Production Costs Compared to Conventional Silica
Production of green silica involves energy-intensive processing, controlled combustion, and chemical treatment, which raise costs compared to traditional silica. Limited large-scale facilities also restrict economies of scale. In some regions, sourcing consistent biomass ash adds logistical challenges. These cost barriers affect adoption in price-sensitive industries such as construction and packaging. Manufacturers must advance process efficiency and secure stable feedstock chains to close the cost gap with conventional silica.
Regional Analysis
North America
North America held a 32% share of the Green Silica market in 2024, supported by strong demand from tire manufacturing, personal care, and high-performance industrial applications. The region benefits from advanced R&D capabilities and growing adoption of bio-based materials driven by sustainability regulations. Automotive manufacturers increasingly use green silica to improve tire efficiency and reduce emissions. Rising consumer preference for natural cosmetic ingredients further strengthens market penetration. Investments in waste-to-resource technologies also support production growth. The United States leads consumption due to a well-established industrial base and rising focus on circular economy practices.
Europe
Europe accounted for a 28% share in 2024, driven by strict environmental regulations and strong adoption of sustainable materials across automotive, cosmetics, and construction industries. The region’s focus on decarbonization encourages manufacturers to replace conventional silica with low-carbon, biomass-derived alternatives. Germany, France, and the Netherlands remain major consumers due to advanced tire production and strong natural cosmetics demand. Green building initiatives also support use in eco-friendly concrete and coatings. Growing emphasis on circular economy policies enhances market growth, supported by well-developed recycling and agricultural waste utilization systems.
Asia Pacific
Asia Pacific led the Green Silica market with a 34% share in 2024, supported by expanding manufacturing capacity, abundant agricultural waste sources, and rapid industrialization. China dominates production due to large rice husk availability and strong tire manufacturing activity. India and Southeast Asia drive additional growth as industries adopt sustainable materials in automotive, construction, and personal care. Rising government focus on waste valorization boosts green silica output. Growing consumption of fuel-efficient tires and natural cosmetic products reinforces the region’s leadership. Strong cost advantages and a large industrial base position Asia Pacific as the fastest-growing regional market.
Latin America
Latin America represented a 4% share in 2024, influenced by moderate adoption across automotive, agriculture, and construction sectors. Brazil and Mexico lead consumption driven by growing interest in sustainable tire materials and green concrete applications. The region’s large agricultural output provides strong potential for rice husk and bagasse-based silica production, though commercial processing remains limited. Rising investment in natural personal care products supports incremental demand. Expanding infrastructure development creates new opportunities for green silica in eco-construction materials. Despite slower industrial adoption, sustainability awareness is steadily driving future growth prospects.
Middle East & Africa
The Middle East & Africa region held a 2% share in 2024, supported by emerging demand for sustainable construction materials and natural cosmetic ingredients. Gulf countries adopt green silica in high-performance coatings and concrete admixtures for large-scale infrastructure projects. African markets show potential due to abundant biomass waste suitable for silica extraction, though processing capacity remains limited. Rising interest in eco-friendly beauty products and energy-efficient building materials supports gradual market expansion. Government initiatives promoting circular economy practices and diversification of industrial sectors create future growth opportunities for green silica suppliers.
Market Segmentations:
By Form
- Powder
- Granulated
- Amorphous silica
By Source
- Rice husk ash
- Wheat strews ash
- Sugarcane bagasse ash
- Others (bamboo calm, banana peel, palm ash)
By Application
- Personal care and cosmetics
- Tires and rubber
- Construction materials
- Food & beverages
By Geography
- North America
- U.S.
- Canada
- Mexico
- Europe
- Germany
- France
- U.K.
- Italy
- Spain
- Rest of Europe
- Asia Pacific
- China
- Japan
- India
- South Korea
- South-east Asia
- Rest of Asia Pacific
- Latin America
- Brazil
- Argentina
- Rest of Latin America
- Middle East & Africa
- GCC Countries
- South Africa
- Rest of the Middle East and Africa
Competitive Landscape
The competitive landscape in the Green Silica market includes key players such as Green Vision Silica, Refratechnik, Brisil, Solvay, Palamatic PROCESS, Katyayani Organic, Evonik, Green Silica, Dow Corporate, and Biosilico. These companies compete by expanding production capabilities, enhancing purity levels, and improving processing technologies to supply high-performance green silica derived from agricultural waste. Leading manufacturers invest in advanced extraction and calcination systems to deliver consistent quality suitable for tires, personal care, coatings, and construction applications. Partnerships with automotive and cosmetics industries strengthen long-term demand as sustainability requirements rise globally. Companies also focus on circular economy models by sourcing biomass waste such as rice husk and bagasse to reduce environmental impact and production costs. New entrants emphasize localized sourcing and cost-efficient technologies, intensifying competition. Continuous product innovation and expansion into emerging markets help established brands maintain a strong competitive edge in the evolving green silica industry.
Key Player Analysis
- Green Vision Silica
- Refratechnik
- Brisil
- Solvay
- Palamatic PROCESS
- Katyayani Organic
- Evonik
- Green Silica
- Dow Corporate
- Biosilico
Recent Developments
- In September 2025, Solvay advanced its global circular silica strategy by announcing that the conversion of its Qingdao (China) and Gunsan (South Korea) production plants to use ISCC+ certified waste sand as a circular raw material would be operational from 2026 onwards
- In January 2025, Solvay signed an MoU with Hankook Tire to develop circular silica derived from bio- and waste-sourced raw materials for tires.
- In January 2025, Evonik formed a new business line “Smart Effects” by merging its Silica and Silanes units, focusing on sustainability, circular economy and innovation in green markets (e.g., green tires, electronics).
Report Coverage
The research report offers an in-depth analysis based on Form, Source, Application and Geography. It details leading market players, providing an overview of their business, product offerings, investments, revenue streams, and key applications. Additionally, the report includes insights into the competitive environment, SWOT analysis, current market trends, as well as the primary drivers and constraints. Furthermore, it discusses various factors that have driven market expansion in recent years. The report also explores market dynamics, regulatory scenarios, and technological advancements that are shaping the industry. It assesses the impact of external factors and global economic changes on market growth. Lastly, it provides strategic recommendations for new entrants and established companies to navigate the complexities of the market.
Future Outlook
- Demand for green silica will rise as tire manufacturers prioritize low-emission and energy-efficient materials.
- Adoption in personal care will grow as brands replace microplastics with biodegradable silica alternatives.
- Use in green construction materials will expand as builders shift to low-carbon concrete and coatings.
- Producers will invest in advanced extraction technologies to improve purity and reduce processing costs.
- Circular-economy initiatives will drive higher sourcing of agricultural waste for silica production.
- Electric vehicle growth will increase demand for high-performance silica in advanced rubber compounds.
- Emerging markets will show strong consumption due to rising industrialization and sustainability policies.
- Competition will intensify as new entrants focus on cost-efficient biomass processing solutions.
- Supply chain optimization will gain priority to manage variability in biomass quality and availability.
- Collaboration between manufacturers and automotive, cosmetic, and construction industries will support tailored product development.
Request a Free Sample
Fill in your details and we'll send you a free sample report.
- Sample data tables & charts
- Research methodology
Need a Custom Version of This Report?
Tailor the scope, geography, or segments to your exact requirements.
- Custom geography or segment scope
- Direct access to our analyst team
Frequently Asked Questions
What is the current market size for the Green Silica market, and what is its projected size in 2032?
At what Compound Annual Growth Rate is the Green Silica market projected to grow between 2025 and 2032?
Which Green Silica market segment held the largest share in 2024?
What are the primary factors fueling the growth of the Green Silica market?
Who are the leading companies in the Green Silica market?
Which region commanded the largest share of the Green Silica market in 2024?
Table of Content
Chapter 1. Report Introduction
- 1.1 Report Description & Purpose
- 1.1.1 Report Title & Market Definition
- 1.1.2 Unique Selling Propositions (USP) & Key Differentiators
- 1.1.3 Value Proposition for Stakeholders
- 1.2 Research Objectives
- 1.2.1 Market Sizing Objectives (Volume & Revenue)
- 1.2.2 Segmentation Objectives
- 1.2.3 Competitive Intelligence Objectives
- 1.2.4 Forecast & Scenario Objectives
- 1.3 Report Scope
- 1.3.1 Green Silica Scope – Types & Subtypes Covered
- 1.3.2 Geographic Scope – Regions & Countries Covered
- 1.3.3 Historical Period, Base Year & Forecast Period (2024; forecast to 2032)
- 1.3.4 Inclusions & Exclusions
- 1.4 HS Code & Classification Framework
- 1.5 Currency, Units & Pricing Basis
- 1.6 Target Stakeholders
- 1.7 Limitations & Assumptions
Chapter 2. Executive Summary
- 2.1 Global Green Silica Market Snapshot
- 2.1.1 Market Size – Historical (2024) & Forecast (2024-2032) (2024: USD 1.3 billion → 2032: USD 2.4 billion)
- 2.1.2 Volume & Revenue – Global Totals
- 2.1.3 Key Market Highlights – Top Five Facts
- 2.2 Green Silica Market Segmentation Snapshot
- 2.2.1 Market Split by Region – 2024 vs. 2032
- 2.3 Competitive Snapshot
- 2.3.1 Top 10 Players by Revenue Share – 2024
- 2.3.2 Top 10 Players by Volume Share – 2024
- 2.3.3 Recent Strategic Developments (18-Month Summary)
- 2.4 Key Investment Highlights & Strategic Conclusions
Chapter 3. Green Silica Market Dynamics & Industry Analysis
- 3.1 Market Overview & Context
- 3.1.1 Green Silica Market Position in the Broader Automotive Value Chain
- 3.1.2 OEM vs. Replacement Market Dynamics
- 3.1.3 Market Maturity & Development Stage by Region
- 3.2 Green Silica Market Drivers
- 3.3 Green Silica Market Restraints & Challenges
- 3.4 Green Silica Market Opportunities
- 3.5 Porter's Five Forces Analysis
- 3.5.1 Threat of New Entrants
- 3.5.2 Bargaining Power of Suppliers
- 3.5.3 Bargaining Power of Buyers
- 3.5.4 Threat of Substitutes
- 3.5.5 Competitive Rivalry – Intensity Assessment
- 3.6 Green Silica Value Chain Analysis
- 3.6.1 Upstream – Raw Material/Input Suppliers
- 3.6.1.1 Raw Material/Input 1
- 3.6.1.2 Raw Material/Input 2
- 3.6.1.3 Raw Material/Input 3
- 3.6.2 Midstream – Production/Manufacturing/Service Delivery
- 3.6.2.1 Production/Process Overview
- 3.6.2.2 Key Facility Locations & Capacity by Manufacturer
- 3.6.3 Downstream – Distribution & End Consumer
- 3.6.3.1 Primary Channel – B2B/OEM
- 3.6.3.2 Secondary Channels – Dealer, Retail, Online, Direct
- 3.6.4 Value Chain Profitability Analysis
- 3.6.1 Upstream – Raw Material/Input Suppliers
- 3.7 PESTEL Analysis
- 3.7.1 Political Factors
- 3.7.2 Economic Factors
- 3.7.3 Social Factors
- 3.7.4 Technological Factors
- 3.7.5 Environmental Factors
- 3.7.6 Legal Factors
- 3.8 Green Silica Supply Chain Analysis
- 3.8.1 Raw Material/Input Supply Risk Assessment
- 3.8.2 Manufacturing Concentration Risk (Geographic Exposure)
- 3.8.3 Trade Disruption Impact Analysis
- 3.9 Regulatory & Policy Landscape
Note: The regulatory and policy landscape section covers regulations based on their applicability to the market, Green Silica category, geography, and scope of the study. Only regulatory frameworks with a material impact on operations, compliance, trade, sustainability, or market access are analyzed in detail.
Chapter 4. Key Investment Pockets & Opportunity Analysis
- 4.1 Green Silica Market Attractiveness Analysis
- 4.1.1 By Region – Investment Attractiveness Matrix (Volume × CAGR)
- 4.2 Absolute Revenue Growth Opportunity
- 4.2.1 By Region – Absolute USD Growth Through 2032
- 4.3 Incremental Volume Opportunity
- 4.3.1 By Region – Incremental Volume Through 2032
- 4.3.2 Segment – Incremental Volume
- 4.4 Emerging Submarket Opportunity Deep Dive (Subject to Applicability)
- 4.5 Emerging Market Opportunity Scorecards
- 4.5.1 United States
- 4.5.2 Europe
- 4.5.3 Asia
- 4.5.4 Middle East & Africa
Note: Emerging Market Opportunity Scorecards will be included based on relevance and strategic importance. Regions listed are indicative and may vary depending on data availability and market dynamics.
Chapter 5. Green Silica Import-Export Analysis & Trade Flows
- 5.1 Global Trade Overview
- 5.1.1 Global Export Value by Country (2024)
- 5.1.2 Global Export Volume by Country (2024)
- 5.1.3 Global Import Value by Country (2024)
- 5.1.4 Global Import Volume by Country (2024)
- 5.1.5 Net Trade Balance by Country (2024)
- 5.2 Export Analysis – Segment
- 5.2.1 Type 1 (HS Code)
- 5.2.2 Type 2 (HS Code)
- 5.2.3 Type 3 (HS Code)
- 5.2.4 Type 4 (HS Code)
- 5.2.5 Type 5 (HS Code)
- 5.3 Import Analysis – Segment
- 5.3.1 Type 1 (HS Code)
- 5.3.2 Type 2 (HS Code)
- 5.3.3 Type 3 (HS Code)
- 5.3.4 Type 4 (HS Code)
- 5.3.5 Type 5 (HS Code)
- 5.4 Average Unit Trade Prices
- 5.4.1 Average Export Price – Segment & Country
- 5.4.2 Average Import Price – Segment & Source Country
- 5.4.3 Price Trends (2024)
- 5.5 Key Trade Route Analysis
- 5.5.1 Trade Route 1
- 5.5.2 Trade Route 2
- 5.5.3 Trade Route 3
- 5.5.4 Trade Route 4
- 5.5.5 Trade Route 5
- 5.6 Trade Policy Impact Assessment
- 5.6.1 US Anti-Dumping & Section 301 Tariffs
- 5.6.2 EU Customs Union Impact
- 5.6.3 Major Free Trade Agreements
- 5.6.4 USMCA Rules of Origin
Note: Trade policy analysis will be included only where relevant to the Green Silica market.
Chapter 6. Competitive Landscape & Company Benchmarking
- 6.1 Green Silica Market Concentration & Structure
- 6.1.1 Herfindahl-Hirschman Index (HHI) – vs. 2024
- 6.1.2 Tier 1, Tier 2 & Tier 3 Market Structure
- 6.1.3 Global, Regional & Local Player Dynamics
- 6.2 Green Silica Market Share Analysis – 2024
- 6.2.1 Global Revenue Share by Company
- 6.2.2 Global Volume Share by Company
- 6.2.3 Regional Revenue Share
- 6.2.4 Market Share Evolution ( vs. 2024)
- 6.2.5 OEM Segment Share by Company
- 6.2.6 Replacement Segment Share by Company
- 6.3 Production/Delivery Capacity & Facility Analysis
- 6.3.1 Global Installed Capacity
- 6.3.2 Capacity Utilization Rates
- 6.3.3 Production/Output Volume
- 6.3.4 Facility Locations & Capacity Map
- 6.3.5 Planned Capacity Additions
- 6.4 Green Silica Competitive Benchmarking Matrix
- 6.4.1 Revenue, Volume, CAGR & Profitability Comparison
- 6.4.2 Channel Revenue Mix
- 6.4.3 Geographic Revenue Exposure
- 6.4.4 R&D Intensity
- 6.4.5 Sustainability Maturity
- 6.5 Strategic Developments in Green Silica (Last 24 Months)
- 6.5.1 Mergers, Acquisitions & Divestments
- 6.5.2 New Green Silica Launches
- 6.5.3 Facility Expansions
- 6.5.4 Strategic Alliances, Joint Ventures & Partnerships
- 6.5.5 Distribution Expansion & Market Entry
- 6.5.6 Sustainability & ESG Initiatives
- 6.6 Competitive Strategy Mapping
- 6.6.1 Leader, Challenger, Follower & Niche Classification
- 6.6.2 Pricing Strategy Comparison
- 6.6.3 Channel Strategy Matrix
Note: Strategic developments are included based on their materiality and the availability of reliable information.
Chapter 7. Global Green Silica Market – By Distribution Channel
- 7.1 Segment Overview
- 7.1.1 Volume & Revenue Split by Channel (2024 & 2032)
- 7.1.2 Channel Mix Evolution (2024-2032)
Chapter 8. Regional Market Analysis – Global Overview
- 8.1 Global Regional Overview
- 8.1.1 Regional Volume Share
- 8.1.2 Regional Revenue Share
- 8.1.3 Regional Volume by Region
- 8.1.4 Regional Revenue by Region
- 8.1.5 Regional Forecast Through 2032
- 8.2 Cross-Regional Segment Analysis
- 8.2.1 By Distribution Channel
- 8.2.2 By Brand/Price Tier
Chapter 9. North America Green Silica Market
- 9.1 United States
- 9.2 Canada
- 9.3 Mexico
Chapter 10. Europe Green Silica Market
- 10.1 Germany
- 10.2 France
- 10.3 Italy
- 10.4 United Kingdom
- 10.5 Spain
- 10.6 Poland
- 10.7 Russia
- 10.8 Netherlands
- 10.9 Belgium
- 10.10 Sweden
- 10.11 Denmark
- 10.12 Norway
- 10.13 Rest of Europe
Chapter 11. Asia Pacific Green Silica Market
- 11.1 China
- 11.2 India
- 11.3 Japan
- 11.4 South Korea
- 11.5 Thailand
- 11.6 Indonesia
- 11.7 Vietnam
- 11.8 Malaysia
- 11.9 Australia
- 11.10 Rest of Asia Pacific
Chapter 12. Latin America Green Silica Market
- 12.1 Brazil
- 12.2 Argentina
- 12.3 Colombia
- 12.4 Chile
- 12.5 Rest of Latin America
Chapter 13. Middle East Green Silica Market
- 13.1 Saudi Arabia
- 13.2 United Arab Emirates
- 13.3 Turkey
- 13.4 Israel
- 13.5 Iran
- 13.6 Rest of the Middle East
Chapter 14. Africa Green Silica Market
- 14.1 South Africa
- 14.2 Egypt
- 14.3 Nigeria
- 14.4 Morocco
- 14.5 Rest of Africa
Chapter 15. Green Silica Company Profiles
- 15.1 [Company 01]
- 15.1.1 Company Overview
- 15.1.2 Key Management Personnel
- 15.1.3 Products & Services Portfolio
- 15.1.4 Financial Performance
- 15.1.5 Key Market Focus & Geographic Presence
- 15.1.6 Recent Developments & Strategic Initiatives
Note: The company profile list is preliminary and may change based on research findings, market developments, data availability, and client requirements.
Chapter 16. Appendices
- Appendix A – List of Abbreviations & Acronyms
- Appendix B – Industry Classification Code Reference – Full Series
- Appendix C – Production & Capacity Data Tables
- Appendix D – End-Use & Demand Base Tables
- Appendix E – Consumption & Replacement Rate Assumptions
- Appendix F – ASP Reference Tables
- Appendix G – Manufacturing & Facility Database
- Appendix H – Import-Export Data Tables
- Appendix I – Regulatory Summary Tables
- Appendix J – Primary Research Participant List (Anonymized)
- Appendix K – Primary Research Questionnaire Framework
- Appendix L – Data Sources & Bibliography
- Appendix M – Market Size Divergence & Source Comparison
Chapter 17. Research Methodology
- 17.1 Research Framework & Philosophy
- 17.2 Secondary Research – Sources, Hierarchy & Data Extraction
- 17.3 Data Modeling – Bottom-Up & Top-Down Market Sizing
- 17.4 Primary Research – Stakeholder Framework, LOI & Sample Sizes
- 17.5 Forecast Methodology – Regression, Scenario & Sensitivity Analysis
- 17.6 Quality Control – Four-Layer Validation Framework
- 17.7 Limitations & Standard Assumptions
- 17.8 Disclaimer
