
Market Overview
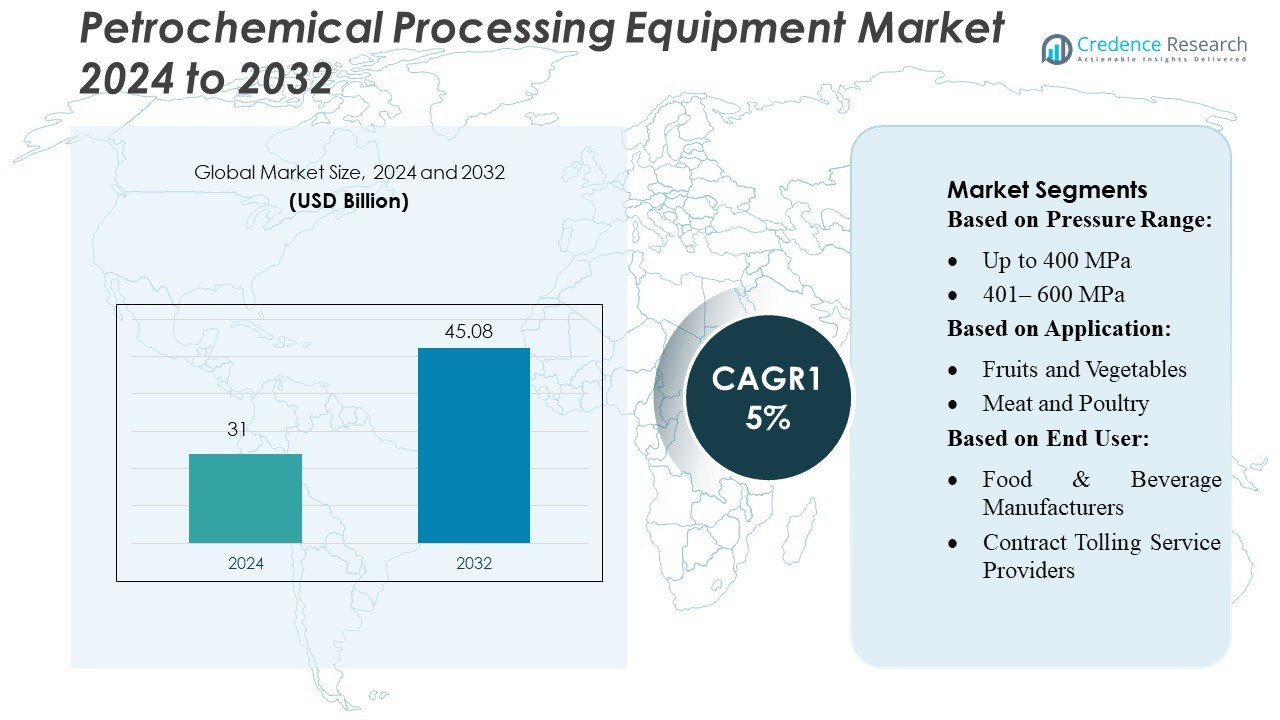
Petrochemical Processing Equipment Market size was valued USD 31 billion in 2024 and is anticipated to reach USD 45.08 billion by 2032, at a CAGR of 5% during the forecast period.
| REPORT ATTRIBUTE | DETAILS |
|---|---|
| Historical Period | 2020-2023 |
| Base Year | 2024 |
| Forecast Period | 2025-2032 |
| Petrochemical Processing Equipment Market Size 2024 | USD 31 Billion |
| Petrochemical Processing Equipment Market, CAGR | 5% |
| Petrochemical Processing Equipment Market Size 2032 | USD 45.08 Billion |
The Petrochemical Processing Equipment Market features strong competition as major global producers expand capacity and invest in advanced processing systems to improve efficiency and safety. Companies emphasize high-performance reactors, large cracking units, and automated separation technologies to support rising demand for polymers, intermediates, and specialty chemicals. Suppliers also integrate digital monitoring and predictive maintenance platforms to enhance plant reliability and reduce downtime. Asia-Pacific remains the leading region with 36% market share, driven by large-scale petrochemical investments, strong manufacturing growth, and continuous development of integrated refinery-petrochemical complexes that support sustained equipment procurement.
Market Insights
- The Petrochemical Processing Equipment Market was valued at USD 31 billion in 2024 and is projected to reach USD 45.08 billion by 2032, registering a 5% CAGR during the forecast period.
- Strong market growth is driven by rising investment in high-capacity cracking units, energy-efficient reactors, and automated separation systems to meet increasing global demand for polymers, intermediates, and specialty chemicals.
- Key trends include rapid adoption of digital monitoring, predictive maintenance, and IoT-enabled equipment, enabling producers to enhance operational reliability, reduce downtime, and optimize plant performance.
- Competitive intensity remains high as global players expand manufacturing footprints, upgrade processing technologies, and focus on integrated solutions; however, market restraints include high capital requirements and stringent regulatory standards that elevate installation and compliance costs.
- Asia-Pacific leads with 36% regional share, supported by large petrochemical facility expansions and integrated complex development, while large cracking units and separation systems account for the highest equipment segment share due to their essential role in high-volume processing.
Market Segmentation Analysis:
By Pressure Range
The Up to 400 MPa segment holds the largest share at 46%, driven by broad adoption in standard petrochemical compression tasks and lower operational cost. The 401–600 MPa range gains traction due to rising demand for mid-pressure reactors used in olefin and polymer processing. The Above 600 MPa segment expands steadily as refineries upgrade equipment to handle high-pressure synthesis for advanced petrochemical derivatives. Growing investment in capacity expansion and improved metallurgy supports performance across all pressure categories.
- For instance, CNPC has developed a high‑temperature/high‑pressure slim‑hole logging instrument capable of enduring 230 °C temperature and 170 MPa pressure, applied to a depth of 9,889.63 m in the “Shen Di Ta Ke 1” well project, thereby validating remote deep‑well drilling logging under extreme conditions.
By Application
Beverages lead this category with a 31% share, supported by strong use of high-pressure equipment in sterilization and shelf-life extension processing. Meat and poultry, seafood, and ready-to-eat meals show rising deployment due to stricter safety standards and demand for clean-label processing. Fruits and vegetables adopt advanced units for nutrient retention in processed batches. Dairy products increase adoption to maintain product stability. The others segment, including pet food, grows as manufacturers shift toward high-pressure treatment for pathogen reduction.
- For instance, Shell invests over 1 billion annually in R&D through its Shell Technology community of more than 3,300 experts. At its Pulau Bukom Refinery in Singapore, Shell deployed a digital‑twin integrated model covering up to 20 technology platforms, with an aim to improve productivity, reliability and safety by about 25 %.
By End User
Food and beverage manufacturers dominate with a 54% market share, driven by large-scale integration of high-pressure systems to improve product safety and production efficiency. Contract tolling service providers expand their share as brands outsource high-pressure processing to reduce capital costs. Research and academic institutions use advanced systems for testing process performance and product behavior. Pharmaceutical and biotech firms adopt high-pressure solutions for specialized extraction and material stabilization. The others category, including pet food producers, grows due to rising demand for premium, contamination-free formulations.
Key Growth Drivers
Rising Demand for High-Purity Petrochemicals
Global demand for high-purity petrochemicals continues to rise due to expanding use in packaging, automotive, electronics, and pharmaceutical sectors. Manufacturers invest in advanced distillation columns, catalytic reactors, and filtration units to improve product quality and meet strict purity standards. This shift pushes companies to upgrade legacy systems with precision control platforms and high-efficiency heat exchangers. The rise in specialty polymers and engineered materials further lifts demand for equipment that supports tighter process control, lower waste generation, and consistent product output across large-scale operations.
- For instance, CPChem recently completed an expansion of its low‑viscosity polyalphaolefins (PAO) production unit in Beringen, Belgium, doubling capacity to 120,000 metric tons per year, positioning it as the largest decene‑based LV PAO facility in Europe by volume.
Expansion of Refining and Petrochemical Integration
Integrated refinery-petrochemical complexes are increasing worldwide, driven by the need for improved fuel-to-chemicals conversion and higher operating efficiency. This integration boosts demand for reactors, compressors, separators, and modular process units designed for flexible throughput. Operators adopt advanced process automation, remote asset monitoring, and predictive maintenance systems to enhance plant uptime. New investments in the Middle East and Asia reshape the competitive landscape, encouraging suppliers to design equipment that supports multi-feedstock processing and higher energy recovery across integrated value chains.
- For instance, Dow implemented a digital manufacturing programme across 32 plants at its largest manufacturing site in less than one year, then expanded the connected‑worker solution to over 80 plants globally.
Shift Toward Energy-Efficient and Low-Emission Systems
Energy efficiency and emission reduction standards push producers to invest in modern equipment with lower energy use, reduced flaring, and better heat recovery. High-performance furnaces, low-NOx burners, and optimized cracking units support these goals. Companies deploy advanced digital twins and real-time optimization tools to reduce operational losses and improve safety compliance. Growing focus on decarbonizing petrochemical plants increases the demand for carbon capture-ready compressors, high-integrity pressure vessels, and cleaner process technologies that support long-term sustainability mandates.
Key Trends & Opportunities
Digitalization and Predictive Maintenance Adoption
Producers accelerate digital transformation through AI-driven monitoring systems, cloud-based analytics platforms, and smart sensors embedded across critical equipment. These tools provide early warnings of equipment degradation, reducing downtime and extending asset life. Predictive maintenance models help optimize spare-parts planning, improve plant reliability, and support safer operations. This trend also increases opportunities for vendors offering integrated automation suites, remote troubleshooting tools, and cybersecure industrial networks that enhance overall plant efficiency.
- For instance, ExxonMobil collects over 6 trillion individual data points from its refineries and chemical plants and stores them in a high‑performance computing “data lake” to enable real‑time analytics and predictive decision‑making.
Growth of Modular and Skid-Mounted Systems
Demand for modular and skid-mounted petrochemical equipment grows due to lower installation time, reduced capital cost, and simplified plant expansion. These systems support faster deployment in emerging regions with rising petrochemical production capacity. Modular designs enable flexible configuration, easy transport, and improved scalability for new process lines. Vendors benefit from opportunities to supply pre-engineered units for distillation, gas treatment, cracking, and blending applications, helping operators reduce project execution risks and construction delays.
- For instance, BASF completed its first fully modular chemical plant in China at the Caojing‑site in Shanghai - the plant comprised 10 prefabricated modules, achieved a pre‑fabrication rate of up to 90 %, and reached mechanical completion in just 10 months from board approval.
Increasing Investments in Specialty Chemicals
Rising demand for specialty chemicals drives adoption of high-precision processing units that support small-batch, high-value production. Markets such as electronics chemicals, performance additives, and advanced polymers need reactors, mixers, and filtration systems with tighter control of temperature, pressure, and impurity levels. This shift opens opportunities for suppliers offering advanced material-handling systems, corrosion-resistant alloys, and automated micro-processing platforms. Specialty chemical growth promotes a steady stream of capital investment in advanced petrochemical equipment.
Key Challenges
High Capital Costs and Long Payback Cycles
Petrochemical processing equipment requires significant capital expenditure, especially for high-pressure reactors, distillation systems, and large-scale compressors. Long project lead times and slow payback cycles reduce investment appetite, particularly in volatile market conditions. Fluctuating crude oil prices further complicate budgeting for equipment upgrades. Smaller companies struggle to justify large investments, limiting modernization projects without strong long-term demand assurance.
Operational Risks and Stringent Compliance Standards
Petrochemical plants face strict environmental, safety, and emission regulations, increasing the pressure on operators to maintain compliance. Complex equipment operates under extreme temperature and pressure conditions, raising risks of failure, leakage, or unplanned shutdowns. Ensuring regulatory compliance demands continuous monitoring, skilled workforce availability, and frequent maintenance. These factors increase operational burden and raise costs, especially for aging plants that require extensive retrofits and upgrades.
Regional Analysis
North America
North America holds 31% of the Petrochemical Processing Equipment Market, supported by strong refinery integration, high investment in shale-derived feedstocks, and rapid adoption of digitalized process systems. Producers upgrade cracking units, high-pressure reactors, and separation systems to improve output flexibility and energy efficiency. The U.S. drives most demand due to large Gulf Coast petrochemical clusters and continuous expansion of midstream infrastructure. Equipment suppliers benefit from strong compliance needs, which boost demand for advanced monitoring technologies, low-emission furnaces, and predictive maintenance platforms used across large petrochemical complexes.
Europe
Europe accounts for 24% of the market, driven by its transition toward energy-efficient petrochemical operations and investments in low-carbon process technologies. Regional producers replace older furnaces, compressors, and distillation units with cleaner and more automated systems to meet strict EU emission norms. Growth in specialty chemicals and performance materials further strengthens equipment demand. Germany, France, and the Netherlands lead adoption of digital control systems, modular units, and carbon-capture-ready equipment. Ongoing modernization across Western Europe supports stable equipment procurement despite tighter regulations and rising operational costs.
Asia-Pacific
Asia-Pacific dominates the market with 36%, supported by large-scale capacity additions, rising polymer consumption, and strong government-backed petrochemical expansion. China, India, South Korea, and Southeast Asia drive equipment demand for crackers, reactors, and advanced heat-recovery systems. Rapid industrialization and rising middle-class consumption boost investments in plastics, specialty chemicals, and synthetic materials. Regional plants adopt high-efficiency furnaces, corrosion-resistant vessels, and digital automation platforms to enhance productivity. APAC continues to attract new mega-projects, making it the fastest-growing regional market for petrochemical processing equipment.
Latin America
Latin America holds 5% of the market, influenced by targeted investments in petrochemical capacity, especially in Brazil and Mexico. Modernization of aging plants and expansion of natural gas-based petrochemical units support market activity. Demand grows for compressors, distillation systems, and process automation platforms that help operators improve reliability and lower energy consumption. Regional governments encourage foreign partnerships, which accelerate technology inflow and plant upgrades. Although market growth remains moderate due to economic volatility, ongoing infrastructure improvements sustain equipment procurement in key petrochemical hubs.
Middle East & Africa
The Middle East & Africa region captures 4% of the market, driven by large-scale petrochemical integration projects and abundant low-cost feedstocks. Saudi Arabia, the UAE, and Qatar lead investments in state-of-the-art crackers, high-capacity reactors, and advanced separation technologies. Regional producers prioritize energy-efficient systems and digital monitoring tools to enhance plant performance. Africa sees gradual expansion, mainly from gas-rich nations investing in downstream processing. Strong government support and joint ventures sustain demand, while new mega-complexes in the Middle East position the region as a long-term growth center for advanced petrochemical equipment.
Market Segmentations:
By Pressure Range:
- Up to 400 MPa
- 401– 600 MPa
By Application:
- Fruits and Vegetables
- Meat and Poultry
By End User:
- Food & Beverage Manufacturers
- Contract Tolling Service Providers
By Geography
- North America
- U.S.
- Canada
- Mexico
- Europe
- Germany
- France
- U.K.
- Italy
- Spain
- Rest of Europe
- Asia Pacific
- China
- Japan
- India
- South Korea
- South-east Asia
- Rest of Asia Pacific
- Latin America
- Brazil
- Argentina
- Rest of Latin America
- Middle East & Africa
- GCC Countries
- South Africa
- Rest of the Middle East and Africa
Competitive Landscape
The Petrochemical Processing Equipment Market players such as INEOS Group Ltd., China National Petroleum Corporation (CNPC), SABIC, Royal Dutch Shell PLC, Chevron Corporation, Dow, ExxonMobil Corporation, BASF SE, China Petrochemical Corporation, and LyondellBasell Industries Holdings B.V. The Petrochemical Processing Equipment Market global activity as leading petrochemical producers invest in advanced processing technologies to improve efficiency, reliability, and sustainability. Companies prioritize high-performance reactors, optimized cracking systems, and next-generation separation equipment to enhance throughput and reduce operating costs. Many market participants accelerate digital transformation by integrating automation, real-time monitoring, and predictive maintenance platforms across large-scale facilities. Strategic partnerships and long-term supply agreements help secure technology access and strengthen global presence. Continuous upgrades of aging plants, expansion of integrated refinery-petrochemical complexes, and rising focus on low-emission process systems further intensify competition across key regions.
Key Player Analysis
- INEOS Group Ltd.
- China National Petroleum Corporation (CNPC)
- SABIC
- Royal Dutch Shell PLC
- Chevron Corporation
- Dow
- ExxonMobil Corporation
- BASF SE
- China Petrochemical Corporation
- LyondellBasell Industries Holdings B.V.
Recent Developments
- In May 2025, the American University in Cairo (AUC) announced the launch of a new professional diploma in Process Safety Management (PSM) tailored for Egypt’s oil, gas, and petrochemical sectors, following the signing of a Memorandum of Understanding (MoU).
- In April 2025, China Petrochemical Corporation (Sinopec) launched the country's first cross-region hydrogen heavy-duty truck route, a 1,150-kilometer corridor connecting Chongqing, Guizhou, and Qinzhou Port in Guangxi. This initiative marks a significant milestone for hydrogen energy development in China, establishing regular freight services using hydrogen-powered trucks and supporting China's western regions.
- In March 2025, Hiperbaric achieved a significant milestone by installing its 400th high-pressure processing (HPP) system at Instinct Raw Pet Food's new facility in Nebraska. The installation of the Hiperbaric 525i model underscores the growing adoption of HPP technology in the pet food industry, reflecting the increasing demand for safe, minimally processed, and preservative-free products.
- In July 2023, SABIC introduced its latest PCR-based NORYL™ portfolio, a move aimed at enhancing sustainability within the chemical sector by incorporating bio-based and recycled materials into their products. This initiative specifically focuses on utilizing post-consumer recycled (PCR) content to reduce the overall carbon footprint associated with the materials.
Report Coverage
The research report offers an in-depth analysis based on Pressure Range, Application, End-User and Geography. It details leading market players, providing an overview of their business, product offerings, investments, revenue streams, and key applications. Additionally, the report includes insights into the competitive environment, SWOT analysis, current market trends, as well as the primary drivers and constraints. Furthermore, it discusses various factors that have driven market expansion in recent years. The report also explores market dynamics, regulatory scenarios, and technological advancements that are shaping the industry. It assesses the impact of external factors and global economic changes on market growth. Lastly, it provides strategic recommendations for new entrants and established companies to navigate the complexities of the market.
Future Outlook
- The market will see stronger adoption of energy-efficient reactors and cracking systems.
- Digital twins and predictive maintenance tools will gain wider use across plants.
- Modular and skid-mounted equipment will expand due to faster project deployment needs.
- Low-emission furnaces and cleaner processing units will become standard in new facilities.
- Integration of refinery and petrochemical operations will increase global equipment demand.
- Advanced separation technologies will support rising specialty chemical production.
- Automation and AI-based monitoring systems will drive higher plant reliability.
- Expansion of petrochemical capacity in Asia and the Middle East will accelerate equipment sales.
- Retrofitting of aging plants will rise as operators target stronger regulatory compliance.
- Carbon-capture-ready compressors and process units will gain traction in large complexes.

Request a Free Sample
Fill in your details and we'll send you a free sample report.
- Sample data tables & charts
- Research methodology
Market Dynamics
Expansion of Integrated Refinery-Petrochemical Complexes
The global trend toward integrating refining and petrochemical operations is driving demand for advanced processing equipment that can handle flexible feedstocks and improve fuel-to-chemicals conversion efficiency. This integration requires investment in high-performance reactors, compressors, and modular process units.
Adoption of Digitalization and Predictive Maintenance
Producers are rapidly implementing AI-driven monitoring, cloud analytics, and IoT-enabled equipment to enhance operational reliability, reduce downtime, and optimize plant performance. This digital transformation increases demand for smart, automated processing equipment.
Shift Toward Energy-Efficient and Low-Emission Systems
Stricter environmental regulations and sustainability goals are pushing companies to invest in energy-efficient reactors, low-NOx burners, and carbon-capture-ready compressors. These upgrades support compliance and reduce operational costs, fueling equipment market growth.
Rising Demand for High-Purity and Specialty Petrochemicals
Growth in packaging, automotive, electronics, and pharmaceuticals is increasing the need for high-purity and specialty chemicals, which require advanced distillation, filtration, and reactor systems. This trend drives continuous upgrades and new installations of precision processing equipment.
Growth of Modular and Skid-Mounted Equipment
The need for faster project deployment and lower capital costs is boosting demand for modular and skid-mounted petrochemical equipment. These systems enable flexible, scalable plant expansions and reduce construction risks, especially in emerging markets.
Need a Custom Version of This Report?
Tailor the scope, geography, or segments to your exact requirements.
- Custom geography or segment scope
- Direct access to our analyst team
Frequently Asked Questions
What is the current market size for the Petrochemical Processing Equipment Market, and what is its projected size in 2032?
At what Compound Annual Growth Rate is the Petrochemical Processing Equipment Market projected to grow between 2025 and 2032?
Which Petrochemical Processing Equipment Market segment held the largest share in 2024?
What are the primary factors fueling the growth of the Petrochemical Processing Equipment Market?
Who are the leading companies in the Petrochemical Processing Equipment Market?
Which region commanded the largest share of the Petrochemical Processing Equipment Market in 2024?
Table of Content
Chapter 1 Market Segmentation
- 1.1 Segmentation Framework
- 1.1.1 Product and Service Classification
- 1.1.2 Application and End-Use Classification
- 1.1.3 Technology and Solution Classification
- 1.1.4 Customer and Distribution Channel Classification
- 1.1.5 Geographic Segmentation
- 1.1.6 Market Segment Definitions and Boundaries
- 1.2 By End User
- 1.2.1 Food & Beverage Manufacturers
- 1.2.2 Contract Tolling Service Providers
- 1.2.3 Research and Academic Institutions
- 1.2.4 Pharmaceutical and Biotech Firms
- 1.2.5 Others (including Pet Food Producers)
- 1.3 By Application
- 1.3.1 Fruits and Vegetables
- 1.3.2 Meat and Poultry
- 1.3.3 Seafood
- 1.3.4 Ready-to-Eat Meals
- 1.3.5 Dairy Products
- 1.3.6 Others (including Pet Food)
- 1.4 By Pressure Range
- 1.4.1 Up to 400 MPa
- 1.4.2 401–600 MPa
- 1.4.3 Above 600 MPa
Chapter 2 Introduction
- 2.1 Report Objectives and Scope
- 2.2 Product Definition and Industry Terminology
- 2.3 Market Inclusions and Exclusions
- 2.4 Research Process
- 2.4.1 Primary Research and Expert Interviews
- 2.4.2 Secondary Research and Source Review
- 2.4.3 Top-Down and Bottom-Up Estimation
- 2.4.4 Data Triangulation and Verification
- 2.5 Market Size Measurement Basis
- 2.5.1 2024: USD 31 billion → 2032: USD 45.08 billion
- 2.6 Historical and Forecast Reference Periods
- 2.6.1 Base Year: 2024
- 2.6.2 Forecast Period: 2024-2032
- 2.7 Research Assumptions and Limitations
Chapter 3 Executive Summary
- 3.1 Market Snapshot and Key Findings
- 3.2 Base-Year Market Size, 2024
- 3.3 Forecast Market Size, 2032
- 3.4 Revenue and Volume Growth Outlook
- 3.5 Key Demand and Supply Indicators
- 3.6 Leading Market Segments
- 3.7 Fastest-Growing Market Opportunities
- 3.8 Regional Performance Highlights
- 3.9 Technology and Industry Transformation
- 3.10 Competitive Landscape Summary
- 3.11 Analyst View and Strategic Implications
Chapter 4 Global Petrochemical Processing Equipment Market Trends and Developments
- 4.1 Historical Industry Development
- 4.2 Recent Market Trends and Developments
- 4.3 Demand and Customer Behavior Trends
- 4.4 Technology and Product Innovation
- 4.5 Artificial Intelligence, Automation and Digitalization
- 4.6 Local Manufacturing and Supply Chain Realignment
- 4.7 Industry Partnerships, Mergers and Acquisitions
- 4.8 Sustainability and Circular Economy Developments
- 4.9 Government and Private Sector Investment Trends
- 4.10 Emerging Business Models and Commercialization
- 4.11 Industry Developments and Announcements
Chapter 5 Global Petrochemical Processing Equipment Market Production, Supply and Demand Analysis
- 5.1 Demand Trend and Consumption Analysis
- 5.2 Demand Forecast, 2024-2032
- 5.3 Production and Output Trend
- 5.4 Production and Output Forecast, 2024-2032
- 5.5 Installed Capacity and Capacity Utilization
- 5.6 Company-Wise Production Plants and Statistics
- 5.6.1 Installed Production Capacity
- 5.6.2 Actual Production
- 5.6.3 Planned Capacity and Expansion Targets
- 5.7 Supply Chain Structure and Procurement Trends
- 5.8 Supply-Demand Gap and Bottlenecks
- 5.9 Import Dependence and Sourcing Structure
- 5.10 Contract Manufacturing and Outsourcing
- 5.11 Regional Supply and Demand Concentration
Chapter 6 Global Petrochemical Processing Equipment Market Pricing Analysis
- 6.1 Pricing Structure and Measurement
- 6.2 Historical Pricing Trends
- 6.3 Pricing Outlook, 2024-2032
- 6.4 Average Selling Price and Unit Economics
- 6.5 Pricing by Product and Market Segment
- 6.6 Geographic Pricing Differences
- 6.7 Key Input, Energy, Labor and Logistics Costs
- 6.8 Contract Pricing and Purchasing Models
- 6.9 Pricing Sensitivity and Competitive Positioning
- 6.10 Price, Margin and Profitability Implications
Chapter 7 Global Petrochemical Processing Equipment Market Dynamics
- 7.1 Market Growth Drivers
- 7.1.1 Demand-Side Drivers
- 7.1.2 Technology and Innovation Drivers
- 7.1.3 Infrastructure and Investment Drivers
- 7.1.4 Regulatory and Policy Drivers
- 7.2 Market Restraints
- 7.2.1 Cost and Affordability Constraints
- 7.2.2 Technology and Adoption Barriers
- 7.2.3 Supply Chain and Operational Constraints
- 7.3 Market Challenges
- 7.3.1 Competitive Pressure and Margin Erosion
- 7.3.2 Skills, Infrastructure and Implementation Gaps
- 7.4 Emerging Market Opportunities
- 7.5 Market Dynamics Impact and Time-Horizon Assessment
Chapter 8 Global Petrochemical Processing Equipment Value Chain Analysis
- 8.1 Industry Value Chain Overview
- 8.2 Upstream Suppliers and Critical Inputs
- 8.3 Technology and Component Providers
- 8.4 Manufacturing or Service Delivery
- 8.5 Distribution, Channel Partners and Integrators
- 8.6 Downstream Applications and End Users
- 8.7 Value Addition and Profit Pools
- 8.8 Vertical Integration and Outsourcing
- 8.9 Supplier Concentration and Risk
- 8.10 Supply Chain Localization and Resilience
Chapter 9 Global Petrochemical Processing Equipment Market Regulations and Policies
- 9.1 Relevant Laws, Standards and Compliance Frameworks
- 9.2 Product, Service, Safety and Quality Requirements
- 9.3 Government Policies, Incentives and Subsidies
- 9.4 Imports, Exports and Trade Barriers
- 9.5 Public Procurement and Local Content Requirements
- 9.6 Environmental and Sustainability Compliance
- 9.7 Upcoming Policy Changes and Market Implications
Chapter 10 Global Petrochemical Processing Equipment Market Hotspots and Opportunities
- 10.1 Market Opportunity Mapping and Growth Hotspots
- 10.2 High-Growth Applications and Customer Groups
- 10.3 Underserved Markets and White-Space Opportunities
- 10.4 Emerging Technology and Product Opportunities
- 10.5 New Capacity and Investment Hotspots
- 10.6 Market Entry and Expansion Opportunities
- 10.7 Distribution and Partnership Opportunities
- 10.8 Near-Term and Long-Term Commercial Potential
- 10.9 Opportunity Attractiveness and Execution Risks
Chapter 11 Global Petrochemical Processing Equipment Market Outlook, 2024-2032
- 11.1 Market Size and Analysis
- 11.1.1 Revenue (Market Measurement: 2024: USD 31 billion → 2032: USD 45.08 billion)
- 11.1.2 Market Volume and Quantity Sold
- 11.1.3 Historical Market Size
- 11.1.4 Base-Year Market Size, 2024
- 11.2 Market Forecast, 2024-2032
- 11.2.1 Revenue Forecast to 2032
- 11.2.2 Volume Forecast to 2032
- 11.2.3 CAGR and Year-on-Year Growth
- 11.2.4 Incremental Revenue Opportunity
- 11.3 Forecast Assumptions and Scenario Analysis
- 11.3.1 Base-Case Forecast
- 11.3.2 Optimistic and Conservative Scenarios
- 11.3.3 Technology, Pricing and Policy Sensitivities
- 11.4 Market Attractiveness and Growth Outlook
Chapter 12 Global Petrochemical Processing Equipment Market Segmentation and Outlook
- 12.1 Segmentation Summary and Market Shares, 2024
- 12.2 Largest and Fastest-Growing Segments
- 12.3 By End User - Market Size and Forecast, 2024-2032
- 12.3.1 Segment Definition and Scope
- 12.3.2 Historical Market Size
- 12.3.3 Revenue Forecast, 2024-2032
- 12.3.4 Volume Forecast, 2024-2032
- 12.3.5 Base-Year Market Share, 2024
- 12.3.6 Segment CAGR and Growth Drivers
- 12.3.7 Subsegment Market Size and Forecast
- 12.3.7.1 Food & Beverage Manufacturers
- 12.3.7.2 Contract Tolling Service Providers
- 12.3.7.3 Research and Academic Institutions
- 12.3.7.4 Pharmaceutical and Biotech Firms
- 12.3.7.5 Others (including Pet Food Producers)
- 12.3.8 Subsegment Pricing and Adoption Trends
- 12.3.9 Leading Suppliers and Competition
- 12.3.10 Regional Demand and Opportunities
- 12.4 By Application - Market Size and Forecast, 2024-2032
- 12.4.1 Segment Definition and Scope
- 12.4.2 Historical Market Size
- 12.4.3 Revenue Forecast, 2024-2032
- 12.4.4 Volume Forecast, 2024-2032
- 12.4.5 Base-Year Market Share, 2024
- 12.4.6 Segment CAGR and Growth Drivers
- 12.4.7 Subsegment Market Size and Forecast
- 12.4.7.1 Fruits and Vegetables
- 12.4.7.2 Meat and Poultry
- 12.4.7.3 Seafood
- 12.4.7.4 Ready-to-Eat Meals
- 12.4.7.5 Dairy Products
- 12.4.7.6 Others (including Pet Food)
- 12.4.8 Subsegment Pricing and Adoption Trends
- 12.4.9 Leading Suppliers and Competition
- 12.4.10 Regional Demand and Opportunities
- 12.5 By Pressure Range - Market Size and Forecast, 2024-2032
- 12.5.1 Segment Definition and Scope
- 12.5.2 Historical Market Size
- 12.5.3 Revenue Forecast, 2024-2032
- 12.5.4 Volume Forecast, 2024-2032
- 12.5.5 Base-Year Market Share, 2024
- 12.5.6 Segment CAGR and Growth Drivers
- 12.5.7 Subsegment Market Size and Forecast
- 12.5.7.1 Up to 400 MPa
- 12.5.7.2 401–600 MPa
- 12.5.7.3 Above 600 MPa
- 12.5.8 Subsegment Pricing and Adoption Trends
- 12.5.9 Leading Suppliers and Competition
- 12.5.10 Regional Demand and Opportunities
- 12.6 Segment Growth Comparison
- 12.7 Segment Attractiveness and Priority Matrix
Chapter 13 Global Petrochemical Processing Equipment End-Use and Application Market Outlook
- 13.1 End-Use Industry and Customer Demand Structure
- 13.2 Leading Applications and Customer Groups
- 13.3 End-Use Market Size, Share and Forecast
- 13.4 Major End-Use Industry Deep Dives
- 13.4.1 Customer Requirements and Use Cases
- 13.4.2 Demand and Replacement Cycles
- 13.4.3 Technical and Regulatory Considerations
- 13.4.4 Purchasing and Procurement Models
- 13.4.5 Leading Vendors and Distribution Channels
- 13.4.6 Forecast and Commercial Opportunities
- 13.5 Emerging Applications and Cross-Segment Demand
- 13.6 End-Use Industry Investment Priorities
Chapter 14 Global Petrochemical Processing Equipment Geographic Market Outlook, 2024-2032
- 14.1 Regional Market Size and Share, 2024
- 14.2 Regional Market Forecast, 2024-2032
- 14.3 Regional Pricing, Production and Demand Differences
- 14.4 North America
- 14.4.1 United States
- 14.4.2 Canada
- 14.4.3 Mexico
- 14.5 Europe
- 14.5.1 Germany
- 14.5.2 France
- 14.5.3 Italy
- 14.5.4 United Kingdom
- 14.5.5 Spain
- 14.5.6 Poland
- 14.5.7 Russia
- 14.5.8 Netherlands
- 14.5.9 Belgium
- 14.5.10 Sweden
- 14.5.11 Denmark
- 14.5.12 Norway
- 14.5.13 Rest of Europe
- 14.6 Asia Pacific
- 14.6.1 China
- 14.6.2 India
- 14.6.3 Japan
- 14.6.4 South Korea
- 14.6.5 Thailand
- 14.6.6 Indonesia
- 14.6.7 Vietnam
- 14.6.8 Malaysia
- 14.6.9 Australia
- 14.6.10 Rest of Asia Pacific
- 14.7 Latin America
- 14.7.1 Brazil
- 14.7.2 Argentina
- 14.7.3 Colombia
- 14.7.4 Chile
- 14.7.5 Rest of Latin America
- 14.8 Middle East
- 14.8.1 Saudi Arabia
- 14.8.2 United Arab Emirates
- 14.8.3 Turkey
- 14.8.4 Israel
- 14.8.5 Iran
- 14.8.6 Rest of the Middle East
- 14.9 Africa
- 14.9.1 South Africa
- 14.9.2 Egypt
- 14.9.3 Nigeria
- 14.9.4 Morocco
- 14.9.5 Rest of Africa
- 14.10 Regional Investment, Policy and Supply Chain Differences
- 14.11 Regional Competitive Landscape
- 14.12 Geographic Growth Hotspots
Chapter 15 Global Petrochemical Processing Equipment Technology, Innovation and Sustainability Outlook
- 15.1 Technology Landscape and Maturity
- 15.2 Product, Process and Service Innovation
- 15.3 AI, Automation and Digital Tools in the Industry
- 15.4 Technology Adoption and Performance Benchmarking
- 15.5 Innovation Pipeline and R&D Investment
- 15.6 Patent and Intellectual Property Trends
- 15.7 Energy Efficiency and Resource Management
- 15.8 Sustainability, Recycling and Circularity
- 15.9 Technology Roadmap, 2024-2032
- 15.10 Risks of Obsolescence and Technology Substitution
Chapter 16 Global Petrochemical Processing Equipment Market Key Strategic Imperatives
- 16.1 Growth and Market Entry Priorities
- 16.2 High-Return Products and Segments
- 16.3 Pricing, Profitability and Cost Optimization
- 16.4 Technology Investment and Product Differentiation
- 16.5 Supply Chain Localization and Resilience
- 16.6 Distribution and Customer Acquisition
- 16.7 Partnership, Acquisition and Capacity Strategy
- 16.8 Regional Expansion Priorities
- 16.9 Short-, Medium- and Long-Term Actions
Chapter 17 Competition Outlook
- 17.1 Industry Competition Characteristics
- 17.2 Market Structure and Concentration
- 17.3 Market Share and Competitive Positioning, 2024
- 17.4 Company-Wise Revenue and Product Benchmarking
- 17.5 Production and Service Capacity Benchmarking
- 17.6 Technology, Pricing and Differentiation
- 17.7 Regional Footprint and Distribution Strength
- 17.8 Mergers, Acquisitions and Strategic Alliances
- 17.9 New Entrants and Competitive Threats
- 17.10 Porter's Five Forces and Industry Attractiveness
- 17.11 Competitive Outlook, 2024-2032
Chapter 18 Company Profiles
- 18.1 Company Coverage and Selection Criteria
- 18.2 INEOS Group Ltd.
- 18.2.1 Business Description
- 18.2.2 Company Ownership and Geographic Presence
- 18.2.3 Product and Service Portfolio
- 18.2.4 Manufacturing and Operating Footprint
- 18.2.5 Production Capacity and Expansion Plans
- 18.2.6 Financial Performance and Investment
- 18.2.7 Market Share and Competitive Position
- 18.2.8 Technology and Innovation Capabilities
- 18.2.9 Strategic Alliances or Partnerships
- 18.2.10 Recent Developments
- 18.2.11 Growth Strategy and Outlook
- 18.3 China National Petroleum Corporation (CNPC)
- 18.4 SABIC
- 18.5 Royal Dutch Shell PLC
- 18.6 Chevron Corporation
- 18.7 Dow
- 18.8 ExxonMobil Corporation
- 18.9 BASF SE
- 18.10 China Petrochemical Corporation
- 18.11 LyondellBasell Industries Holdings B.V.
- 18.12 Other Relevant Market Participants
Note: Every listed company is profiled on the structure shown under the first company. The company list is preliminary and may change based on research findings, market developments, data availability and client requirements.
Chapter 19 Disclaimer
- 19.1 Research and Forecast Disclaimer
- 19.2 Data Source and Estimation Limitations
Note: The depth of individual sections depends on data availability for this market. Volume, capacity, trade and other unit-based metrics are included where applicable.

