Market Overview
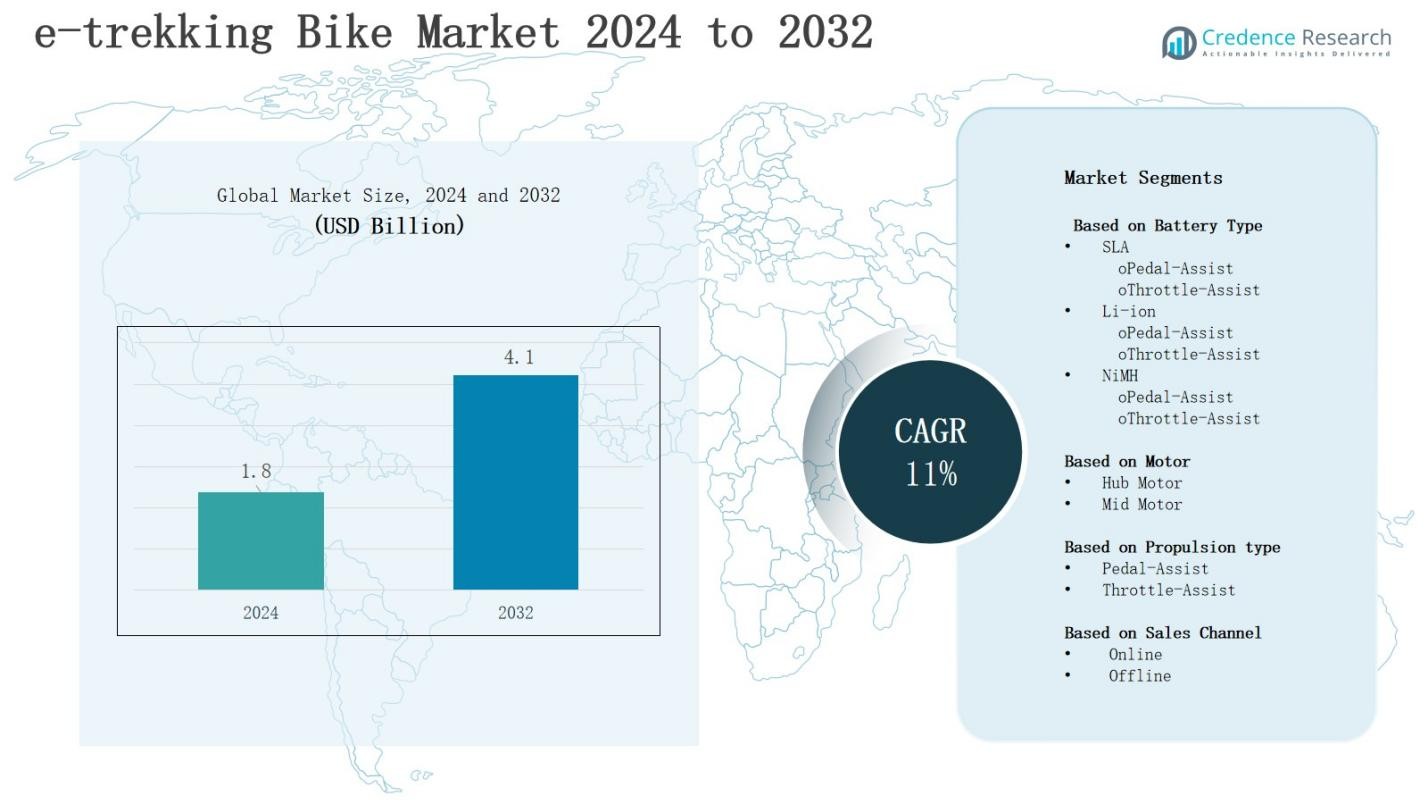
The e-trekking bike market is projected to grow from USD 1.8 billion in 2024 to USD 4.1 billion by 2032, registering an 11% CAGR during the forecast period.
| REPORT ATTRIBUTE | DETAILS |
|---|---|
| Historical Period | 2020-2023 |
| Base Year | 2024 |
| Forecast Period | 2025-2032 |
| E-Trekking Bike Market Size 2024 | USD 1.8 Billion |
| E-Trekking Bike Market, CAGR | 11% |
| E-Trekking Bike Market Size 2032 | USD 4.1 Billion |
The e-trekking bike market is driven by rising demand for eco-friendly mobility, health-conscious lifestyles, and growing interest in outdoor recreational activities. Advancements in battery efficiency, lightweight frame materials, and improved motor technologies enhance performance and range, encouraging adoption among both commuters and adventure riders. Government incentives promoting sustainable transport and expanding cycling infrastructure further stimulate market growth. Key trends include integration of smart connectivity features, GPS-enabled navigation, and customizable riding modes. The market also benefits from rental services, tourism partnerships, and premium product offerings, positioning e-trekking bikes as a versatile solution for sustainable travel and leisure.
The e-trekking bike market shows diverse regional dynamics, with Europe leading at 38% share, supported by strong cycling infrastructure and premium adoption. Asia-Pacific follows with 28%, driven by urbanization, government incentives, and growing tourism demand. North America holds 22%, fueled by eco-friendly commuting and outdoor culture. Latin America and the Middle East & Africa each capture 6%, supported by urban mobility programs and tourism activities. Key players include Accell Group, Giant Bicycles, Trek Bicycles, Specialized Bicycle Components, Scott Sports SA, Brompton Bicycle Ltd, Polygon Bikes, Tern, Merida Bikes, and Rad Power Bikes, LLC.
Market Insights
- The e-trekking bike market is set to grow from USD 1.8 billion in 2024 to USD 4.1 billion by 2032, recording an 11% CAGR during the forecast period.
- Lithium-ion batteries dominate with 72% share in 2024, supported by high energy density, lightweight structure, and long lifecycle. Pedal-assist Li-ion models remain the most widely adopted choice among riders.
- Hub motors lead with 63% share, favored for cost efficiency, simple design, and reliability. Mid-motors at 37% gain traction for high torque, better handling, and suitability for adventure terrain.
- Pedal-assist propulsion accounts for 76% share in 2024, driven by fitness appeal, extended travel ranges, and compliance with regulations. Throttle-assist holds 24%, attracting tourism and leisure-focused consumers.
- Europe leads with 38% share, followed by Asia-Pacific at 28%, North America at 22%, and Latin America and Middle East & Africa each at 6%, reflecting diverse adoption drivers.
Market Drivers
Rising Demand for Sustainable Mobility The e-trekking bike market is gaining momentum due to growing awareness of environmental sustainability and the need to reduce carbon emissions. Consumers prefer electric bikes over traditional vehicles for short and medium-distance travel, reducing reliance on fossil fuels. Governments support adoption with subsidies, tax benefits, and infrastructure investment. Cycling paths and dedicated lanes promote safe and efficient commuting. Urbanization and traffic congestion further strengthen demand. It positions e-trekking bikes as an attractive eco-friendly mobility option.
- For instance, in June 2025, Valeo unveiled its Cyclee™ mid-drive system, featuring a 48V motor with 130 Nm torque and an adaptive 7-speed automatic gearbox, powering smooth and efficient rides for urban and cargo e-bikes while emphasizing sustainability through motor and battery remanufacturing programs.
Technological Advancements and Performance Improvements
The e-trekking bike market benefits significantly from continuous improvements in battery technologies, lightweight frame materials, and efficient motors. Modern lithium-ion batteries extend riding ranges while cutting charging time, making e-trekking bikes more reliable for long-distance travel. Manufacturers integrate smart systems with GPS navigation, app connectivity, and power management features. These innovations enhance user experience and overall convenience. It appeals strongly to tech-savvy riders. Performance upgrades create confidence in product value and accelerate adoption rates.
- For instance, Mihogo’s Mini e-bike uses a 350W motor with efficient battery management to deliver a verified 62-mile range, demonstrating advances in lightweight, high-performance battery systems.
Growing Focus on Health and Lifestyle Benefits
The e-trekking bike market is supported by increasing interest in health, fitness, and active lifestyles. Consumers view cycling as both a recreational activity and a way to improve cardiovascular health. E-trekking bikes provide motor assistance, allowing riders of varied fitness levels to participate in long-distance tours. This inclusivity expands user demographics. Tourism industries and outdoor adventure operators promote guided cycling experiences. It supports lifestyle-driven adoption and strengthens the perception of cycling as a balanced wellness activity.
Expansion of Tourism and Recreational Activities
The e-trekking bike market experiences growth through partnerships with travel agencies, rental services, and eco-tourism operators. These collaborations introduce e-trekking bikes to tourists seeking sustainable exploration methods. Resorts and adventure parks invest in fleets to cater to environmentally conscious travelers. Organized cycling tours create steady demand across Europe, North America, and Asia-Pacific. It boosts visibility and acceptance across diverse regions. The combination of sustainability and leisure enhances the appeal of e-trekking bikes globally.
Market Trends
Integration of Smart Connectivity and Digital Features
The e-trekking bike market is witnessing strong adoption of smart connectivity solutions that enhance rider experience and safety. Manufacturers incorporate GPS navigation, Bluetooth, and app-based controls, allowing users to monitor battery levels, routes, and performance. Digital platforms also provide predictive maintenance alerts and trip data analytics. It creates a seamless interaction between riders and their bikes. These innovations appeal to younger demographics and urban professionals who value technology-driven convenience and reliability in mobility solutions.
- For instance, in 2025, Aventon’s Level 3 e-bike includes its ACU (Aventon Control Unit) which provides 4G-enabled GPS tracking, geofencing, and motion sensor alarms accessible via a mobile app, enhancing theft protection and allowing location monitoring during rides.
Advancements in Battery and Motor Technologies
The e-trekking bike market is being shaped by rapid improvements in battery energy density and motor efficiency. Modern lithium-ion batteries now support longer travel distances with shorter charging cycles, addressing consumer concerns about range anxiety. Compact, lightweight motors deliver higher torque and smoother assistance on challenging terrains. It strengthens performance for recreational and commuting use. Manufacturers highlight durability and safety standards to build consumer trust. These advancements establish a strong foundation for expanding market demand.
- For instance, Mihogo launched the Mini e-bike through an Indiegogo crowdfunding campaign. It features a 350W motor paired with a battery delivering a claimed 62-mile range, all on a lightweight frame optimized for urban commuting and recreation.
Shift Toward Premium and Customizable Offerings
The e-trekking bike market is experiencing growth in premium product segments driven by consumer preference for high-quality and customizable features. Riders seek models with advanced suspension, ergonomic designs, and digital integrations tailored to personal needs. Luxury brands invest in stylish frames and durable materials that enhance value perception. It attracts both adventure enthusiasts and professionals willing to invest in long-term solutions. The trend underlines growing consumer readiness to pay more for performance, comfort, and uniqueness.
Rising Popularity of Rental and Sharing Models
The e-trekking bike market is expanding with the emergence of rental platforms and sharing services that increase accessibility. Urban centers and tourist destinations partner with rental companies to provide affordable entry points for users. Travelers explore regions without ownership commitment, driving seasonal demand. It benefits from integration with tourism operators and eco-friendly travel programs. The model creates awareness across varied demographics. This trend builds long-term adoption by exposing new riders to the benefits of e-trekking bikes.
Market Challenges Analysis
High Costs and Limited Affordability
The e-trekking bike market faces a significant challenge due to the high cost of advanced models, which limits affordability for a broad consumer base. Premium features such as long-range batteries, lightweight materials, and smart connectivity increase production expenses and raise retail prices. Many potential buyers hesitate to invest, particularly in developing regions where disposable income is lower. It restricts mass adoption and keeps penetration concentrated in affluent markets. Price-sensitive consumers often choose conventional bicycles or low-cost electric alternatives.
Infrastructure Gaps and Maintenance Barriers
The e-trekking bike market also struggles with inadequate charging infrastructure and complex maintenance requirements. Limited availability of charging stations in rural and semi-urban areas creates range concerns among users. Specialized servicing and spare parts are often costly and not easily accessible, reducing convenience for owners. It discourages long-term use and replacement cycles. Market growth depends on investments in support infrastructure and skilled service networks. Without these improvements, adoption rates may remain below their potential in key regions.
Market Opportunities
Expansion into Emerging Markets and Urban Mobility
The e-trekking bike market holds strong opportunities in emerging economies where urbanization and environmental awareness are rising. Rapid growth of metropolitan areas creates demand for sustainable commuting options that reduce traffic congestion and pollution. Governments in Asia-Pacific and Latin America are promoting eco-friendly mobility through subsidies and infrastructure investments. It encourages consumers to adopt e-trekking bikes as viable alternatives to conventional vehicles. Expanding retail networks and e-commerce platforms further widen accessibility, creating long-term adoption potential.
Integration with Tourism and Adventure Sectors
The e-trekking bike market benefits from growing interest in eco-tourism and outdoor recreational activities. Travel operators, resorts, and adventure parks are introducing e-bike rental services to attract environmentally conscious travelers. It allows tourists to explore longer routes with less physical strain while supporting sustainable travel goals. Partnerships between manufacturers and tourism companies expand visibility and market reach. Rising demand for guided cycling tours and leisure experiences opens new revenue streams across both mature and developing regions.
Market Segmentation Analysis:
By Battery Type
The lithium-ion (Li-ion) battery segment dominates the e-trekking bike market with nearly 72% share in 2024, driven by its high energy density, lightweight design, and long lifecycle. Pedal-assist Li-ion models account for the largest adoption due to efficiency and extended range, appealing to both commuters and long-distance riders. SLA batteries hold about 18% share, serving entry-level, cost-sensitive buyers, while NiMH batteries capture 10% share, supported by moderate performance but limited scalability compared to Li-ion.
- For instance, for entry-level buyers, while SLA batteries were historically a cost-effective option for electric bicycles, the industry has largely shifted. Today, even entry-level models from manufacturers like Hero Lectro now incorporate lithium-ion batteries, which have become more affordable and provide superior performance, lifespan, and weight advantages.
By Motor
Hub motors lead the e-trekking bike market with around 63% share in 2024, supported by cost efficiency, simple design, and ease of maintenance. These motors provide reliable performance for urban commuting and moderate trekking routes, making them the preferred choice for mass-market adoption. Mid-motors account for 37% share, driven by their superior torque, better weight distribution, and suitability for steep terrains. Their popularity is growing among adventure riders seeking high performance and advanced handling.
- For instance, Shimano released a firmware update for its EP801 mid-drive motor that delivered a higher assist level in Boost mode and extended assist carryover, further improving performance on technical trails.
By Propulsion Type
Pedal-assist systems dominate the e-trekking bike market with approximately 76% share in 2024, fueled by their ability to balance rider effort with motor support, ensuring longer travel ranges and fitness appeal. These systems align with consumer demand for recreational and commuting use while complying with regulatory restrictions in several countries. Throttle-assist models hold about 24% share, catering to riders seeking convenience and effortless acceleration, with rising adoption in leisure and tourism applications.
Segments:
Based on Battery Type
- SLA
- Pedal-Assist
- Throttle-Assist
- Li-ion
-
- Pedal-Assist
- Throttle-Assist
- NiMH
-
- Pedal-Assist
- Throttle-Assist
Based on Motor
- Hub Motor
- Mid Motor
Based on Propulsion type
- Pedal-Assist
- Throttle-Assist
Based on Sales Channel
- Online
- Offline
Based on the Geography:
- North America
- U.S.
- Canada
- Mexico
- Europe
- Germany
- France
- U.K.
- Italy
- Spain
- Rest of Europe
- Asia Pacific
- China
- Japan
- India
- South Korea
- South-east Asia
- Rest of Asia Pacific
- Latin America
- Brazil
- Argentina
- Rest of Latin America
- Middle East & Africa
- GCC Countries
- South Africa
- Rest of the Middle East and Africa
Regional Analysis
North America
The e-trekking bike market in North America holds 22% share in 2024, driven by strong consumer interest in sustainable commuting and recreational cycling. Government incentives and supportive infrastructure, such as bike lanes and charging points, enhance adoption. The U.S. leads the region with robust demand in both urban mobility and adventure tourism. Canada follows with growing investments in eco-friendly transport programs. It benefits from rising health awareness and outdoor culture, strengthening long-term market growth.
Europe
Europe dominates the e-trekking bike market with a 38% share in 2024, supported by advanced cycling infrastructure, strict emission regulations, and a strong cycling culture. Germany, France, and the Netherlands are the largest contributors, benefiting from government subsidies and consumer preference for premium e-bikes. Pedal-assist systems are particularly popular due to regulatory compliance. It thrives in tourism-driven countries where cycling tours are a major attraction. Continuous innovation by European manufacturers sustains the region’s leading position.
Asia-Pacific
The e-trekking bike market in Asia-Pacific accounts for 28% share in 2024, fueled by rapid urbanization, traffic congestion, and supportive government policies promoting electric mobility. China and Japan lead the region with high adoption levels, while India shows rising demand supported by improving infrastructure. Consumers favor Li-ion battery models for cost-effectiveness and durability. It gains momentum through tourism programs and growing interest in fitness. Expanding e-commerce platforms also enhance accessibility, strengthening adoption among younger demographics.
Latin America
Latin America holds 6% share in 2024 in the e-trekking bike market, supported by increasing urban mobility needs and growing environmental awareness. Brazil and Mexico are the primary markets, with rising government interest in sustainable transport. Limited infrastructure and affordability challenges restrict wider adoption. It is gradually expanding with rental programs in tourist cities and premium adoption among affluent consumers. Market potential remains strong as urban development and eco-tourism initiatives continue to grow.
Middle East & Africa
The e-trekking bike market in the Middle East & Africa captures 6% share in 2024, with demand driven by rising tourism activities and urban sustainability programs. The UAE leads adoption through smart city initiatives, while South Africa records steady growth in outdoor recreational cycling. Infrastructure gaps and high product costs limit broader penetration. It benefits from rental services catering to international tourists. Long-term prospects improve as governments invest in sustainable mobility and eco-friendly transport solutions.
Key Player Analysis
- Specialized Bicycle Components
- Rad Power Bikes, LLC
- Scott Sports Sa
- Brompton Bicycle Ltd
- Tern
- Trek Bicycles
- Accell Group
- Polygon Bikes
- Giant Bicycles
- Merdia Bikes
Competitive Analysis
The e-trekking bike market is highly competitive with global and regional players focusing on innovation, distribution, and brand positioning. Companies such as Accell Group, Specialized Bicycle Components, Giant Bicycles, Trek Bicycles, and Scott Sports SA lead with advanced product portfolios that integrate high-performance batteries, lightweight frames, and smart connectivity features. Brompton Bicycle Ltd, Polygon Bikes, Tern, and Merida Bikes strengthen their presence through niche designs and expanding dealer networks. Rad Power Bikes, LLC emphasizes direct-to-consumer strategies and affordability, appealing to price-sensitive buyers in urban areas. Competition is defined by technological advancements, product differentiation, and strategic collaborations with tourism operators, rental platforms, and online retailers. The e-trekking bike market is shaped by constant upgrades in motor efficiency and battery performance, which enhance rider experience and range. It encourages manufacturers to invest in research and development while targeting lifestyle-driven consumers seeking sustainable mobility solutions. Strong brand reputation, aftersales service, and regional distribution partnerships remain critical factors influencing long-term market leadership and customer loyalty.
Recent Developments
- In March 2024, Urban Jungle launched the Ginza 1.0 trekking e-bike featuring a 625Wh Bosch Power Tube battery and Bosch Performance mid-mounted line motor for enhanced performance and range.
- In April 2024, Decathlon launched the RR900e hardtail e-bike in Europe with a Bosch motor and RockShox suspension.
- In June 2025, Vmoto announced a partnership with Uber Eats across several European cities. The collaboration provides financial incentives for couriers to adopt electric vehicles and introduces London’s first battery-swap pilot for e-mopeds, strengthening its role in sustainable mobility.
Report Coverage
The research report offers an in-depth analysis based on Battery Type, Motor, Propulsion Type, Sales Channel and Geography. It details leading market players, providing an overview of their business, product offerings, investments, revenue streams, and key applications. Additionally, the report includes insights into the competitive environment, SWOT analysis, current market trends, as well as the primary drivers and constraints. Furthermore, it discusses various factors that have driven market expansion in recent years. The report also explores market dynamics, regulatory scenarios, and technological advancements that are shaping the industry. It assesses the impact of external factors and global economic changes on market growth. Lastly, it provides strategic recommendations for new entrants and established companies to navigate the complexities of the market.
Future Outlook
- Demand will rise as consumers seek eco-friendly alternatives for commuting and recreational activities.
- Advances in battery technology will enhance range, reduce charging time, and improve reliability.
- Smart connectivity features will become standard, enabling riders to track performance and optimize routes.
- Premium models with customizable designs will gain popularity among adventure enthusiasts and professional cyclists.
- Rental and sharing platforms will expand, making e-trekking bikes accessible to broader demographics globally.
- Governments will strengthen adoption through supportive policies, subsidies, and cycling-friendly infrastructure development initiatives.
- Online sales channels will grow rapidly, supported by direct-to-consumer models and digital marketing strategies.
- Tourism operators will increasingly integrate e-trekking bikes into guided tours and leisure travel packages.
- Manufacturers will invest heavily in lightweight materials and advanced motors to improve overall riding performance.
- Growing urbanization will fuel adoption in emerging economies, particularly across Asia-Pacific and Latin America.

Request a Free Sample
Fill in your details and we'll send you a free sample report.
- Sample data tables & charts
- Research methodology
Market Dynamics
Rising Demand for Sustainable Mobility
Growing environmental awareness and the need to reduce carbon emissions are prompting consumers and governments to favor e-trekking bikes over traditional vehicles for short and medium-distance travel. Subsidies, tax incentives, and investments in cycling infrastructure further accelerate adoption.
Technological Advancements in Batteries and Motors
Continuous improvements in lithium-ion battery efficiency, lightweight frame materials, and motor technologies are extending range, reducing charging times, and enhancing overall performance, making e-trekking bikes more appealing for both commuters and adventure riders.
Health and Lifestyle Trends
Increasing focus on health, fitness, and active lifestyles is driving consumers to adopt e-trekking bikes for recreational and commuting purposes. Motor assistance enables riders of varying fitness levels to participate in long-distance cycling, broadening the user base.
Expansion of Tourism and Rental Services
Partnerships with travel agencies, resorts, and rental platforms are introducing e-trekking bikes to tourists and leisure seekers, boosting market visibility and seasonal demand, especially in regions with strong tourism industries.
Integration of Smart Connectivity Features
Manufacturers are incorporating GPS navigation, app-based controls, and digital performance tracking into e-trekking bikes, appealing to tech-savvy consumers and enhancing the overall user experience, which supports higher adoption rates.
Need a Custom Version of This Report?
Tailor the scope, geography, or segments to your exact requirements.
- Custom geography or segment scope
- Direct access to our analyst team
Frequently Asked Questions
What is the current market size for e-trekking bike market, and what is its projected size in 2032?
At what Compound Annual Growth Rate is the e-trekking bike market projected to grow between 2025 and 2032?
Which e-trekking bike market segment held the largest share in 2024?
What are the primary factors fueling the growth of the e-trekking bike market?
Who are the leading companies in the e-trekking bike market?
Which region commanded the largest share of the e-trekking bike market in 2024?
Table of Content
Chapter 1 Market Segmentation
- 1.1 Segmentation Framework
- 1.1.1 Product and Service Classification
- 1.1.2 Application and End-Use Classification
- 1.1.3 Technology and Solution Classification
- 1.1.4 Customer and Distribution Channel Classification
- 1.1.5 Geographic Segmentation
- 1.1.6 Market Segment Definitions and Boundaries
- 1.2 By Motor
- 1.2.1 Hub Motor
- 1.2.2 Mid Motor
- 1.3 By Battery Type
- 1.3.1 Lithium-ion (Li-ion)
- 1.3.2 Sealed Lead Acid (SLA)
- 1.3.3 Nickel Metal Hydride (NiMH)
- 1.4 By Sales Channel
- 1.4.1 Online
- 1.4.2 Offline
- 1.5 By Propulsion Type
- 1.5.1 Pedal-Assist
- 1.5.2 Throttle-Assist
Chapter 2 Introduction
- 2.1 Report Objectives and Scope
- 2.2 Product Definition and Industry Terminology
- 2.3 Market Inclusions and Exclusions
- 2.4 Research Process
- 2.4.1 Primary Research and Expert Interviews
- 2.4.2 Secondary Research and Source Review
- 2.4.3 Top-Down and Bottom-Up Estimation
- 2.4.4 Data Triangulation and Verification
- 2.5 Market Size Measurement Basis
- 2.5.1 2024: USD 1.8 billion → 2032: USD 4.1 billion
- 2.6 Historical and Forecast Reference Periods
- 2.6.1 Base Year: 2024
- 2.6.2 Forecast Period: 2024-2032
- 2.7 Research Assumptions and Limitations
Chapter 3 Executive Summary
- 3.1 Market Snapshot and Key Findings
- 3.2 Base-Year Market Size, 2024
- 3.3 Forecast Market Size, 2032
- 3.4 Revenue and Volume Growth Outlook
- 3.5 Key Demand and Supply Indicators
- 3.6 Leading Market Segments
- 3.7 Fastest-Growing Market Opportunities
- 3.8 Regional Performance Highlights
- 3.9 Technology and Industry Transformation
- 3.10 Competitive Landscape Summary
- 3.11 Analyst View and Strategic Implications
Chapter 4 Global E-Trekking Bike Market Trends and Developments
- 4.1 Historical Industry Development
- 4.2 Recent Market Trends and Developments
- 4.3 Demand and Customer Behavior Trends
- 4.4 Technology and Product Innovation
- 4.5 Artificial Intelligence, Automation and Digitalization
- 4.6 Local Manufacturing and Supply Chain Realignment
- 4.7 Industry Partnerships, Mergers and Acquisitions
- 4.8 Sustainability and Circular Economy Developments
- 4.9 Government and Private Sector Investment Trends
- 4.10 Emerging Business Models and Commercialization
- 4.11 Industry Developments and Announcements
Chapter 5 Global E-Trekking Bike Market Production, Supply and Demand Analysis
- 5.1 Demand Trend and Consumption Analysis
- 5.2 Demand Forecast, 2024-2032
- 5.3 Production and Output Trend
- 5.4 Production and Output Forecast, 2024-2032
- 5.5 Installed Capacity and Capacity Utilization
- 5.6 Company-Wise Production Plants and Statistics
- 5.6.1 Installed Production Capacity
- 5.6.2 Actual Production
- 5.6.3 Planned Capacity and Expansion Targets
- 5.7 Supply Chain Structure and Procurement Trends
- 5.8 Supply-Demand Gap and Bottlenecks
- 5.9 Import Dependence and Sourcing Structure
- 5.10 Contract Manufacturing and Outsourcing
- 5.11 Regional Supply and Demand Concentration
Chapter 6 Global E-Trekking Bike Market Pricing Analysis
- 6.1 Pricing Structure and Measurement
- 6.2 Historical Pricing Trends
- 6.3 Pricing Outlook, 2024-2032
- 6.4 Average Selling Price and Unit Economics
- 6.5 Pricing by Product and Market Segment
- 6.6 Geographic Pricing Differences
- 6.7 Key Input, Energy, Labor and Logistics Costs
- 6.8 Contract Pricing and Purchasing Models
- 6.9 Pricing Sensitivity and Competitive Positioning
- 6.10 Price, Margin and Profitability Implications
Chapter 7 Global E-Trekking Bike Market Dynamics
- 7.1 Market Growth Drivers
- 7.1.1 Demand-Side Drivers
- 7.1.2 Technology and Innovation Drivers
- 7.1.3 Infrastructure and Investment Drivers
- 7.1.4 Regulatory and Policy Drivers
- 7.2 Market Restraints
- 7.2.1 Cost and Affordability Constraints
- 7.2.2 Technology and Adoption Barriers
- 7.2.3 Supply Chain and Operational Constraints
- 7.3 Market Challenges
- 7.3.1 Competitive Pressure and Margin Erosion
- 7.3.2 Skills, Infrastructure and Implementation Gaps
- 7.4 Emerging Market Opportunities
- 7.5 Market Dynamics Impact and Time-Horizon Assessment
Chapter 8 Global E-Trekking Bike Value Chain Analysis
- 8.1 Industry Value Chain Overview
- 8.2 Upstream Suppliers and Critical Inputs
- 8.3 Technology and Component Providers
- 8.4 Manufacturing or Service Delivery
- 8.5 Distribution, Channel Partners and Integrators
- 8.6 Downstream Applications and End Users
- 8.7 Value Addition and Profit Pools
- 8.8 Vertical Integration and Outsourcing
- 8.9 Supplier Concentration and Risk
- 8.10 Supply Chain Localization and Resilience
Chapter 9 Global E-Trekking Bike Market Regulations and Policies
- 9.1 Relevant Laws, Standards and Compliance Frameworks
- 9.2 Product, Service, Safety and Quality Requirements
- 9.3 Government Policies, Incentives and Subsidies
- 9.4 Imports, Exports and Trade Barriers
- 9.5 Public Procurement and Local Content Requirements
- 9.6 Environmental and Sustainability Compliance
- 9.7 Upcoming Policy Changes and Market Implications
Chapter 10 Global E-Trekking Bike Market Hotspots and Opportunities
- 10.1 Market Opportunity Mapping and Growth Hotspots
- 10.2 High-Growth Applications and Customer Groups
- 10.3 Underserved Markets and White-Space Opportunities
- 10.4 Emerging Technology and Product Opportunities
- 10.5 New Capacity and Investment Hotspots
- 10.6 Market Entry and Expansion Opportunities
- 10.7 Distribution and Partnership Opportunities
- 10.8 Near-Term and Long-Term Commercial Potential
- 10.9 Opportunity Attractiveness and Execution Risks
Chapter 11 Global E-Trekking Bike Market Outlook, 2024-2032
- 11.1 Market Size and Analysis
- 11.1.1 Revenue (Market Measurement: 2024: USD 1.8 billion → 2032: USD 4.1 billion)
- 11.1.2 Market Volume and Quantity Sold
- 11.1.3 Historical Market Size
- 11.1.4 Base-Year Market Size, 2024
- 11.2 Market Forecast, 2024-2032
- 11.2.1 Revenue Forecast to 2032
- 11.2.2 Volume Forecast to 2032
- 11.2.3 CAGR and Year-on-Year Growth
- 11.2.4 Incremental Revenue Opportunity
- 11.3 Forecast Assumptions and Scenario Analysis
- 11.3.1 Base-Case Forecast
- 11.3.2 Optimistic and Conservative Scenarios
- 11.3.3 Technology, Pricing and Policy Sensitivities
- 11.4 Market Attractiveness and Growth Outlook
Chapter 12 Global E-Trekking Bike Market Segmentation and Outlook
- 12.1 Segmentation Summary and Market Shares, 2024
- 12.2 Largest and Fastest-Growing Segments
- 12.3 By Motor - Market Size and Forecast, 2024-2032
- 12.3.1 Segment Definition and Scope
- 12.3.2 Historical Market Size
- 12.3.3 Revenue Forecast, 2024-2032
- 12.3.4 Volume Forecast, 2024-2032
- 12.3.5 Base-Year Market Share, 2024
- 12.3.6 Segment CAGR and Growth Drivers
- 12.3.7 Subsegment Market Size and Forecast
- 12.3.7.1 Hub Motor
- 12.3.7.2 Mid Motor
- 12.3.8 Subsegment Pricing and Adoption Trends
- 12.3.9 Leading Suppliers and Competition
- 12.3.10 Regional Demand and Opportunities
- 12.4 By Battery Type - Market Size and Forecast, 2024-2032
- 12.4.1 Segment Definition and Scope
- 12.4.2 Historical Market Size
- 12.4.3 Revenue Forecast, 2024-2032
- 12.4.4 Volume Forecast, 2024-2032
- 12.4.5 Base-Year Market Share, 2024
- 12.4.6 Segment CAGR and Growth Drivers
- 12.4.7 Subsegment Market Size and Forecast
- 12.4.7.1 Lithium-ion (Li-ion)
- 12.4.7.2 Sealed Lead Acid (SLA)
- 12.4.7.3 Nickel Metal Hydride (NiMH)
- 12.4.8 Subsegment Pricing and Adoption Trends
- 12.4.9 Leading Suppliers and Competition
- 12.4.10 Regional Demand and Opportunities
- 12.5 By Sales Channel - Market Size and Forecast, 2024-2032
- 12.5.1 Segment Definition and Scope
- 12.5.2 Historical Market Size
- 12.5.3 Revenue Forecast, 2024-2032
- 12.5.4 Volume Forecast, 2024-2032
- 12.5.5 Base-Year Market Share, 2024
- 12.5.6 Segment CAGR and Growth Drivers
- 12.5.7 Subsegment Market Size and Forecast
- 12.5.7.1 Online
- 12.5.7.2 Offline
- 12.5.8 Subsegment Pricing and Adoption Trends
- 12.5.9 Leading Suppliers and Competition
- 12.5.10 Regional Demand and Opportunities
- 12.6 By Propulsion Type - Market Size and Forecast, 2024-2032
- 12.6.1 Segment Definition and Scope
- 12.6.2 Historical Market Size
- 12.6.3 Revenue Forecast, 2024-2032
- 12.6.4 Volume Forecast, 2024-2032
- 12.6.5 Base-Year Market Share, 2024
- 12.6.6 Segment CAGR and Growth Drivers
- 12.6.7 Subsegment Market Size and Forecast
- 12.6.7.1 Pedal-Assist
- 12.6.7.2 Throttle-Assist
- 12.6.8 Subsegment Pricing and Adoption Trends
- 12.6.9 Leading Suppliers and Competition
- 12.6.10 Regional Demand and Opportunities
- 12.7 Segment Growth Comparison
- 12.8 Segment Attractiveness and Priority Matrix
Chapter 13 Global E-Trekking Bike Geographic Market Outlook, 2024-2032
- 13.1 Regional Market Size and Share, 2024
- 13.2 Regional Market Forecast, 2024-2032
- 13.3 Regional Pricing, Production and Demand Differences
- 13.4 North America
- 13.4.1 United States
- 13.4.2 Canada
- 13.4.3 Mexico
- 13.5 Europe
- 13.5.1 Germany
- 13.5.2 France
- 13.5.3 Italy
- 13.5.4 United Kingdom
- 13.5.5 Spain
- 13.5.6 Poland
- 13.5.7 Russia
- 13.5.8 Netherlands
- 13.5.9 Belgium
- 13.5.10 Sweden
- 13.5.11 Denmark
- 13.5.12 Norway
- 13.5.13 Rest of Europe
- 13.6 Asia Pacific
- 13.6.1 China
- 13.6.2 India
- 13.6.3 Japan
- 13.6.4 South Korea
- 13.6.5 Thailand
- 13.6.6 Indonesia
- 13.6.7 Vietnam
- 13.6.8 Malaysia
- 13.6.9 Australia
- 13.6.10 Rest of Asia Pacific
- 13.7 Latin America
- 13.7.1 Brazil
- 13.7.2 Argentina
- 13.7.3 Colombia
- 13.7.4 Chile
- 13.7.5 Rest of Latin America
- 13.8 Middle East
- 13.8.1 Saudi Arabia
- 13.8.2 United Arab Emirates
- 13.8.3 Turkey
- 13.8.4 Israel
- 13.8.5 Iran
- 13.8.6 Rest of the Middle East
- 13.9 Africa
- 13.9.1 South Africa
- 13.9.2 Egypt
- 13.9.3 Nigeria
- 13.9.4 Morocco
- 13.9.5 Rest of Africa
- 13.10 Regional Investment, Policy and Supply Chain Differences
- 13.11 Regional Competitive Landscape
- 13.12 Geographic Growth Hotspots
Chapter 14 Global E-Trekking Bike Technology, Innovation and Sustainability Outlook
- 14.1 Technology Landscape and Maturity
- 14.2 Product, Process and Service Innovation
- 14.3 AI, Automation and Digital Tools in the Industry
- 14.4 Technology Adoption and Performance Benchmarking
- 14.5 Innovation Pipeline and R&D Investment
- 14.6 Patent and Intellectual Property Trends
- 14.7 Energy Efficiency and Resource Management
- 14.8 Sustainability, Recycling and Circularity
- 14.9 Technology Roadmap, 2024-2032
- 14.10 Risks of Obsolescence and Technology Substitution
Chapter 15 Global E-Trekking Bike Market Key Strategic Imperatives
- 15.1 Growth and Market Entry Priorities
- 15.2 High-Return Products and Segments
- 15.3 Pricing, Profitability and Cost Optimization
- 15.4 Technology Investment and Product Differentiation
- 15.5 Supply Chain Localization and Resilience
- 15.6 Distribution and Customer Acquisition
- 15.7 Partnership, Acquisition and Capacity Strategy
- 15.8 Regional Expansion Priorities
- 15.9 Short-, Medium- and Long-Term Actions
Chapter 16 Competition Outlook
- 16.1 Industry Competition Characteristics
- 16.2 Market Structure and Concentration
- 16.3 Market Share and Competitive Positioning, 2024
- 16.4 Company-Wise Revenue and Product Benchmarking
- 16.5 Production and Service Capacity Benchmarking
- 16.6 Technology, Pricing and Differentiation
- 16.7 Regional Footprint and Distribution Strength
- 16.8 Mergers, Acquisitions and Strategic Alliances
- 16.9 New Entrants and Competitive Threats
- 16.10 Porter's Five Forces and Industry Attractiveness
- 16.11 Competitive Outlook, 2024-2032
Chapter 17 Company Profiles
- 17.1 Company Coverage and Selection Criteria
- 17.2 Accell Group
- 17.2.1 Business Description
- 17.2.2 Company Ownership and Geographic Presence
- 17.2.3 Product and Service Portfolio
- 17.2.4 Manufacturing and Operating Footprint
- 17.2.5 Production Capacity and Expansion Plans
- 17.2.6 Financial Performance and Investment
- 17.2.7 Market Share and Competitive Position
- 17.2.8 Technology and Innovation Capabilities
- 17.2.9 Strategic Alliances or Partnerships
- 17.2.10 Recent Developments
- 17.2.11 Growth Strategy and Outlook
- 17.3 Giant Bicycles
- 17.4 Trek Bicycles
- 17.5 Specialized Bicycle Components
- 17.6 Scott Sports SA
- 17.7 Brompton Bicycle Ltd
- 17.8 Polygon Bikes
- 17.9 Tern
- 17.10 Merida Bikes
- 17.11 Rad Power Bikes, LLC
- 17.12 Other Relevant Market Participants
Note: Every listed company is profiled on the structure shown under the first company. The company list is preliminary and may change based on research findings, market developments, data availability and client requirements.
Chapter 18 Disclaimer
- 18.1 Research and Forecast Disclaimer
- 18.2 Data Source and Estimation Limitations
Note: The depth of individual sections depends on data availability for this market. Volume, capacity, trade and other unit-based metrics are included where applicable.