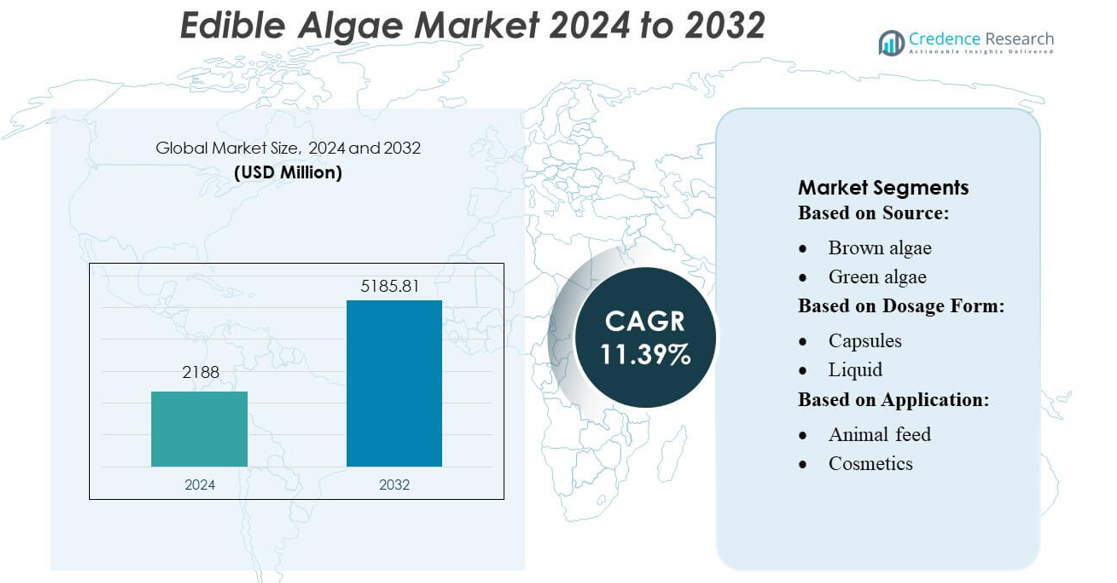
Home » Food & Beverage » Edible Algae Market

Edible Algae Market By Product type (Red algae, Brown algae, Green algae) By Form type (Liquid, Dried) By End-use (Pharmaceutical industry, Food and beverages industry, Chemical, Others) – Growth, Share, Opportunities & Competitive Analysis, 2016 – 2028

Price: $4999

Published: | Report ID: 4853 | Report Format : PDF

About this report

The global Edible Algae Market report explores the critical analysis of the Edible Algae industry using key parameters. The report consists of investment strategies, the need for investments in the Edible Algae industry, and the multiple benefits for the investors. Importantly, this report sets out major changes in the global technical regulations for the Edible Algae industry, as well as how economic and non-economic barriers are helping the Edible Algae market grow. Moreover, the report provides an in-depth analysis of the global, regional, and country-level historic and forecasted market size. The report also provides a comprehensive analysis of key investment propositions, demand and supply gap, competitors’ positioning, STAR analysis and SRC analysis. It also provides key technological developments and other analyses such as porter’s five forces analysis, PESTEL analysis and value chain analysis.

Key Highlights of the report

How are the major segments performing in the Edible Algae Market?

  • In 2021, red algae dominated the component segment. It can contain a high number of proteins and vitamins. They can be made as a great source of alternative proteins and are used for carrageenan, a food source. 
  • In 2021, the dried category dominated the edible algae market as seaweed powder is used in food and cosmetics products, and powders are easily stored. The converting process of macroalgae extracts to powder remove water and increase shelf life. Therefore, due to these factors, the demand for dried edible algae increased in the edible algae market in 2021. 
  • In 2021, the food and beverages segment in the end-use segment dominated the market. Entrepreneurs’ food and beverages industry recognized algae as an alternative protein source to meet the protein demand. These factors are contributing to the segment’s expansion. 
  • The supermarket and hypermarkets segment dominated the edible algae market’s growth due to customers’ high inclination to purchase edible algae globally. 
Design Element 2

Access crucial information at unmatched prices!

Request your free sample report today & start making informed decisions powered by Credence Research!

Download Free Sample
CTA Design Element 3

Which region dominated the Edible Algae Market?

In 2021, Asia pacific is dominating with the highest market share in the global edible algae market. Due to the growing consumer awareness, the high use of algae products, food products, and feed supplements is consumed in developing countries such as China and India. These countries have focused on R&D projects in algae products to control pollution and boost the market growth in 2021. Furthermore, increasing demand for both nutraceuticals and the pharmaceutical industry is increasing the growth of the edible algae market in this region.  

What is the competitive environment of the Edible Algae Market?

The edible algae industry’s competitive environment offers information on the total economic profit made by suppliers and businesses, the sales and revenues produced in this sector, the edible algae market share globally, the business organization overview, and the expansion of the companies globally. For instance, in April 2022, Acadian Sea plants Ltd a producer of algae-based products in the North American region, announced its microbial testing laboratory at their Deveau Center Extraction Facility in Cornwallis, Canada. Thus, this expansion strengthens the company to develop new and innovative algae-based products used in various end-use industries such as food and beverages, pharmaceuticals, and others.

Executive Summary

How is the personal care industry enhancing the Edible Algae Market growth?

The development of edible algae is in the personal care industry. The expansion of the companies in the global edible algae market is being driven by an increase in demand for food and beverage, personal care, and other industries. For instance, in June 2020, according to Frontier’s organization, a researcher named Katiyar and Arora mentioned that edible algae oil is considered a useful oil with excessive commercial potential and has the potential to be a raw material for ordinary edible oil. Thus, these research activities in the personal care industry by edible algae are expected to aid the global edible algae market growth during the forecast period.

Which are the key investments by the players in the Edible Algae Market?

Algae have been used in various industries due to their exceptional benefits and environment-friendly nature. The key players make various investments. For instance, in March 2019, Sapec, an agritech company, purchased 31% of the shares of Alagia SA, a manufacturer of algae-based ingredients for many industries such as food, feed, and personal care. Similarly, in July 2022, DIC Corporation, a Tokyo-based chemical company, funded an undisclosed amount to a Chicago-based food tech company that develops algae-based products.

Some of the major players in the market are Acadian Sea plants Ltd., North American Kelp, Ocean Organics Corp, Vitamin Sea Seaweed Co., Mendocino Sea Vegetable Company, Dulse & Rugosa and Irish Seaweeds.

What are the Major Driving Factors for the Edible Algae Market?

The rising pharmaceutical industries of algae for producing antivirals, neuroprotective products and antifungal medicines. The major factors in the market are the stable growth in the global population and the growing demand for food product portfolios. The increased applications of algae in domestic livestock, poultry and aquaculture production are also helping to increase the market growth. Moreover, algae fuel is a liquid fossil fuel used as a source of energy-rich oils. It is also viable for well-known biofuels such as corn and sugarcane. These factors are expected to drive the growth of the edible algae market during the forecast period. 

What are the Major Risks for the Edible Algae Market?

The production of algae requires a high cost due to the increasing water pollution and the mixing of toxic waste chemicals and plastics from industrial sewages. They challenge the harvesting from ocean beds and therefore increase the final cost of the edible algae market. These factors are impacted hamper the market growth. Furthermore, the off taste and flavor of functional ingredients also hamper the market growth.  

Which is the key End-user in the Market Edible Algae Market

The food and beverages industry dominated the Edible Algae market in 2021. Due to the rapid globalization and increasing population of the industrial sector, food and beverages have experienced growth over the past two years. As a result, entrepreneurs’ food and beverages industry recognized algae as an alternative protein source to accomplish the protein demand. Moreover, algae are used in the food and beverages industry as food supplements. Algae are added to meat products such as pasty, steaks, frankfurters and sausages, fish, fish, and oils to improve their quality. Furthermore, the process of food manufacturing the algae is used extensively in bakery and confectionery products as it improves their texture, color, and nutritional value. Therefore, the increased use of edible algae in food and beverages is expected to support market growth during the forecast period.

How is the Edible Algae Market performing in regions?

In 2021, Asia pacific is dominating the highest market share in the global edible algae market. India and China have focused on R&D projects in algae products to control pollution and boost the market growth. Due to the growing consumer awareness, high algae products, food products, and feed supplements are consumed in emerging countries such as India and China. Furthermore, increasing demand for both the pharmaceutical and nutraceuticals industry is increasing the growth of the edible algae market in the Asia-Pacific region. 

North America is expected to grow considerably due to surging demand for plant-based products. The increasing popularity of vegan and vegetarian diets has increased the demand for protein in this region. This region has become a valuable market for the functional food and beverages industry and further elevated the utilization of algae in various products. Moreover, the developments and technological advancements in the cultivation of algae are expected to increase the growth of the edible algae market in the North American region.

What is the regulatory landscape for the Edible Algae Market?

The regulatory landscape for the edible algae market is that governments are exploring a stricter regulatory approach across regions. For instance, in April 2022, EPA (Environmental Protection Agency) applied several restrictions on algae producers due to the negative impact on human and animal lives. Furthermore, EPA launched the Harmful Algal Bloom and Hypoxia Research and Control Act (HABHRCA); in that act, they mentioned that if a producer organizes any event on fresh and marine water which is harmful to individuals and animals in the case EPA has the authority to take actions on that company or person. Thus, this restriction on algae producers is expected to hamper the edible algae industry during the forecast period.

What is the Market Size of the Edible Algae regarding value?

The global Edible Algae Market is anticipated to grow at a substantial CAGR of xx% in the upcoming years. The global Edible Algae industry was estimated to be worth USD xx billion in 2021 and was expected to be worth USD xx billion by 2028.

Shape Your Report to Specific Countries or Regions & Enjoy 30% Off!

What major players are planning for the future of the Edible Algae Market?

The key players in the Edible Algae market are investing heavily globally due to the growing use of edible algae in various end-use industries such as pharmaceuticals, food & beverages, chemicals, and others. Additionally, the future scenarios indicate that well-known market players would make major investments in startups and medium-sized businesses to provide effective products to the industry. There are high predictions that the major players will acquire or merge with the major companies or startups to gain a competitive edge.

Segmentation of Global Edible Algae Market-

Global Edible Algae Market – By Product type

  • Red algae
  • Brown algae
  • Green algae

 Global Edible Algae Market – By Form type

  • Liquid 
  • Dried 

Global Edible Algae Market – By End-use

  • Pharmaceutical industry
  • Food and beverages industry
  • Chemical 
  • Others

Global Edible Algae Market – By Sales channels

  • Supermarkets and hypermarkets
  • E-commerce
  • Convenience stores
  • Others

Global Edible Algae Market – By Region

  • North America
    • U.S.
    • Canada
  • Europe
    • Germany
    • France
    • U.K.
    • Italy
    • Spain
    • Rest of Europe
  • Asia Pacific
    • China
    • Japan
    • India
    • South Korea
    • South-east Asia
    • Rest of Asia Pacific
  • Latin America
    • Brazil
    • Mexico
    • Rest of Latin America
  • Middle East & Africa
    • GCC Countries
    • South Africa
    • Rest of Middle East and Africa

Table of Content
1. Preface
1.1. Report Description
1.1.1. Purpose of the Report
1.1.2. Target Audience
1.1.3. USP and Key Offerings
1.2. Research Scope
1.3. Research Methodology
1.3.1. Phase I – Secondary Research
1.3.2. Phase II – Primary Research
1.3.3. Phase III – Expert Panel Review
1.3.4. Approach Adopted
1.3.4.1. Top-Down Approach
1.3.4.2. Bottom-Up Approach
1.3.5. Assumptions
1.4. Market Segmentation

2. Executive Summary
2.1. Market Snapshot: Global Edible Algae Market
2.2. Global Edible Algae Market, By Product Type
2.3. Global Edible Algae Market, By Form Type
2.4. Global Edible Algae Market, By End-Use
2.5. Global Edible Algae Market, By Sales Channel
2.6. Global Edible Algae Market, By Region

3. Market Dynamics & Factors Analysis
3.1. Introduction
3.1.1. Global Edible Algae Market Value, 2016-2028, (US$ Bn)
3.2. Market Dynamics
3.2.1. Key Growth Trends
3.2.2. Market Drivers
3.2.3. Market Restraints
3.2.4. Market Opportunities
3.2.5. Major Industry Challenges
3.3. Attractive Investment Proposition,2021
3.3.1. Product Type
3.3.2. Form Type
3.3.3. End-Use
3.3.4. Sales Channel
3.3.5. Geography

4. Premium Insights
4.1. STAR (Situation, Task, Action, Results) Analysis
4.2. Porter’s Five Forces Analysis
4.2.1. Threat of New Entrants
4.2.2. Bargaining Power of Buyers/Consumers
4.2.3. Bargaining Power of Suppliers
4.2.4. Threat of Substitute Types
4.2.5. Intensity of Competitive Rivalry
4.3. Value Chain Analysis
4.4. Technology Analysis
4.5. Marketing Strategy Analysis
4.5.1. Direct Marketing
4.5.2. Indirect Marketing
4.5.3. Marketing Channel Development Trend

5. Market Positioning of Key Players, 2021
5.1. Company market share of key players, 2021
5.2. Competitive Benchmarking
5.3. Market Positioning of Key Vendors
5.4. Geographical Presence Analysis
5.5. Major Strategies Adopted by Key Players
5.5.1. Key Strategies Analysis
5.5.2. Mergers and Acquisitions
5.5.3. Partnerships
5.5.4. Product Launch
5.5.5. Geographical Expansion
5.5.6. Others

6. COVID 19 Impact Analysis
6.1. Global Edible Algae Market Pre Vs Post COVID 19, 2019 – 2028
6.2. Impact on Import & Export
6.3. Impact on Demand & Supply

7. Global Edible Algae Market
7.1. Global Edible Algae Market, by Product Type, 2016-2028(US$ Bn)
7.1.1. Overview
7.1.2. Global Edible Algae Market, By Product Type, 2021 vs 2028 (in%)
7.1.3. Global Edible Algae Market, By Red Algae, 2016-2028 (US$ Bn)
7.1.4. Global Edible Algae Market, By Brown Algae, 2016-2028 (US$ Bn)
7.1.5. Global Edible Algae Market, By Green Algae, 2016-2028 (US$ Bn)
7.2. Global Edible Algae Market, by Form Type, 2016-2028(US$ Bn)
7.2.1. Overview
7.2.2. Global Edible Algae Market, By Form Type, 2021 vs 2028 (in%)
7.2.3. Global Edible Algae Market, By Liquid, 2016-2028 (US$ Bn)
7.2.4. Global Edible Algae Market, By Dried, 2016-2028 (US$ Bn)
7.3. Global Edible Algae Market, by End-Use, 2016-2028(US$ Bn)
7.3.1. Overview
7.3.2. Global Edible Algae Market, By End-Use, 2021 vs 2028 (in%)
7.3.3. Global Edible Algae Market, By Pharmaceutical Industry, 2016-2028 (US$ Bn)
7.3.4. Global Edible Algae Market, By Food & Beverage Industry, 2016-2028 (US$ Bn)
7.3.5. Global Edible Algae Market, By Chemical Industry, 2016-2028 (US$ Bn)
7.3.6. Global Edible Algae Market, By Other Industry, 2016-2028 (US$ Bn)
7.4. Global Edible Algae Market, by Sales Channel, 2016-2028(US$ Bn)
7.4.1. Overview
7.4.2. Global Edible Algae Market, By Sales Channel, 2021 vs 2028 (in%)
7.4.3. Global Edible Algae Market, By Supermarkets & Hypermarkets, 2016-2028 (US$ Bn)
7.4.4. Global Edible Algae Market, By E-commerce, 2016-2028 (US$ Bn)
7.4.5. Global Edible Algae Market, By Convenience Stores, 2016-2028 (US$ Bn)
7.4.6. Global Edible Algae Market, By Others, 2016-2028 (US$ Bn)

8. North America Edible Algae Market Analysis
8.1. North America Edible Algae Market, by Product Type, 2016-2028(US$ Bn)
8.1.1. Overview
8.1.2. SRC Analysis
8.2. North America Edible Algae Market, by Form Type, 2016-2028(US$ Bn)
8.2.1. Overview
8.2.2. SRC Analysis
8.3. North America Edible Algae Market, by End-Use, 2016-2028(US$ Bn)
8.3.1. Overview
8.3.2. SRC Analysis
8.4. North America Edible Algae Market, by Sales Channel, 2016-2028(US$ Bn)
8.4.1. Overview
8.4.2. SRC Analysis
8.5. North America Edible Algae Market, by Country, 2016-2028 (US$ Bn)
8.5.1. U.S.
8.5.1.1. U.S. Edible Algae Market Estimates and Forecast, 2016-2028 (US$ Bn)
8.5.1.2. U.S. Edible Algae, By Product Type, 2016-2028 (US$ Bn)
8.5.1.3. U.S. Edible Algae, By Form Type, 2016-2028 (US$ Bn)
8.5.1.4. U.S. Edible Algae, By End-Use, 2016-2028 (US$ Bn)
8.5.1.5. U.S. Edible Algae, By Sales Channel, 2016-2028 (US$ Bn)
8.5.2. Canada
8.5.2.1. Canada Edible Algae Market Estimates and Forecast, 2016-2028 (US$ Bn)
8.5.2.2. Canada Edible Algae, By Product Type, 2016-2028 (US$ Bn)
8.5.2.3. Canada Edible Algae, By Form Type, 2016-2028 (US$ Bn)
8.5.2.4. Canada Edible Algae, By End-Use, 2016-2028 (US$ Bn)
8.5.2.5. Canada Edible Algae, By Sales Channel, 2016-2028 (US$ Bn)

9. Europe Edible Algae Market Analysis
9.1. Europe Edible Algae Market, by Product Type, 2016-2028(US$ Bn)
9.1.1. Overview
9.1.2. SRC Analysis
9.2. Europe Edible Algae Market, by Form Type, 2016-2028(US$ Bn)
9.2.1. Overview
9.2.2. SRC Analysis
9.3. Europe Edible Algae Market, by End-Use, 2016-2028(US$ Bn)
9.3.1. Overview
9.3.2. SRC Analysis
9.4. Europe Edible Algae Market, by Sales Channel, 2016-2028(US$ Bn)
9.4.1. Overview
9.4.2. SRC Analysis
9.5. Europe Edible Algae Market, by Country, 2016-2028 (US$ Bn)
9.5.1. Germany
9.5.1.1. Germany Edible Algae Market Estimates and Forecast, 2016-2028 (US$ Bn)
9.5.1.2. Germany Edible Algae, By Product Type, 2016-2028 (US$ Bn)
9.5.1.3. Germany Edible Algae, By Form Type, 2016-2028 (US$ Bn)
9.5.1.4. Germany Edible Algae, By End-Use, 2016-2028 (US$ Bn)
9.5.1.5. Germany Edible Algae, By Sales Channel, 2016-2028 (US$ Bn)
9.5.2. France
9.5.2.1. France Edible Algae Market Estimates and Forecast, 2016-2028 (US$ Bn)
9.5.2.2. France Edible Algae, By Product Type, 2016-2028 (US$ Bn)
9.5.2.3. France Edible Algae, By Form Type, 2016-2028 (US$ Bn)
9.5.2.4. France Edible Algae, By End-Use, 2016-2028 (US$ Bn)
9.5.2.5. France Edible Algae, By Sales Channel, 2016-2028 (US$ Bn)
9.5.3. UK
9.5.3.1. UK Edible Algae Market Estimates and Forecast, 2016-2028 (US$ Bn)
9.5.3.2. UK Edible Algae, By Product Type, 2016-2028 (US$ Bn)
9.5.3.3. UK Edible Algae, By Form Type, 2016-2028 (US$ Bn)
9.5.3.4. UK Edible Algae, By End-Use, 2016-2028 (US$ Bn)
9.5.3.5. UK Edible Algae, By Sales Channel, 2016-2028 (US$ Bn)
9.5.4. Italy
9.5.4.1. Italy Edible Algae Market Estimates and Forecast, 2016-2028 (US$ Bn)
9.5.4.2. Italy Edible Algae, By Product Type, 2016-2028 (US$ Bn)
9.5.4.3. Italy Edible Algae, By Form Type, 2016-2028 (US$ Bn)
9.5.4.4. Italy Edible Algae, By End-Use, 2016-2028 (US$ Bn)
9.5.4.5. Italy Edible Algae, By Sales Channel, 2016-2028 (US$ Bn)
9.5.5. Spain
9.5.5.1. Spain Edible Algae Market Estimates and Forecast, 2016-2028 (US$ Bn)
9.5.5.2. Spain Edible Algae, By Product Type, 2016-2028 (US$ Bn)
9.5.5.3. Spain Edible Algae, By Form Type, 2016-2028 (US$ Bn)
9.5.5.4. Spain Edible Algae, By End-Use, 2016-2028 (US$ Bn)
9.5.5.5. Spain Edible Algae, By Sales Channel, 2016-2028 (US$ Bn)
9.5.6. Rest of Europe
9.5.6.1. Rest of Europe Edible Algae Market Estimates and Forecast, 2016-2028 (US$ Bn)
9.5.6.2. Rest of Europe Edible Algae, By Product Type, 2016-2028 (US$ Bn)
9.5.6.3. Rest of Europe Edible Algae, By Form Type, 2016-2028 (US$ Bn)
9.5.6.4. Rest of Europe Edible Algae, By End-Use, 2016-2028 (US$ Bn)
9.5.6.5. Rest of Europe Edible Algae, By Sales Channel, 2016-2028 (US$ Bn)

10. Asia Pacific Edible Algae Market Analysis
10.1. Asia Pacific Edible Algae Market, by Product Type, 2016-2028(US$ Bn)
10.1.1. Overview
10.1.2. SRC Analysis
10.2. Asia Pacific Edible Algae Market, by Form Type, 2016-2028(US$ Bn)
10.2.1. Overview
10.2.2. SRC Analysis
10.3. Asia Pacific Edible Algae Market, by End-Use, 2016-2028(US$ Bn)
10.3.1. Overview
10.3.2. SRC Analysis
10.4. Asia Pacific Edible Algae Market, by Sales Channel, 2016-2028(US$ Bn)
10.4.1. Overview
10.4.2. SRC Analysis
10.5. Asia Pacific Edible Algae Market, by Country, 2016-2028 (US$ Bn)
10.5.1. China
10.5.1.1. China Edible Algae Market Estimates and Forecast, 2016-2028 (US$ Bn)
10.5.1.2. China Edible Algae, By Product Type, 2016-2028 (US$ Bn)
10.5.1.3. China Edible Algae, By Form Type, 2016-2028 (US$ Bn)
10.5.1.4. China Edible Algae, By End-Use, 2016-2028 (US$ Bn)
10.5.1.5. China Edible Algae, By Sales Channel, 2016-2028 (US$ Bn)
10.5.2. Japan
10.5.2.1. Japan Edible Algae Market Estimates and Forecast, 2016-2028 (US$ Bn)
10.5.2.2. Japan Edible Algae, By Product Type, 2016-2028 (US$ Bn)
10.5.2.3. Japan Edible Algae, By Form Type, 2016-2028 (US$ Bn)
10.5.2.4. Japan Edible Algae, By End-Use, 2016-2028 (US$ Bn)
10.5.2.5. Japan Edible Algae, By Sales Channel, 2016-2028 (US$ Bn)
10.5.3. India
10.5.3.1. India Edible Algae Market Estimates and Forecast, 2016-2028 (US$ Bn)
10.5.3.2. India Edible Algae, By Product Type, 2016-2028 (US$ Bn)
10.5.3.3. India Edible Algae, By Form Type, 2016-2028 (US$ Bn)
10.5.3.4. India Edible Algae, By End-Use, 2016-2028 (US$ Bn)
10.5.3.5. India Edible Algae, By Sales Channel, 2016-2028 (US$ Bn)
10.5.4. South Korea
10.5.4.1. South Korea Edible Algae Market Estimates and Forecast, 2016-2028 (US$ Bn)
10.5.4.2. South Korea Edible Algae, By Product Type, 2016-2028 (US$ Bn)
10.5.4.3. South Korea Edible Algae, By Form Type, 2016-2028 (US$ Bn)
10.5.4.4. South Korea Edible Algae, By End-Use, 2016-2028 (US$ Bn)
10.5.4.5. South Korea Edible Algae, By Sales Channel, 2016-2028 (US$ Bn)
10.5.5. South-East Asia
10.5.5.1. South-East Asia Edible Algae Market Estimates and Forecast, 2016-2028 (US$ Bn)
10.5.5.2. South-East Asia Edible Algae, By Product Type, 2016-2028 (US$ Bn)
10.5.5.3. South-East Asia Edible Algae, By Form Type, 2016-2028 (US$ Bn)
10.5.5.4. South-East Asia Edible Algae, By End-Use, 2016-2028 (US$ Bn)
10.5.5.5. South-East Asia Edible Algae, By Sales Channel, 2016-2028 (US$ Bn)
10.5.6. Rest of Asia Pacific
10.5.6.1. Rest of Asia Pacific Edible Algae Market Estimates and Forecast, 2016-2028 (US$ Bn)
10.5.6.2. Rest of Asia Pacific Edible Algae, By Product Type, 2016-2028 (US$ Bn)
10.5.6.3. Rest of Asia Pacific Edible Algae, By Form Type, 2016-2028 (US$ Bn)
10.5.6.4. Rest of Asia Pacific Edible Algae, By End-Use, 2016-2028 (US$ Bn)
10.5.6.5. Rest of Asia Pacific Edible Algae, By Sales Channel, 2016-2028 (US$ Bn)

11. Latin America Edible Algae Market Analysis
11.1. Latin America Edible Algae Market, by Product Type, 2016-2028(US$ Bn)
11.1.1. Overview
11.1.2. SRC Analysis
11.2. Latin America Edible Algae Market, by Form Type, 2016-2028(US$ Bn)
11.2.1. Overview
11.2.2. SRC Analysis
11.3. Latin America Edible Algae Market, by End-Use, 2016-2028(US$ Bn)
11.3.1. Overview
11.3.2. SRC Analysis
11.4. Latin America Edible Algae Market, by Sales Channel, 2016-2028(US$ Bn)
11.4.1. Overview
11.4.2. SRC Analysis
11.5. Latin America Edible Algae Market, by Country, 2016-2028 (US$ Bn)
11.5.1. Brazil
11.5.1.1. Brazil Edible Algae Market Estimates and Forecast, 2016-2028 (US$ Bn)
11.5.1.2. Brazil Edible Algae, By Product Type, 2016-2028 (US$ Bn)
11.5.1.3. Brazil Edible Algae, By Form Type, 2016-2028 (US$ Bn)
11.5.1.4. Brazil Edible Algae, By End-Use, 2016-2028 (US$ Bn)
11.5.1.5. Brazil Edible Algae, By Sales Channel, 2016-2028 (US$ Bn)
11.5.2. Mexico
11.5.2.1. Mexico Edible Algae Market Estimates and Forecast, 2016-2028 (US$ Bn)
11.5.2.2. Mexico Edible Algae, By Product Type, 2016-2028 (US$ Bn)
11.5.2.3. Mexico Edible Algae, By Form Type, 2016-2028 (US$ Bn)
11.5.2.4. Mexico Edible Algae, By End-Use, 2016-2028 (US$ Bn)
11.5.2.5. Mexico Edible Algae, By Sales Channel, 2016-2028 (US$ Bn)
11.5.3. Rest of Latin America
11.5.3.1. Rest of Latin America Edible Algae Market Estimates and Forecast, 2016-2028 (US$ Bn)
11.5.3.2. Rest of Latin America Edible Algae, By Product Type, 2016-2028 (US$ Bn)
11.5.3.3. Rest of Latin America Edible Algae, By Form Type, 2016-2028 (US$ Bn)
11.5.3.4. Rest of Latin America Edible Algae, By End-Use, 2016-2028 (US$ Bn)
11.5.3.5. Rest of Latin America Edible Algae, By Sales Channel, 2016-2028 (US$ Bn)

12. Middle East and Africa Edible Algae Market Analysis
12.1. Middle East and Africa Edible Algae Market, by Product Type, 2016-2028(US$ Bn)
12.1.1. Overview
12.1.2. SRC Analysis
12.2. Middle East and Africa Edible Algae Market, by Form Type, 2016-2028(US$ Bn)
12.2.1. Overview
12.2.2. SRC Analysis
12.3. Middle East and Africa Edible Algae Market, by End-Use, 2016-2028(US$ Bn)
12.3.1. Overview
12.3.2. SRC Analysis
12.4. Middle East and Africa Edible Algae Market, by Sales Channel, 2016-2028(US$ Bn)
12.4.1. Overview
12.4.2. SRC Analysis
12.5. Middle East and Africa Edible Algae Market, by Country, 2016-2028 (US$ Bn)
12.5.1. GCC Countries
12.5.1.1. GCC Countries il Edible Algae Market Estimates and Forecast, 2016-2028 (US$ Bn)
12.5.1.2. GCC Countries Edible Algae, By Product Type, 2016-2028 (US$ Bn)
12.5.1.3. GCC Countries Edible Algae, By Form Type, 2016-2028 (US$ Bn)
12.5.1.4. GCC Countries Edible Algae, By End-Use, 2016-2028 (US$ Bn)
12.5.1.5. GCC Countries Edible Algae, By Sales Channel, 2016-2028 (US$ Bn)
12.5.2. South Africa
12.5.2.1. South Africa Edible Algae Market Estimates and Forecast, 2016-2028 (US$ Bn)
12.5.2.2. South Africa Edible Algae, By Product Type, 2016-2028 (US$ Bn)
12.5.2.3. South Africa Edible Algae, By Form Type, 2016-2028 (US$ Bn)
12.5.2.4. South Africa Edible Algae, By End-Use, 2016-2028 (US$ Bn)
12.5.2.5. South Africa Edible Algae, By Sales Channel, 2016-2028 (US$ Bn)
12.5.3. Rest of Middle East and Africa
12.5.3.1. Rest of Middle East and Africa Edible Algae Market Estimates and Forecast, 2016-2028 (US$ Bn)
12.5.3.2. Rest of Middle East and Africa Edible Algae, By Product Type, 2016-2028 (US$ Bn)
12.5.3.3. Rest of Middle East and Africa Edible Algae, By Form Type, 2016-2028 (US$ Bn)
12.5.3.4. Rest of Middle East and Africa Edible Algae, By End-Use, 2016-2028 (US$ Bn)
12.5.3.5. Rest of Middle East and Africa Edible Algae, By Sales Channel, 2016-2028 (US$ Bn)

13. Company Profiles
13.1. Acadian Sea plants Ltd.
13.1.1. Company Overview
13.1.2. Products/Green Algae Portfolio
13.1.3. Geographical Presence
13.1.4. Financial Summary
13.1.4.1. Market Revenue and Net Profit (2019-2021)
13.1.4.2. Business Segment Revenue Analysis
13.1.4.3. Geographical Revenue Analysis
13.2. North American Kelp
13.3. Ocean Organics Corp
13.4. Vitamin Sea Seaweed Co.
13.5. Mendocino Sea Vegetable Company
13.6. Dulse & Rugosa
13.7. Irish Seaweeds
13.8. Others

List of Figures

FIG. 1 Global Edible Algae Market: Research Methodology
FIG. 2 Market Size Estimation – Top Down & Bottom up Approach
FIG. 3 Global Edible Algae Market Segmentation
FIG. 4 Global Edible Algae Market, by Product Type, 2021 (US$ Bn)
FIG. 5 Global Edible Algae Market, by Form Type, 2021 (US$ Bn)
FIG. 6 Global Edible Algae Market, by End-Use Type, 2021 (US$ Bn)
FIG. 7 Global Edible Algae Market, by Sales Channel, 2021 (US$ Bn)
FIG. 8 Global Edible Algae Market, by Geography, 2021 (US$ Bn)
FIG. 9 Attractive Investment Proposition, by Product Type, 2021
FIG. 10 Attractive Investment Proposition, by Form Type, 2021
FIG. 11 Attractive Investment Proposition, by End-Use Type, 2021
FIG. 12 Attractive Investment Proposition, by Sales Channel, 2021
FIG. 13 Attractive Investment Proposition, by Geography, 2021
FIG. 14 Global Market Share Analysis of Key Edible Algae Market Manufacturers, 2021
FIG. 15 Global Market Positioning of Key Edible Algae Market Manufacturers, 2021
FIG. 16 Global Edible Algae Market Value Contribution, By Product Type, 2021 & 2028 (Value %)
FIG. 17 Global Edible Algae Market, by Red Algae, Value, 2016-2028 (US$ Bn)
FIG. 18 Global Edible Algae Market, by Brown Algae, Value, 2016-2028 (US$ Bn)
FIG. 19 Global Edible Algae Market, by Green Algae, Value, 2016-2028 (US$ Bn)
FIG. 20 Global Edible Algae Market Value Contribution, By Form Type, 2021 & 2028 (Value %)
FIG. 21 Global Edible Algae Market, by Liquid, Value, 2016-2028 (US$ Bn)
FIG. 22 Global Edible Algae Market, by Dried, Value, 2016-2028 (US$ Bn)
FIG. 23 Global Edible Algae Market Value Contribution, By End-Use, 2021 & 2028 (Value %)
FIG. 24 Global Edible Algae Market, by Pharmaceutical Industry, Value, 2016-2028 (US$ Bn)
FIG. 25 Global Edible Algae Market, by Food & Beverage Industry, Value, 2016-2028 (US$ Bn)
FIG. 26 Global Edible Algae Market, by Chemical Industry, Value, 2016-2028 (US$ Bn)
FIG. 27 Global Edible Algae Market, by Other Industry, Value, 2016-2028 (US$ Bn)
FIG. 28 Global Edible Algae Market Value Contribution, By Sales Channel, 2021 & 2028 (Value %)
FIG. 29 Global Edible Algae Market, by Supermarkets & Hypermarkets, Value, 2016-2028 (US$ Bn)
FIG. 30 Global Edible Algae Market, by E-commerce, Value, 2016-2028 (US$ Bn)
FIG. 31 Global Edible Algae Market, by Convenience Stores, Value, 2016-2028 (US$ Bn)
FIG. 32 Global Edible Algae Market, by Others, Value, 2016-2028 (US$ Bn)
FIG. 33 U.S. Edible Algae Market, 2016-2028 (US$ Bn)
FIG. 34 Canada Edible Algae Market, 2016-2028 (US$ Bn)
FIG. 35 Germany Edible Algae Market, 2016-2028 (US$ Bn)
FIG. 36 France Edible Algae Market, 2016-2028 (US$ Bn)
FIG. 37 U.K. Edible Algae Market, 2016-2028 (US$ Bn)
FIG. 38 Italy Edible Algae Market, 2016-2028 (US$ Bn)
FIG. 39 Spain Edible Algae Market, 2016-2028 (US$ Bn)
FIG. 40 Rest of Europe Edible Algae Market, 2016-2028 (US$ Bn)
FIG. 41 China Edible Algae Market, 2016-2028 (US$ Bn)
FIG. 42 Japan Edible Algae Market, 2016-2028 (US$ Bn)
FIG. 43 India Edible Algae Market, 2016-2028 (US$ Bn)
FIG. 44 South Korea Edible Algae Market, 2016-2028 (US$ Bn)
FIG. 45 Southeast Asia Edible Algae Market, 2016-2028 (US$ Bn)
FIG. 46 Rest of Asia Pacific Edible Algae Market, 2016-2028 (US$ Bn)
FIG. 47 Latin America Edible Algae Market, 2016-2028 (US$ Bn)
FIG. 48 Brazil Edible Algae Market, 2016-2028 (US$ Bn)
FIG. 49 Mexico Edible Algae Market, 2016-2028 (US$ Bn)
FIG. 50 Rest of Latin America Edible Algae Market, 2016-2028 (US$ Bn)
FIG. 51 Middle East & Africa Edible Algae Market, 2016-2028 (US$ Bn)
FIG. 52 GCC Countries Edible Algae Market, 2016-2028 (US$ Bn)
FIG. 53 South Africa Edible Algae Market, 2016-2028 (US$ Bn)
FIG. 54 Rest of Middle East and Africa Edible Algae Market, 2016-2028 (US$ Bn)

List of Tables

TABLE 1 Market Snapshot: Global Edible Algae Market
TABLE 2 Global Edible Algae Market, by Competitive Benchmarking, 2021
TABLE 3 Global Edible Algae Market, by Geographical Presence Analysis, 2021
TABLE 4 Global Edible Algae Market, by Key Strategies Analysis, 2021
TABLE 5 Global Edible Algae Market, by Product Type, 2016-2028 (US$ Bn)
TABLE 6 Global Edible Algae Market, by Form Type, 2016-2028 (US$ Bn)
TABLE 7 Global Edible Algae Market, by End-Use, 2016-2028 (US$ Bn)
TABLE 8 Global Edible Algae Market, by Sales Channel, 2016-2028 (US$ Bn)
TABLE 9 Global Edible Algae Market, by Geography, 2016-2028 (US$ Bn)
TABLE 10 North America Edible Algae Market, by Product Type, 2016-2028 (US$ Bn)
TABLE 11 North America Edible Algae Market, by Form Type, 2016-2028 (US$ Bn)
TABLE 12 North America Edible Algae Market, by End-Use, 2016-2028 (US$ Bn)
TABLE 13 North America Edible Algae Market, by Sales Channel, 2016-2028 (US$ Bn)
TABLE 14 North America Edible Algae Market, by Country, 2016-2028 (US$ Bn)
TABLE 15 US Edible Algae Market, by Product Type, 2016-2028 (US$ Bn)
TABLE 16 US Edible Algae Market, by Form Type, 2016-2028 (US$ Bn)
TABLE 17 US Edible Algae Market, by End-Use, 2016-2028 (US$ Bn)
TABLE 18 US Edible Algae Market, by Sales Channel, 2016-2028 (US$ Bn)
TABLE 19 Canada Edible Algae Market, by Product Type, 2016-2028 (US$ Bn)
TABLE 20 Canada Edible Algae Market, by Form Type, 2016-2028 (US$ Bn)
TABLE 21 Canada Edible Algae Market, by End-Use, 2016-2028 (US$ Bn)
TABLE 22 Canada Edible Algae Market, by Sales Channel, 2016-2028 (US$ Bn)
TABLE 23 Europe Edible Algae Market, by Product Type, 2016-2028 (US$ Bn)
TABLE 24 Europe Edible Algae Market, by Form Type, 2016-2028 (US$ Bn)
TABLE 25 Europe Edible Algae Market, by End-Use, 2016-2028 (US$ Bn)
TABLE 26 Europe Edible Algae Market, by Sales Channel, 2016-2028 (US$ Bn)
TABLE 27 Europe Edible Algae Market, by Country, 2016-2028 (US$ Bn)
TABLE 28 Germany Edible Algae Market, by Product Type, 2016-2028 (US$ Bn)
TABLE 29 Germany Edible Algae Market, by Form Type, 2016-2028 (US$ Bn)
TABLE 30 Germany Edible Algae Market, by End-Use, 2016-2028 (US$ Bn)
TABLE 31 Germany Edible Algae Market, by Sales Channel, 2016-2028 (US$ Bn)
TABLE 32 France Edible Algae Market, by Product Type, 2016-2028 (US$ Bn)
TABLE 33 France Edible Algae Market, by Form Type, 2016-2028 (US$ Bn)
TABLE 34 France Edible Algae Market, by End-Use, 2016-2028 (US$ Bn)
TABLE 35 France Edible Algae Market, by Sales Channel, 2016-2028 (US$ Bn)
TABLE 36 UK Edible Algae Market, by Product Type, 2016-2028 (US$ Bn)
TABLE 37 UK Edible Algae Market, by Form Type, 2016-2028 (US$ Bn)
TABLE 38 UK Edible Algae Market, by End-Use, 2016-2028 (US$ Bn)
TABLE 39 UK Edible Algae Market, by Sales Channel, 2016-2028 (US$ Bn)
TABLE 40 Italy Edible Algae Market, by Product Type, 2016-2028 (US$ Bn)
TABLE 41 Italy Edible Algae Market, by Form Type, 2016-2028 (US$ Bn)
TABLE 42 Italy Edible Algae Market, by End-Use, 2016-2028 (US$ Bn)
TABLE 43 Italy Edible Algae Market, by Sales Channel, 2016-2028 (US$ Bn)
TABLE 44 Spain Edible Algae Market, by Product Type, 2016-2028 (US$ Bn)
TABLE 45 Spain Edible Algae Market, by Form Type, 2016-2028 (US$ Bn)
TABLE 46 Spain Edible Algae Market, by End-Use, 2016-2028 (US$ Bn)
TABLE 47 Spain Edible Algae Market, by Sales Channel, 2016-2028 (US$ Bn)
TABLE 48 Rest of Europe Edible Algae Market, by Product Type, 2016-2028 (US$ Bn)
TABLE 49 Rest of Europe Edible Algae Market, by Form Type, 2016-2028 (US$ Bn)
TABLE 50 Rest of Europe Edible Algae Market, by End-Use, 2016-2028 (US$ Bn)
TABLE 51 Rest of Europe Edible Algae Market, by Sales Channel, 2016-2028 (US$ Bn)
TABLE 52 Asia Pacific Edible Algae Market, by Product Type, 2016-2028 (US$ Bn)
TABLE 53 Asia Pacific Edible Algae Market, by Form Type, 2016-2028 (US$ Bn)
TABLE 54 Asia Pacific Edible Algae Market, by End-Use, 2016-2028 (US$ Bn)
TABLE 55 Asia Pacific Edible Algae Market, by Sales Channel, 2016-2028 (US$ Bn)
TABLE 56 Asia Pacific Edible Algae Market, by Country, 2016-2028 (US$ Bn)
TABLE 57 China Edible Algae Market, by Product Type, 2016-2028 (US$ Bn)
TABLE 58 China Edible Algae Market, by Form Type, 2016-2028 (US$ Bn)
TABLE 59 China Edible Algae Market, by End-Use, 2016-2028 (US$ Bn)
TABLE 60 China Edible Algae Market, by Sales Channel, 2016-2028 (US$ Bn)
TABLE 61 Japan Edible Algae Market, by Product Type, 2016-2028 (US$ Bn)
TABLE 62 Japan Edible Algae Market, by Form Type, 2016-2028 (US$ Bn)
TABLE 63 Japan Edible Algae Market, by End-Use, 2016-2028 (US$ Bn)
TABLE 64 Japan Edible Algae Market, by Sales Channel, 2016-2028 (US$ Bn)
TABLE 65 India Edible Algae Market, by Product Type, 2016-2028 (US$ Bn)
TABLE 66 India Edible Algae Market, by Form Type, 2016-2028 (US$ Bn)
TABLE 67 India Edible Algae Market, by End-Use, 2016-2028 (US$ Bn)
TABLE 68 India Edible Algae Market, by Sales Channel, 2016-2028 (US$ Bn)
TABLE 69 South Korea Edible Algae Market, by Product Type, 2016-2028 (US$ Bn)
TABLE 70 South Korea Edible Algae Market, by Form Type, 2016-2028 (US$ Bn)
TABLE 71 South Korea Edible Algae Market, by End-Use, 2016-2028 (US$ Bn)
TABLE 72 South Korea Edible Algae Market, by Sales Channel, 2016-2028 (US$ Bn)
TABLE 73 South East Asia Edible Algae Market, by Product Type, 2016-2028 (US$ Bn)
TABLE 74 South East Asia Edible Algae Market, by Form Type, 2016-2028 (US$ Bn)
TABLE 75 South East Asia Edible Algae Market, by End-Use, 2016-2028 (US$ Bn)
TABLE 76 South East Asia Edible Algae Market, by Sales Channel, 2016-2028 (US$ Bn)
TABLE 77 Rest of Asia Pacific Edible Algae Market, by Product Type, 2016-2028 (US$ Bn)
TABLE 78 Rest of Asia Pacific Edible Algae Market, by Form Type, 2016-2028 (US$ Bn)
TABLE 79 Rest of Asia Pacific Edible Algae Market, by End-Use, 2016-2028 (US$ Bn)
TABLE 80 Rest of Asia Pacific Edible Algae Market, by Sales Channel, 2016-2028 (US$ Bn)
TABLE 81 Latin America Edible Algae Market, by Product Type, 2016-2028 (US$ Bn)
TABLE 82 Latin America Edible Algae Market, by Form Type, 2016-2028 (US$ Bn)
TABLE 83 Latin America Edible Algae Market, by End-Use, 2016-2028 (US$ Bn)
TABLE 84 Latin America Edible Algae Market, by Sales Channel, 2016-2028 (US$ Bn)
TABLE 85 Latin America Edible Algae Market, by Country, 2016-2028 (US$ Bn)
TABLE 86 Brazil Edible Algae Market, by Product Type, 2016-2028 (US$ Bn)
TABLE 87 Brazil Edible Algae Market, by Form Type, 2016-2028 (US$ Bn)
TABLE 88 Brazil Edible Algae Market, by End-Use, 2016-2028 (US$ Bn)
TABLE 89 Brazil Edible Algae Market, by Sales Channel, 2016-2028 (US$ Bn)
TABLE 90 Mexico Edible Algae Market, by Product Type, 2016-2028 (US$ Bn)
TABLE 91 Mexico Edible Algae Market, by Form Type, 2016-2028 (US$ Bn)
TABLE 92 Mexico Edible Algae Market, by End-Use, 2016-2028 (US$ Bn)
TABLE 93 Mexico Edible Algae Market, by Sales Channel, 2016-2028 (US$ Bn)
TABLE 94 Rest of Latin America Edible Algae Market, by Product Type, 2016-2028 (US$ Bn)
TABLE 95 Rest of Latin America Edible Algae Market, by Form Type, 2016-2028 (US$ Bn)
TABLE 96 Rest of Latin America Edible Algae Market, by End-Use, 2016-2028 (US$ Bn)
TABLE 97 Rest of Latin America Edible Algae Market, by Sales Channel, 2016-2028 (US$ Bn)
TABLE 98 Middle East and Africa Edible Algae Market, by Product Type, 2016-2028 (US$ Bn)
TABLE 99 Middle East and Africa Edible Algae Market, by Form Type, 2016-2028 (US$ Bn)
TABLE 100 Middle East and Africa Edible Algae Market, by End-Use, 2016-2028 (US$ Bn)
TABLE 101 Middle East and Africa Edible Algae Market, by Sales Channel, 2016-2028 (US$ Bn)
TABLE 102 Middle East and Africa Edible Algae Market, by Country, 2016-2028 (US$ Bn)
TABLE 103 GCC Countries Edible Algae Market, by Product Type, 2016-2028 (US$ Bn)
TABLE 104 GCC Countries Edible Algae Market, by Form Type, 2016-2028 (US$ Bn)
TABLE 105 GCC Countries Edible Algae Market, by End-Use, 2016-2028 (US$ Bn)
TABLE 106 GCC Countries Edible Algae Market, by Sales Channel, 2016-2028 (US$ Bn)
TABLE 107 South Africa Edible Algae Market, by Product Type, 2016-2028 (US$ Bn)
TABLE 108 South Africa Edible Algae Market, by Form Type, 2016-2028 (US$ Bn)
TABLE 109 South Africa Edible Algae Market, by End-Use, 2016-2028 (US$ Bn)
TABLE 110 South Africa Edible Algae Market, by Sales Channel, 2016-2028 (US$ Bn)
TABLE 111 Rest of Middle East and Africa Edible Algae Market, by Product Type, 2016-2028 (US$ Bn)
TABLE 112 Rest of Middle East and Africa Edible Algae Market, by Form Type, 2016-2028 (US$ Bn)
TABLE 113 Rest of Middle East and Africa Edible Algae Market, by End-Use, 2016-2028 (US$ Bn)
TABLE 114 Rest of Middle East and Africa Edible Algae Market, by Sales Channel, 2016-2028 (US$ Bn)

Frequently Asked Questions

Which key factors will influence the edible algae market growth over 2022-2028?

The rising pharmaceutical industries of algae for producing antivirals, neuroprotective products and antifungal medicines. The major factors in the market are the stable growth in the global population and the growing demand for food product portfolios. The increased applications of algae in domestic livestock, poultry and aquaculture production are also helping to increase the market growth. Moreover, algae fuel is a liquid fossil fuel used as a source of energy-rich oils.

What will be the value of the edible algae market during 2022-2028?

The global Edible Algae Market is anticipated to grow at a substantial CAGR of xx% in the upcoming years. The global Edible Algae industry was estimated to be worth USD xx billion in 2021 and was expected to be worth USD xx billion by 2028.

Which region will contribute notably towards the edible algae market value?

In 2021, Asia pacific is dominating with the highest market share in the global edible algae market. Due to the growing consumer awareness, the high use of algae products, food products, and feed supplements is consumed in developing countries such as China and India. These countries have focused on R&D projects in algae products to control pollution and boost the market growth in 2021.

Which are the significant players leveraging the edible algae market growth?

The main competitors dominating the global edible algae market include Acadian Sea plants Ltd., North American Kelp, Ocean Organics Corp, Vitamin Sea Seaweed Co., Mendocino Sea Vegetable Company, Dulse & Rugosa and Irish Seaweeds.

What is the base year considered for edible algae market ?

The base year of this report is 2021.

Food & Beverage Vending Machines Market

Published:
Report ID: 5489

Functional Food Ingredients Market

Published:
Report ID: 5704

Food And Beverages Nano-Enabled Packaging Market

Published:
Report ID: 5488

Almond Oil Market

Published:
Report ID: 36611

Edible Gold Market

Published:
Report ID: 36608

Artificial Sweetener Market

Published:
Report ID: 36605

Individual Quick Freezing (IQF) Fruits Market

Published:
Report ID: 6585

Specialty Yeast Market

Published:
Report ID: 36557

Prebiotic Ingredients Market

Published:
Report ID: 36544

Chia Seeds Market

Published:
Report ID: 3952

Cereal Bars Market

Published:
Report ID: 3837

Food Encapsulation Market

Published:
Report ID: 5663

Purchase Options

$2999
Delivery Format: Excel.
$4999
Designed for the individual purchaser.
$6999
Users located at a single corporate site or regional office.
$7999
Allowed for unlimited sharing globally within one company.
Smallform of Sample request

Have a question?

User Profile

Don’t settle for less – trust Mitul to help you find the best solution.

Report delivery within 24 to 48 hours

– Other Info –

What people say?-

User Review

I am very impressed with the information in this report. The author clearly did their research when they came up with this product and it has already given me a lot of ideas.

Jana Schmidt
CEDAR CX Technologies

– Connect with us –

Phone

+91 6232 49 3207


support

24/7 Research Support


sales@credenceresearch.com

– Research Methodology –

Going beyond the basics: advanced techniques in research methodology

– Trusted By –

Pepshi, LG, Nestle
Motorola, Honeywell, Johnson and johnson
LG Chem, SIEMENS, Pfizer
Unilever, Samsonite, QIAGEN