
Market Overview
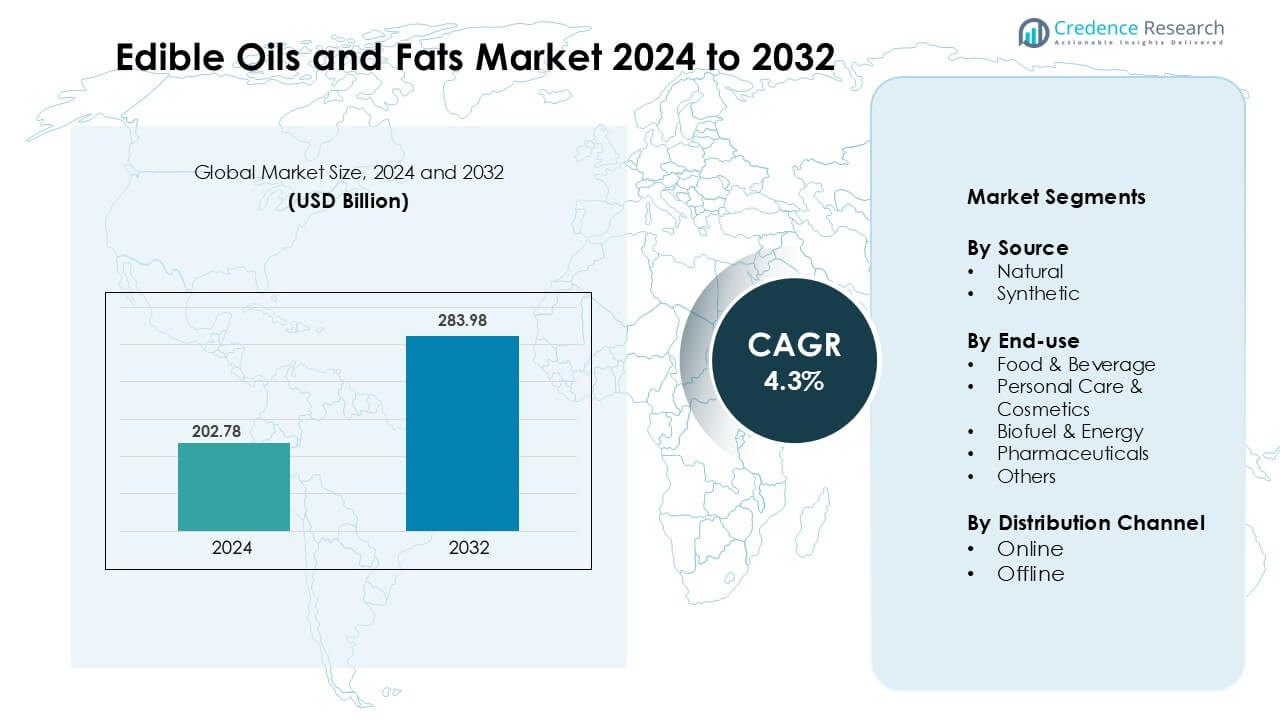
Edible Oils and Fats Market was valued at USD 202. 78 billion in 2024 and is anticipated to reach USD 283.98 billion by 2032, growing at a CAGR of 4.3% during the forecast period.
| REPORT ATTRIBUTE | DETAILS |
|---|---|
| Historical Period | 2020-2023 |
| Base Year | 2024 |
| Forecast Period | 2025-2032 |
| Edible Oils and Fats Market Size 2024 | USD 202. 78 Billion |
| Edible Oils and Fats Market, CAGR | 4.3% |
| Edible Oils and Fats Market Size 2032 | USD 283.98 Billion |
Asia-Pacific leads the edible oils and fats market with a 39% share, driven by high consumption in household cooking, food processing, and fast-growing retail channels. Major players such as Adani Wilmar Ltd., Cargill, Bunge Limited, ADM, Aceites Borges Pont S.A., The Nisshin Oillio Group, Kaneka Corporation, GrainCorp, ACH Food Companies, Inc., and Apetit Kasviöljy Oy. compete through large refining capacities, diversified sourcing, and strong brand portfolios. Global companies invest in sustainable sourcing, cold-pressed variants, and fortified oils, while regional producers focus on affordability and local distribution networks. Rising demand for healthier, plant-based oils strengthens competition across all product categories.
Market Insights
- The edible oils and fats market reached USD 202.78 billion in 2024 and is growing at a 4.3% CAGR, driven by rising packaged food and household cooking demand across key global regions.
- Strong market drivers include shifting consumer preference toward healthier plant-based oils, low trans-fat formulations, and fortified products that support heart and cholesterol-friendly diets. Rapid urbanization and processed food intake also increase industrial consumption in bakery, confectionery, snacks, and ready meals.
- Key trends involve premiumization, cold-pressed specialty oils, organic labeling, clean ingredients, and e-commerce expansion, where online grocery channels boost sales of niche and imported brands. Growing biodiesel production further expands demand for palm, soybean, and used cooking oil.
- Competitive activity remains strong as global players like Adani Wilmar Ltd, Cargill, Bunge, ADM, and others invest in sustainability, traceability, and large refining capacities to secure supply and pricing advantages.
- Asia-Pacific leads with 39% regional share, while North America holds 28% and Europe accounts for 25%. Natural sources dominate with 76% share, and food & beverage remains the top end-use segment at 68%, supported by strong retail penetration and packaged food demand.
Market Segmentation Analysis:
By Source
Natural sources hold the dominant share in the edible oils and fats market, capturing 76% of total revenue. Consumers prefer plant-based and minimally processed oils such as sunflower, soybean, and olive oil due to rising health awareness and clean-label demand. Natural oils support heart health, omega-rich diets, and sustainable agriculture practices. Synthetic fats remain limited to industrial and specialized uses because they face regulatory scrutiny and lower consumer acceptance. Growth in vegan, organic, and cold-pressed categories continues to strengthen the leadership of natural sources.
- For instance, Bunge Limited a global oilseed processor and producer of refined and specialty plant-based oils processed 8,908 thousand metric tons of refined & specialty oils in the year ended 31 Dec 2023.
By End-use
Food & Beverage remains the leading end-use segment, accounting for 68% of global consumption. Edible oils and fats are core ingredients in cooking, bakery, snacks, confectionery, and ready-to-eat meals. Demand grows due to urban lifestyles, rising disposable income, and processed food expansion. Personal care and cosmetics use specialty fats and butters for skin-conditioning properties, while the biofuel sector increases consumption of palm, soybean, and waste cooking oil for biodiesel production. Pharmaceutical applications benefit from their emulsifying and stabilizing functions, yet remain smaller in share.
- For instance, Operating profit for the Chocolate & Confectionery Fats business was SEK 971 million in 2021.
By Distribution Channel
Offline retail channels dominate the market with 72% share, driven by supermarkets, hypermarkets, and grocery stores offering bulk purchasing, promotions, and brand visibility. Consumers prefer physical inspection before buying staple products like cooking oils. However, online sales continue to rise due to home delivery, wider product variety, and subscription models for premium organic and cold-pressed oils. E-commerce platforms attract health-focused buyers seeking niche or imported brands. Digital marketing, price comparison, and doorstep supply chains strengthen online growth, though offline remains the larger and more trusted channel.
Key Growth Drivers
Rising Health and Nutrition Awareness
Growing consumer focus on health and nutritional benefits drives higher demand for plant-based and minimally processed edible oils and fats. Buyers prefer oils rich in omega fatty acids, antioxidants, and vitamins, including olive, canola, sunflower, and rice bran oil. The shift toward heart-friendly diets, cholesterol control, and clean-label ingredients supports premium cold-pressed and organic oil sales. Food manufacturers reformulate products with healthier fat profiles to meet regulatory standards and consumer expectations. Rapid expansion of vegan and flexitarian lifestyles also accelerates product innovation using plant-derived fats. This steady rise in nutrition-driven consumption strengthens market growth across both developed and emerging regions.
- For instance, Ricela Health Foods Ltd. operates a refining capacity of around 450 tonnes per day (TPD) for its refined rice bran oil business.
Expansion of Processed Food and Bakery Applications
The processed food and bakery sectors remain key demand generators for edible oils and fats, driven by urbanization, convenience food intake, and rising disposable income. Oils and fats play a vital role in frying, flavor enhancement, shelf-life extension, and texture stability. Fast-food chains, snack manufacturers, and frozen food producers rely on high-quality frying oils and specialty fats. In addition, the bakery industry uses shortening, margarine, cocoa butter substitutes, and emulsified fats to enhance product performance. Emerging markets experience strong retail penetration and a growing preference for packaged snacks and ready-to-eat meals, sustaining consistent growth. This expanding industrial demand increases product diversification and capacity investments by leading producers.
- For instance, Cargill, Inc. announced the launch of its “PalmAgility” bakery shortening product lines designed for lamination and donut-frying applications, addressing evolving processing needs in bakery and snack manufacture.
Growing Use in Biofuel and Renewable Energy
Edible oils and fats gain importance as feedstock for renewable fuel production, especially biodiesel. Governments promote cleaner energy and emission reduction policies, increasing consumption of palm oil, soybean oil, and used cooking oil in biofuel plants. Energy companies expand refining capacity for fatty acid methyl esters and advanced biofuels, encouraging higher procurement from agricultural suppliers. Countries with strong agriculture sectors support oilseed cultivation and export opportunities. This demand reduces reliance on fossil fuels while creating new industrial revenue streams. The rising global shift to sustainable and circular energy systems keeps biofuel applications a major growth enabler for edible oils and fats.
Key Trend & Opportunity
Premiumization and Specialty Oils
Premium edible oils and fats such as avocado, sesame, almond, and coconut oil witness rapid adoption due to their perceived health value, gourmet appeal, and clean-label positioning. Consumers favor cold-pressed, organic, and non-GMO variants that offer natural antioxidants and improved nutrient retention. Specialty fats such as cocoa butter equivalents and customized bakery shortenings drive higher margins for manufacturers. Retail brands expand flavored and infused oils to differentiate product lines. Growth in home cooking, social media food content, and healthy lifestyle promotion further supports premium category expansion. This trend encourages producers to innovate packaging, quality certifications, and supply-chain transparency.
- For instance, Musim Mas Group has a diverse portfolio of palm oil products and value-added derivatives, and offers more than 70 proprietary brands distributed globally, primarily for cooking oils, margarines, and soaps, with well-known names including Lervia, Medicare, Harmony, and Sunco. The company also introduced a subsidiary called Kevolve Dr MCT, which specializes in premium MCT oil products.
Expansion of E-commerce and Direct-to-Consumer Sales
Digital retail channels create strong growth opportunities, especially for premium, niche, or regional oil brands. Customers compare prices, ingredients, and reviews, leading to faster adoption of specialty oils. Subscription-based deliveries support repeat purchases for home-use cooking oils and ghee. Online platforms help small producers reach wider audiences without large brick-and-mortar investments. Demand increases for imported extra virgin olive oil, cold-pressed groundnut oil, and organic coconut oil through online grocery services. Attractive discounts, secure packaging, and doorstep delivery accelerate customer retention. This e-commerce expansion reshapes distribution strategy and expands brand visibility across urban and semi-urban markets.
- For instance, country delight (an online grocery delivery start-up in india) reports that its 6,000 delivery workers fulfil more than 5 million orders a month, reaching over 30,000 homes across 15cities in 11 states.
Key Challenge
Price Volatility and Supply Uncertainty
The edible oils and fats market faces supply chain disruptions due to unpredictable weather conditions, geopolitical tensions, and fluctuating crop yields. Major oilseed producers experience unstable production cycles influenced by climate change, pest attacks, and land-use restrictions. Dependence on imported palm oil, soybean oil, and sunflower oil increases price sensitivity in many importing countries. Transportation costs, export ban policies, and tariff changes also impact market stability. Volatility affects retail pricing and profitability for food manufacturers and distributors. Managing raw material risk, diversifying sourcing regions, and investing in sustainable farming practices are critical strategies to reduce supply uncertainty.
Health Concerns and Regulatory Compliance
Excessive consumption of saturated and trans fats raises long-term health concerns, pushing regulators to impose stricter food safety and labeling norms. Manufacturers must reduce trans-fat levels, eliminate harmful hydrogenation processes, and validate nutritional claims. Reformulating products without compromising taste, texture, and shelf life is technically challenging and costly. Consumer awareness of obesity, cardiovascular risks, and adulteration drives scrutiny of ingredient quality. Strict certifications, allergen disclosures, and safe processing standards increase compliance pressure, especially for small producers. Companies that adapt with healthier formulations and traceability systems remain more competitive in this evolving regulatory environment.
Regional Analysis
North America
North America holds 28% of the edible oils and fats market, supported by high consumption of packaged foods, bakery products, and home cooking ingredients. Consumers prefer healthier oils such as canola, sunflower, and olive oil due to rising nutrition awareness and demand for heart-friendly diets. Food manufacturers reformulate recipes with low trans-fat and non-GMO oils to meet regulatory standards. The United States drives regional demand through large-scale food processing, quick-service restaurants, and retail supermarket chains. Growth in plant-based food products, e-commerce grocery platforms, and premium cold-pressed oils continues to strengthen overall market expansion.
Europe
Europe accounts for 25% of the market, driven by strong demand for olive oil, sunflower oil, and specialty fats used in bakery, confectionery, and premium cooking. Italy, Spain, Greece, and Turkey lead olive oil production and export, while Western Europe favors organic and non-GMO variants aligned with clean-label preferences. Strict food safety regulations encourage high-quality refining and sustainable sourcing practices. Growth in vegan diets and plant-based dairy alternatives boosts consumption of coconut oil, cocoa butter substitutes, and nut-based oils. Retail private labels expand product availability, keeping Europe a steady and mature market.
Asia-Pacific
Asia-Pacific commands the largest share at 39%, driven by strong consumption of palm oil, soybean oil, and coconut oil in cooking, snacks, and processed foods. India, China, Indonesia, and Malaysia dominate production and trade due to large agricultural output and refining capacity. Rising population, urbanization, and fast-food adoption expand industrial usage. Local brands compete with multinational producers on price and quantity. Government support for edible oilseed cultivation and palm plantations sustains supply chains. Increasing preference for refined, fortified, and branded oils accelerates retail sales, making Asia-Pacific the most influential growth engine.
Latin America
Latin America captures 5% of the market, with Brazil, Argentina, and Mexico leading consumption and oilseed processing. Soybean oil is the dominant product, supported by strong agricultural exports and biodiesel production policies. A growing bakery and snack industry increases usage of vegetable oils and specialty fats. Urban households shift from traditional cooking fats to refined and packaged options. Economic volatility and fluctuating commodity prices affect affordability, yet rising retail penetration and supermarket chains expand branded sales across urban areas. Regional production strengths create export opportunities to North America, Europe, and Asia.
Middle East & Africa
The Middle East & Africa region holds 3% share, driven by high demand for sunflower, palm, and olive oil in household cooking and foodservice applications. Gulf countries import significant volumes due to limited domestic cultivation, while North African nations produce local olive oil. Population growth, expanding quick-service restaurants, and rising packaged food consumption increase demand. Affordability and availability remain top priorities, leading to strong sales of blended and refined cooking oils. Governments invest in food security and refining facilities to reduce import reliance. Gradual urbanization and modern retail formats support steady market growth.
Market Segmentations
By Source
- Natural
- Synthetic
By End-use
- Food & Beverage
- Personal Care & Cosmetics
- Biofuel & Energy
- Pharmaceuticals
- Others
By Distribution Channel
- Online
- Offline
By Geography
- North America
- U.S.
- Canada
- Mexico
- Europe
- Germany
- France
- U.K.
- Italy
- Spain
- Rest of Europe
- Asia Pacific
- China
- Japan
- India
- South Korea
- South-east Asia
- Rest of Asia Pacific
- Latin America
- Brazil
- Argentina
- Rest of Latin America
- Middle East & Africa
- GCC Countries
- South Africa
- Rest of the Middle East and Africa
Competitive Landscape
The edible oils and fats market is moderately consolidated, with global and regional producers competing through product quality, expansive distribution, and pricing strategies. Leading companies such as Adani Wilmar Ltd, Cargill, Bunge Limited, The Nisshin Oillio Group, and ADM focus on large-scale refining, efficient sourcing, and health-oriented formulations. Many players expand their portfolios with cold-pressed, organic, fortified, and specialty oils to meet clean-label demand. Retail partnerships, private labels, and e-commerce channels help brands strengthen visibility and target premium buyers. Companies also invest in sustainable palm oil certification, waste-to-oil processing, and traceable supply chains to comply with environmental regulations. Regional manufacturers compete through affordability and localized supply networks, while global brands rely on technology, brand equity, and international trade linkages. This competitive environment encourages continuous innovation, capacity expansion, and strategic mergers to secure market presence across diverse end-use sectors.
Key Player Analysis
- Adani Wilmar Ltd
- Kaneka Corporation
- Cargill, Incorporated
- GrainCorp
- The Nisshin Oillio Group, Ltd.
- ACH Food Companies, Inc
- Bunge Limited
- Aceites Borges Pont S.A.
- ADM
- Apetit Kasviöljy Oy.
Recent Developments
- In Mar 2025, Adani Wilmar (now AWL Agri Business) agreed to buy GD Foods (Tops) to expand packaged foods alongside its edible oils portfolio.
- In May 2025, Cargill ranked #1 on ATNi’s Edible Oil Supplier Index for eliminating industrial trans fats across its global edible oils portfolio, meeting WHO best practices
Report Coverage
The research report offers an in-depth analysis based on Source, End-Use, Distribution Channel and Geography. It details leading market players, providing an overview of their business, product offerings, investments, revenue streams, and key applications. Additionally, the report includes insights into the competitive environment, SWOT analysis, current market trends, as well as the primary drivers and constraints. Furthermore, it discusses various factors that have driven market expansion in recent years. The report also explores market dynamics, regulatory scenarios, and technological advancements that are shaping the industry. It assesses the impact of external factors and global economic changes on market growth. Lastly, it provides strategic recommendations for new entrants and established companies to navigate the complexities of the market.
Future Outlook
- Demand for healthier, low-trans-fat and cold-pressed oils will continue to rise.
- Plant-based and vegan diets will expand the use of natural and specialty oils in household cooking.
- Premium categories such as olive, avocado, sesame, and coconut oil will see stronger retail growth.
- Food manufacturers will reformulate snacks, bakery, and ready meals with healthier fat profiles.
- Biodiesel production will increase consumption of vegetable oils and used cooking oil as feedstock.
- Traceable and certified sustainable supply chains will become mandatory for large producers.
- Online grocery and direct-to-consumer platforms will drive sales of niche and imported brands.
- Packaging innovation and smaller pack sizes will attract price-sensitive buyers in emerging markets.
- Investments in refining capacity and oilseed cultivation will reduce import dependency in developing regions.
- Strategic partnerships and acquisitions will help companies expand brands, distribution, and product portfolios.

Request a Free Sample
Fill in your details and we'll send you a free sample report.
- Sample data tables & charts
- Research methodology
Need a Custom Version of This Report?
Tailor the scope, geography, or segments to your exact requirements.
- Custom geography or segment scope
- Direct access to our analyst team
Frequently Asked Questions
What is the current market size for Edible Oils and Fats Market, and what is its projected size in 2032?
At what Compound Annual Growth Rate is Edible Oils and Fats Market projected to grow between 2025 and 2032?
Which Edible Oils and Fats Market segment held the largest share in 2024?
What are the primary factors fueling the growth of Edible Oils and Fats Market?
Who are the leading companies in Edible Oils and Fats Market?
Which region commanded the largest share of Edible Oils and Fats Market in 2024?
Table of Content
Chapter 1 Market Segmentation
- 1.1 Segmentation Framework
- 1.1.1 Product and Service Classification
- 1.1.2 Application and End-Use Classification
- 1.1.3 Technology and Solution Classification
- 1.1.4 Customer and Distribution Channel Classification
- 1.1.5 Geographic Segmentation
- 1.1.6 Market Segment Definitions and Boundaries
Chapter 2 Introduction
- 2.1 Report Objectives and Scope
- 2.2 Product Definition and Industry Terminology
- 2.3 Market Inclusions and Exclusions
- 2.4 Research Process
- 2.4.1 Primary Research and Expert Interviews
- 2.4.2 Secondary Research and Source Review
- 2.4.3 Top-Down and Bottom-Up Estimation
- 2.4.4 Data Triangulation and Verification
- 2.5 Market Size Measurement Basis
- 2.5.1 2024: USD 202.78 billion → 2032: USD 283.98 billion
- 2.6 Historical and Forecast Reference Periods
- 2.6.1 Base Year: 2024
- 2.6.2 Forecast Period: 2024-2032
- 2.7 Research Assumptions and Limitations
Chapter 3 Executive Summary
- 3.1 Market Snapshot and Key Findings
- 3.2 Base-Year Market Size, 2024
- 3.3 Forecast Market Size, 2032
- 3.4 Revenue and Volume Growth Outlook
- 3.5 Key Demand and Supply Indicators
- 3.6 Leading Market Segments
- 3.7 Fastest-Growing Market Opportunities
- 3.8 Regional Performance Highlights
- 3.9 Technology and Industry Transformation
- 3.10 Competitive Landscape Summary
- 3.11 Analyst View and Strategic Implications
Chapter 4 Global Edible Oils and Fats Market Trends and Developments
- 4.1 Historical Industry Development
- 4.2 Recent Market Trends and Developments
- 4.3 Demand and Customer Behavior Trends
- 4.4 Technology and Product Innovation
- 4.5 Artificial Intelligence, Automation and Digitalization
- 4.6 Local Manufacturing and Supply Chain Realignment
- 4.7 Industry Partnerships, Mergers and Acquisitions
- 4.8 Sustainability and Circular Economy Developments
- 4.9 Government and Private Sector Investment Trends
- 4.10 Emerging Business Models and Commercialization
- 4.11 Industry Developments and Announcements
Chapter 5 Global Edible Oils and Fats Market Production, Supply and Demand Analysis
- 5.1 Demand Trend and Consumption Analysis
- 5.2 Demand Forecast, 2024-2032
- 5.3 Production and Output Trend
- 5.4 Production and Output Forecast, 2024-2032
- 5.5 Installed Capacity and Capacity Utilization
- 5.6 Company-Wise Production Plants and Statistics
- 5.6.1 Installed Production Capacity
- 5.6.2 Actual Production
- 5.6.3 Planned Capacity and Expansion Targets
- 5.7 Supply Chain Structure and Procurement Trends
- 5.8 Supply-Demand Gap and Bottlenecks
- 5.9 Import Dependence and Sourcing Structure
- 5.10 Contract Manufacturing and Outsourcing
- 5.11 Regional Supply and Demand Concentration
Chapter 6 Global Edible Oils and Fats Market Pricing Analysis
- 6.1 Pricing Structure and Measurement
- 6.2 Historical Pricing Trends
- 6.3 Pricing Outlook, 2024-2032
- 6.4 Average Selling Price and Unit Economics
- 6.5 Pricing by Product and Market Segment
- 6.6 Geographic Pricing Differences
- 6.7 Key Input, Energy, Labor and Logistics Costs
- 6.8 Contract Pricing and Purchasing Models
- 6.9 Pricing Sensitivity and Competitive Positioning
- 6.10 Price, Margin and Profitability Implications
Chapter 7 Global Edible Oils and Fats Market Dynamics
- 7.1 Market Growth Drivers
- 7.1.1 Demand-Side Drivers
- 7.1.2 Technology and Innovation Drivers
- 7.1.3 Infrastructure and Investment Drivers
- 7.1.4 Regulatory and Policy Drivers
- 7.2 Market Restraints
- 7.2.1 Cost and Affordability Constraints
- 7.2.2 Technology and Adoption Barriers
- 7.2.3 Supply Chain and Operational Constraints
- 7.3 Market Challenges
- 7.3.1 Competitive Pressure and Margin Erosion
- 7.3.2 Skills, Infrastructure and Implementation Gaps
- 7.4 Emerging Market Opportunities
- 7.5 Market Dynamics Impact and Time-Horizon Assessment
Chapter 8 Global Edible Oils and Fats Value Chain Analysis
- 8.1 Industry Value Chain Overview
- 8.2 Upstream Suppliers and Critical Inputs
- 8.3 Technology and Component Providers
- 8.4 Manufacturing or Service Delivery
- 8.5 Distribution, Channel Partners and Integrators
- 8.6 Downstream Applications and End Users
- 8.7 Value Addition and Profit Pools
- 8.8 Vertical Integration and Outsourcing
- 8.9 Supplier Concentration and Risk
- 8.10 Supply Chain Localization and Resilience
Chapter 9 Global Edible Oils and Fats Market Regulations and Policies
- 9.1 Relevant Laws, Standards and Compliance Frameworks
- 9.2 Product, Service, Safety and Quality Requirements
- 9.3 Government Policies, Incentives and Subsidies
- 9.4 Imports, Exports and Trade Barriers
- 9.5 Public Procurement and Local Content Requirements
- 9.6 Environmental and Sustainability Compliance
- 9.7 Upcoming Policy Changes and Market Implications
Chapter 10 Global Edible Oils and Fats Market Hotspots and Opportunities
- 10.1 Market Opportunity Mapping and Growth Hotspots
- 10.2 High-Growth Applications and Customer Groups
- 10.3 Underserved Markets and White-Space Opportunities
- 10.4 Emerging Technology and Product Opportunities
- 10.5 New Capacity and Investment Hotspots
- 10.6 Market Entry and Expansion Opportunities
- 10.7 Distribution and Partnership Opportunities
- 10.8 Near-Term and Long-Term Commercial Potential
- 10.9 Opportunity Attractiveness and Execution Risks
Chapter 11 Global Edible Oils and Fats Market Outlook, 2024-2032
- 11.1 Market Size and Analysis
- 11.1.1 Revenue (Market Measurement: 2024: USD 202.78 billion → 2032: USD 283.98 billion)
- 11.1.2 Market Volume and Quantity Sold
- 11.1.3 Historical Market Size
- 11.1.4 Base-Year Market Size, 2024
- 11.2 Market Forecast, 2024-2032
- 11.2.1 Revenue Forecast to 2032
- 11.2.2 Volume Forecast to 2032
- 11.2.3 CAGR and Year-on-Year Growth
- 11.2.4 Incremental Revenue Opportunity
- 11.3 Forecast Assumptions and Scenario Analysis
- 11.3.1 Base-Case Forecast
- 11.3.2 Optimistic and Conservative Scenarios
- 11.3.3 Technology, Pricing and Policy Sensitivities
- 11.4 Market Attractiveness and Growth Outlook
Chapter 12 Global Edible Oils and Fats Market Segmentation and Outlook
- 12.1 Segmentation Summary and Market Shares, 2024
- 12.2 Largest and Fastest-Growing Segments
- 12.3 Segment Growth Comparison
- 12.4 Segment Attractiveness and Priority Matrix
Chapter 13 Global Edible Oils and Fats Geographic Market Outlook, 2024-2032
- 13.1 Regional Market Size and Share, 2024
- 13.2 Regional Market Forecast, 2024-2032
- 13.3 Regional Pricing, Production and Demand Differences
- 13.4 North America
- 13.4.1 United States
- 13.4.2 Canada
- 13.4.3 Mexico
- 13.5 Europe
- 13.5.1 Germany
- 13.5.2 France
- 13.5.3 Italy
- 13.5.4 United Kingdom
- 13.5.5 Spain
- 13.5.6 Poland
- 13.5.7 Russia
- 13.5.8 Netherlands
- 13.5.9 Belgium
- 13.5.10 Sweden
- 13.5.11 Denmark
- 13.5.12 Norway
- 13.5.13 Rest of Europe
- 13.6 Asia Pacific
- 13.6.1 China
- 13.6.2 India
- 13.6.3 Japan
- 13.6.4 South Korea
- 13.6.5 Thailand
- 13.6.6 Indonesia
- 13.6.7 Vietnam
- 13.6.8 Malaysia
- 13.6.9 Australia
- 13.6.10 Rest of Asia Pacific
- 13.7 Latin America
- 13.7.1 Brazil
- 13.7.2 Argentina
- 13.7.3 Colombia
- 13.7.4 Chile
- 13.7.5 Rest of Latin America
- 13.8 Middle East
- 13.8.1 Saudi Arabia
- 13.8.2 United Arab Emirates
- 13.8.3 Turkey
- 13.8.4 Israel
- 13.8.5 Iran
- 13.8.6 Rest of the Middle East
- 13.9 Africa
- 13.9.1 South Africa
- 13.9.2 Egypt
- 13.9.3 Nigeria
- 13.9.4 Morocco
- 13.9.5 Rest of Africa
- 13.10 Regional Investment, Policy and Supply Chain Differences
- 13.11 Regional Competitive Landscape
- 13.12 Geographic Growth Hotspots
Chapter 14 Global Edible Oils and Fats Technology, Innovation and Sustainability Outlook
- 14.1 Technology Landscape and Maturity
- 14.2 Product, Process and Service Innovation
- 14.3 AI, Automation and Digital Tools in the Industry
- 14.4 Technology Adoption and Performance Benchmarking
- 14.5 Innovation Pipeline and R&D Investment
- 14.6 Patent and Intellectual Property Trends
- 14.7 Energy Efficiency and Resource Management
- 14.8 Sustainability, Recycling and Circularity
- 14.9 Technology Roadmap, 2024-2032
- 14.10 Risks of Obsolescence and Technology Substitution
Chapter 15 Global Edible Oils and Fats Market Key Strategic Imperatives
- 15.1 Growth and Market Entry Priorities
- 15.2 High-Return Products and Segments
- 15.3 Pricing, Profitability and Cost Optimization
- 15.4 Technology Investment and Product Differentiation
- 15.5 Supply Chain Localization and Resilience
- 15.6 Distribution and Customer Acquisition
- 15.7 Partnership, Acquisition and Capacity Strategy
- 15.8 Regional Expansion Priorities
- 15.9 Short-, Medium- and Long-Term Actions
Chapter 16 Competition Outlook
- 16.1 Industry Competition Characteristics
- 16.2 Market Structure and Concentration
- 16.3 Market Share and Competitive Positioning, 2024
- 16.4 Company-Wise Revenue and Product Benchmarking
- 16.5 Production and Service Capacity Benchmarking
- 16.6 Technology, Pricing and Differentiation
- 16.7 Regional Footprint and Distribution Strength
- 16.8 Mergers, Acquisitions and Strategic Alliances
- 16.9 New Entrants and Competitive Threats
- 16.10 Porter's Five Forces and Industry Attractiveness
- 16.11 Competitive Outlook, 2024-2032
Chapter 17 Company Profiles
- 17.1 Company Coverage and Selection Criteria
- 17.2 Leading Market Participants – Standard Profile Structure
- 17.2.1 Business Description
- 17.2.2 Company Ownership and Geographic Presence
- 17.2.3 Product and Service Portfolio
- 17.2.4 Manufacturing and Operating Footprint
- 17.2.5 Production Capacity and Expansion Plans
- 17.2.6 Financial Performance and Investment
- 17.2.7 Market Share and Competitive Position
- 17.2.8 Technology and Innovation Capabilities
- 17.2.9 Strategic Alliances or Partnerships
- 17.2.10 Recent Developments
- 17.2.11 Growth Strategy and Outlook
- 17.3 Other Relevant Market Participants
Note: Every listed company is profiled on the structure shown under the first company. The company list is preliminary and may change based on research findings, market developments, data availability and client requirements.
Chapter 18 Disclaimer
- 18.1 Research and Forecast Disclaimer
- 18.2 Data Source and Estimation Limitations
Note: The depth of individual sections depends on data availability for this market. Volume, capacity, trade and other unit-based metrics are included where applicable.

