
Market Overview
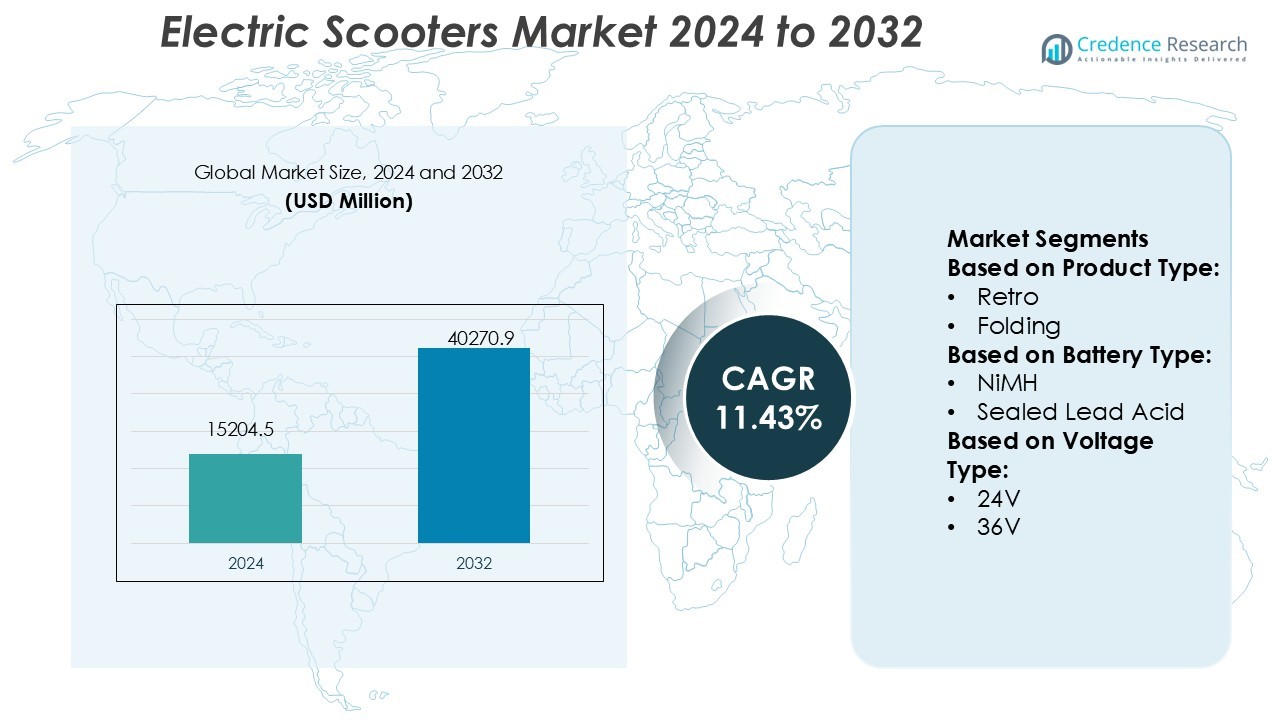
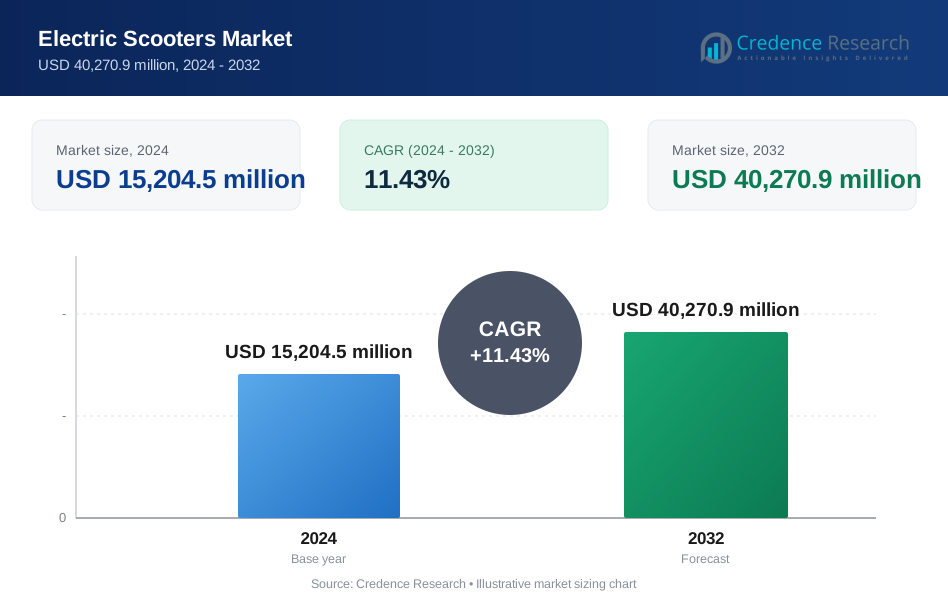
Electric Scooters Market size was valued USD 15204.5 million in 2024 and is anticipated to reach USD 40270.9 million by 2032, at a CAGR of 11.43% during the forecast period.
| REPORT ATTRIBUTE | DETAILS |
|---|---|
| Historical Period | 2020-2023 |
| Base Year | 2024 |
| Forecast Period | 2025-2032 |
| Electric Scooters Market Size 2024 | USD 15204.5 Million |
| Electric Scooters Market, CAGR | 11.43% |
| Electric Scooters Market Size 2032 | USD 40270.9 Million |
The Electric Scooters Market is characterized by strong competition among leading players such as Mahindra GenZe, BOXX Corp., Green Energy Motors Corp., Honda Motor Co. Ltd., Jiangsu Xinri E-Vehicle Co., Ltd., BMW Motorrad International, Greenwit Technologies Inc., Gogoro Inc., KTM AG, and AllCell Technologies LLC. These companies focus on innovation in battery performance, connectivity, and sustainable design to strengthen their global presence. Asia-Pacific leads the global Electric Scooters Market with a 39% share in 2024, driven by high urban density, strong government incentives, and large-scale manufacturing capabilities. The region’s dominance is further supported by growing consumer demand for cost-efficient, eco-friendly transportation and rapid adoption of electric mobility solutions.
Market Insights
- The Electric Scooters Market was valued at USD 15,204.5 million in 2024 and is projected to reach USD 40,270.9 million by 2032, growing at a CAGR of 11.43% during the forecast period.
- Rising urbanization, government incentives, and demand for eco-friendly transport solutions are major drivers boosting market expansion across both developed and emerging economies.
- Key trends include rapid adoption of lithium-ion batteries, integration of IoT-based smart features, and growth in shared mobility services enhancing convenience and accessibility.
- Intense competition among major players focusing on battery innovation, energy efficiency, and affordable pricing continues to shape the industry landscape.
- Asia-Pacific leads the market with a 39% share in 2024, followed by Europe with 28%, while the 36V voltage segment remains dominant due to its optimal balance between performance and cost efficiency, supporting widespread adoption across urban commuting applications.
Market Segmentation Analysis:
By Product Type
Standing/Self-Balancing scooters dominated the Electric Scooters Market with a 42% share in 2024. These scooters gained popularity due to their compact design, low maintenance, and suitability for short-distance urban travel. Rising demand from students and young professionals supports their widespread adoption. Manufacturers are integrating advanced gyroscopic sensors and smart balancing systems, enhancing safety and control. Additionally, the growth of shared mobility services and rental platforms further boosts the standing/self-balancing segment’s market presence across major cities worldwide.
- For instance, BOXX’s “BOXX M” model deploys a three-phase brushless motor that produces 111 Nm torque and uses its all-wheel drive system to grip surfaces under load.
By Battery Type
Li-ion battery scooters held the largest market share of 68% in 2024. Their dominance is driven by lightweight structure, high energy density, and longer lifespan compared to NiMH and sealed lead acid batteries. The segment benefits from falling lithium-ion cell costs and rapid advancements in battery management systems (BMS). Governments promoting clean mobility through subsidies and recycling initiatives also strengthen Li-ion adoption. Continuous innovation in fast-charging technology and higher range per charge keeps this segment at the forefront of electric scooter advancements.
- For instance, Intertek Group plc operates advanced EV battery laboratories globally, offering testing services that include lifecycle, performance, and abuse testing at the cell, module, and pack level. Some of Intertek's battery testing labs are equipped to handle current loads up to 1,200 amperes, and its battery emulators can reach 1,000 volts DC.
By Voltage Type
The 36V segment accounted for the highest share, representing 39% of the Electric Scooters Market in 2024. These scooters offer a balance between performance, efficiency, and affordability, making them ideal for city commuters. The segment’s growth is supported by demand for mid-range scooters with moderate speed and longer runtime. Manufacturers increasingly deploy 36V systems for compact and lightweight models to optimize energy use. Their compatibility with urban transport needs and reduced charging times further position this voltage range as a market leader globally.
Key Growth Drivers
Rising Urbanization and Demand for Efficient Mobility
Rapid urbanization and traffic congestion are fueling the need for compact, energy-efficient vehicles. Electric scooters offer quick mobility and easy parking, making them ideal for short urban commutes. Governments promote e-mobility through subsidies and charging infrastructure, further boosting adoption. The growing preference for eco-friendly transportation, combined with the expansion of shared mobility platforms, continues to drive strong demand for electric scooters across major metropolitan areas worldwide.
- For instance, SGS has expanded battery testing capacity significantly at its Suwanee (Georgia) lab, increasing overall capacity by 20 % and enabling tests on modules/cellblocks rated up to 100 V and 1,200 A.
Technological Advancements in Battery and Motor Efficiency
Advancements in lithium-ion battery technology have improved range, charging speed, and overall performance. Manufacturers are developing lightweight, high-capacity batteries and efficient brushless DC motors, enhancing power output and longevity. Smart connectivity features such as app-based diagnostics and GPS tracking increase user convenience. These innovations reduce maintenance costs and improve ride experience, strengthening market penetration among both individual and fleet users seeking sustainable and high-performing mobility options.
- For instance, Applus+ opened a new EV battery lab at its UK 3C Test centre. The facility features an 11 m³ climatic chamber that operates between –70 °C and +180 °C, which is coupled with a shaker rated at 200 kN for random vibration and 400 kN for shock.
Government Policies Supporting Green Transportation
Governments across regions are implementing strict emission regulations and offering incentives to promote electric mobility. Subsidies for electric vehicle purchases, tax benefits, and investments in public charging networks are accelerating market adoption. Countries like India, China, and the U.S. have launched dedicated e-mobility programs encouraging manufacturers and consumers to transition toward zero-emission vehicles. These policies are creating a favorable ecosystem for electric scooter manufacturing and adoption.
Key Trends & Opportunities
Expansion of Shared Mobility Platforms
The rapid rise of app-based rental and sharing platforms is transforming the electric scooter landscape. Companies like Lime, Bird, and Spin are expanding operations in urban centers, offering affordable and convenient short-distance rides. This shift supports sustainable mobility and reduces dependence on personal vehicles. Growing integration of fleet management and IoT technology enhances operational efficiency and user experience, presenting significant growth opportunities for electric scooter manufacturers and mobility service providers.
- For instance, UL opened its North America Advanced Battery Laboratory in Auburn Hills, Michigan, a 89,000 ft² facility that includes mechanical shock testing up to 100 g acceleration, vibration tables rated at 350 kN and 200 kN, and pack crush capability up to 300 kN force for module and pack tests.
Integration of Smart and Connected Features
Smart connectivity is emerging as a major differentiator in the electric scooter market. Features such as remote locking, mobile tracking, anti-theft alerts, and regenerative braking are becoming standard. Integration with mobile apps enables real-time monitoring of battery life, location, and performance. Manufacturers are also investing in AI-based predictive maintenance and over-the-air updates, enhancing safety and personalization. These technological upgrades attract tech-savvy urban users seeking intelligent commuting solutions.
- For instance, TÜV SÜD manages high-power testing for electric vehicle battery modules, with capabilities extending to 1,200 V and 1,000 A, including environmental, vibration, and abuse tests.
Key Challenges
Limited Charging Infrastructure
Despite strong growth, the lack of widespread and reliable charging infrastructure remains a major hurdle. In many developing regions, inconsistent access to public charging stations limits user confidence and adoption. Range anxiety continues to affect long-distance usage potential. Although portable charging and battery-swapping technologies are emerging, large-scale implementation requires substantial investment and coordination between governments and private stakeholders to ensure sustained market growth.
High Initial Cost of Ownership
The high upfront cost of electric scooters, primarily due to battery expenses, poses a challenge for mass adoption. While operational costs are lower than traditional scooters, many consumers remain price-sensitive. Manufacturers are exploring cost reductions through local sourcing, modular battery systems, and economies of scale. However, until battery prices decrease significantly, affordability will continue to restrict demand, especially in price-conscious markets across Asia-Pacific and Latin America.
Regional Analysis
North America North America accounted for a 24% share of the Electric Scooters Market in 2024. The region’s growth is driven by increasing adoption of eco-friendly mobility solutions and strong expansion of shared scooter services in urban areas. The U.S. leads the market due to rising fuel costs and government support for green transportation. Technological innovations, such as smart connectivity and improved battery life, further enhance demand. Canada is witnessing growing adoption for short-distance commuting, supported by infrastructure investments and sustainability programs across major metropolitan cities.
Europe
Europe held a 28% share of the Electric Scooters Market in 2024, driven by stringent emission regulations and strong government incentives. Countries like Germany, France, and the Netherlands are leading due to their advanced urban transport infrastructure and environmental awareness. The rise in micro-mobility services and expanding charging networks further boost demand. Manufacturers in the region focus on lightweight materials and enhanced battery safety. Increasing consumer preference for sustainable commuting options and smart mobility integration continues to propel Europe’s dominance in the global electric scooter landscape.
Asia-Pacific
Asia-Pacific dominated the Electric Scooters Market with a 39% share in 2024. China, India, and Japan lead the regional growth, driven by high urban population density, cost-effective production, and strong government initiatives promoting electric mobility. The presence of major manufacturers such as Hero Electric and Yadea contributes to large-scale adoption. Government-backed subsidies and infrastructure expansion programs enhance accessibility. Growing demand for affordable, energy-efficient vehicles among urban commuters continues to make Asia-Pacific the largest and fastest-growing regional market for electric scooters globally.
Latin America
Latin America captured a 6% share of the Electric Scooters Market in 2024. The region’s growth is supported by rising fuel prices, increasing environmental awareness, and the introduction of electric vehicle incentives. Brazil and Mexico lead the market due to urban congestion and expanding charging infrastructure. The popularity of shared mobility platforms also encourages adoption. However, limited local manufacturing and high import costs restrain rapid expansion. Continued policy support and partnerships between global manufacturers and local firms are expected to strengthen market presence in the coming years.
Middle East & Africa
The Middle East & Africa accounted for a 3% share of the Electric Scooters Market in 2024. The market is gradually expanding due to government-led sustainability initiatives and the promotion of electric mobility under regional development programs. The UAE and South Africa are emerging as key adopters, focusing on smart city projects and green transport integration. Limited charging infrastructure remains a challenge, but rising investment in renewable energy and pilot programs for e-scooter rentals are creating new growth avenues across urban centers in the region.
Market Segmentations:
By Product Type:
- Retro
- Folding
By Battery Type:
- NiMH
- Sealed Lead Acid
By Voltage Type:
- 24V
- 36V
By Geography
- North America
- U.S.
- Canada
- Mexico
- Europe
- Germany
- France
- U.K.
- Italy
- Spain
- Rest of Europe
- Asia Pacific
- China
- Japan
- India
- South Korea
- South-east Asia
- Rest of Asia Pacific
- Latin America
- Brazil
- Argentina
- Rest of Latin America
- Middle East & Africa
- GCC Countries
- South Africa
- Rest of the Middle East and Africa
Competitive Landscape
The Electric Scooters Market features prominent players including Mahindra GenZe, BOXX Corp., Green Energy Motors Corp., Honda Motor Co. Ltd., Jiangsu Xinri E-Vehicle Co., Ltd., BMW Motorrad International, Greenwit Technologies Inc., Gogoro Inc., KTM AG, and AllCell Technologies LLC. The Electric Scooters Market is marked by rapid innovation, strategic partnerships, and expanding global footprints. Companies are focusing on enhancing battery efficiency, motor performance, and connectivity features to strengthen their market position. Advancements in lithium-ion technology, lightweight materials, and IoT integration have improved range and durability, attracting a broader consumer base. Manufacturers are also investing in sustainable production methods and local assembly to reduce costs and meet regulatory requirements. The competition remains intense, with firms emphasizing design innovation, digital integration, and after-sales support to capture market share and enhance brand loyalty.
Key Player Analysis
- Mahindra GenZe
- BOXX Corp.
- Green Energy Motors Corp.
- Honda Motor Co. Ltd.
- Jiangsu Xinri E-Vehicle Co., Ltd.
- BMW Motorrad International
- Greenwit Technologies Inc.
- Gogoro Inc.
- KTM AG
- AllCell Technologies LLC
Recent Developments
- In July 2025, the Kinetic DX electric scooter in India is priced at Rs 1.11 lakh (ex-showroom) and Rs 1.17 lakh (ex-showroom), with bookings limited to 35,000 units via the Kinetic EV website. Delivery starts in September 2025.
- In January 2025, Yadea, has already launched multiple models powered by sodium-ion chemistry and is rapidly expanding related infrastructure with plans for thousands of fast charging and battery swap stations.
- In January 2024, Riley Scooter, a Cambridge-based company proposed plans to introduce RS3 Electric Scooter, a fully foldable electric scooter in the U.S. at the Consumers Electronics Show held in Las Vegas.
- In December 2023, Gogoro, a Taiwanese player unveiled Gogoro CrossOver GX250 domestically produced electric scooter in India. The company offers a tailor smart scooter to Indian riders. The introduction of these models marked a strategic move for Komatsu to tap into the Indian electric scooter market.
Report Coverage
The research report offers an in-depth analysis based on Product Type, Battery Type, Voltage Type and Geography. It details leading market players, providing an overview of their business, product offerings, investments, revenue streams, and key applications. Additionally, the report includes insights into the competitive environment, SWOT analysis, current market trends, as well as the primary drivers and constraints. Furthermore, it discusses various factors that have driven market expansion in recent years. The report also explores market dynamics, regulatory scenarios, and technological advancements that are shaping the industry. It assesses the impact of external factors and global economic changes on market growth. Lastly, it provides strategic recommendations for new entrants and established companies to navigate the complexities of the market.
Future Outlook
- The Electric Scooters Market will continue expanding due to rising urban mobility demand.
- Government incentives and emission regulations will further encourage electric vehicle adoption.
- Advancements in battery technology will extend range and reduce charging time.
- Shared mobility platforms will play a key role in driving market penetration.
- Smart connectivity and IoT integration will enhance user experience and fleet management.
- Manufacturers will focus on lightweight designs and cost-efficient production methods.
- Expansion in charging infrastructure will improve accessibility and reduce range anxiety.
- Asia-Pacific will remain the leading region, supported by strong manufacturing and policy support.
- Partnerships between automakers and technology firms will accelerate innovation and scalability.
- Growing consumer awareness of sustainability will strengthen long-term electric scooter adoption.
Request a Free Sample
Fill in your details and we'll send you a free sample report.
- Sample data tables & charts
- Research methodology
Need a Custom Version of This Report?
Tailor the scope, geography, or segments to your exact requirements.
- Custom geography or segment scope
- Direct access to our analyst team
Frequently Asked Questions
What is the current market size for the Electric Scooters Market, and what is its projected size in 2032?
At what Compound Annual Growth Rate is the Electric Scooters Market projected to grow between 2025 and 2032?
Which Electric Scooters Market segment held the largest share in 2024?
What are the primary factors fueling the growth of the Electric Scooters Market?
Who are the leading companies in the Electric Scooters Market?
Which region commanded the largest share of the Electric Scooters Market in 2024?
Table of Content
Chapter 1. Report Introduction
- 1.1 Report Description & Purpose
- 1.1.1 Report Title & Market Definition
- 1.1.2 Unique Selling Propositions (USP) & Key Differentiators
- 1.1.3 Value Proposition for Stakeholders
- 1.2 Research Objectives
- 1.2.1 Market Sizing Objectives (Volume & Revenue) (Volume Where Applicable)
- 1.2.2 Segmentation Objectives
- 1.2.3 Competitive Intelligence Objectives
- 1.2.4 Forecast & Scenario Objectives
- 1.3 Report Scope
- 1.3.1 Electric Scooters Scope – Segments & Subsegments Covered
- 1.3.2 Geographic Scope – Regions & Countries Covered
- 1.3.3 Historical Period, Base Year & Forecast Period (2024; forecast to 2032)
- 1.3.4 Inclusions & Exclusions
- 1.4 Industry Classification & Applicable Codes
- 1.5 Currency, Measurement Units & Valuation Basis
- 1.6 Target Stakeholders
- 1.7 Limitations & Assumptions
Chapter 2. Executive Summary
- 2.1 Global Electric Scooters Market Snapshot
- 2.1.1 Market Size – Historical (2024) & Forecast (2024-2032) (2024: USD 15,204.5 million → 2032: USD 40,270.9 million)
- 2.1.2 Volume & Revenue – Global Totals (Volume Where Applicable)
- 2.1.3 Key Market Highlights – Top Five Facts
- 2.2 Electric Scooters Market Segmentation Snapshot
- 2.2.1 Market Split by Region – 2024 vs. 2032
- 2.3 Competitive Snapshot
- 2.3.1 Top 10 Players by Revenue Share – 2024
- 2.3.2 Top 10 Players by Volume Share – 2024 (Volume Where Applicable)
- 2.3.3 Recent Strategic Developments (18-Month Summary)
- 2.4 Key Investment Highlights & Strategic Conclusions
Chapter 3. Electric Scooters Market Dynamics & Industry Analysis
- 3.1 Market Overview & Context
- 3.1.1 Electric Scooters Market Position in the Broader Industry Value Chain
- 3.1.2 Demand Structure & Purchasing Dynamics
- 3.1.3 Market Maturity & Development Stage by Region
- 3.2 Electric Scooters Market Drivers
- 3.3 Electric Scooters Market Restraints & Challenges
- 3.4 Electric Scooters Market Opportunities
- 3.5 Porter's Five Forces Analysis
- 3.5.1 Threat of New Entrants
- 3.5.2 Bargaining Power of Suppliers
- 3.5.3 Bargaining Power of Buyers
- 3.5.4 Threat of Substitutes
- 3.5.5 Competitive Rivalry – Intensity Assessment
- 3.6 Electric Scooters Value Chain Analysis
- 3.6.1 Upstream – Key Inputs, Resources & Suppliers
- 3.6.1.1 Key Input/Resource 1
- 3.6.1.2 Key Input/Resource 2
- 3.6.1.3 Key Input/Resource 3
- 3.6.2 Midstream – Core Operations & Value Creation
- 3.6.2.1 Operating Model & Process Overview
- 3.6.2.2 Key Operating Locations & Capabilities by Company
- 3.6.3 Downstream – Market Channels & End Users
- 3.6.3.1 Direct Sales & Customer Engagement Channels
- 3.6.3.2 Indirect Sales, Intermediaries & Partner Channels
- 3.6.4 Value Chain Profitability Analysis
- 3.6.1 Upstream – Key Inputs, Resources & Suppliers
- 3.7 PESTEL Analysis
- 3.7.1 Political Factors
- 3.7.2 Economic Factors
- 3.7.3 Social Factors
- 3.7.4 Technological Factors
- 3.7.5 Environmental Factors
- 3.7.6 Legal Factors
- 3.8 Electric Scooters Supply Chain Analysis
- 3.8.1 Critical Input & Resource Availability Risk Assessment
- 3.8.2 Supplier & Operational Concentration Risk (Geographic Exposure)
- 3.8.3 Supply & Service Disruption Impact Analysis
- 3.9 Regulatory & Policy Landscape
Note: The regulatory and policy landscape section covers regulations based on their applicability to the market, Electric Scooters category, geography, and scope of the study. Only regulatory frameworks with a material impact on operations, compliance, trade, sustainability, or market access are analyzed in detail.
Chapter 4. Key Investment Pockets & Opportunity Analysis
- 4.1 Electric Scooters Market Attractiveness Analysis
- 4.1.1 By Region – Investment Attractiveness Matrix (Market Size × CAGR)
- 4.2 Absolute Revenue Growth Opportunity
- 4.2.1 By Region – Absolute Revenue Growth Through 2032
- 4.3 Incremental Demand Opportunity
- 4.3.1 By Region – Incremental Demand Through 2032
- 4.3.2 Segment – Incremental Demand
- 4.4 Emerging Submarket Opportunity Deep Dive (Subject to Applicability)
- 4.5 Priority Market Opportunity Scorecards
- 4.5.1 United States
- 4.5.2 Europe
- 4.5.3 Asia
- 4.5.4 Middle East & Africa
Note: Priority market opportunity scorecards reflect the geographic scope and strategic relevance of the study. Listed markets are indicative and may be adapted to the industry.
Chapter 5. Electric Scooters Cross-Border Trade & Market Access Analysis
- 5.1 International Trade & Cross-Border Activity Overview
- 5.1.1 Global Export Value by Country (2024)
- 5.1.2 Global Export Volume by Country (2024) (Volume Where Applicable)
- 5.1.3 Global Import Value by Country (2024)
- 5.1.4 Global Import Volume by Country (2024) (Volume Where Applicable)
- 5.1.5 Net Trade Balance by Country (2024)
- 5.2 Export Analysis – Segment
- 5.2.1 Category 1 (Applicable Classification Code)
- 5.2.2 Category 2 (Applicable Classification Code)
- 5.2.3 Category 3 (Applicable Classification Code)
- 5.2.4 Category 4 (Applicable Classification Code)
- 5.2.5 Category 5 (Applicable Classification Code)
- 5.3 Import Analysis – Segment
- 5.3.1 Category 1 (Applicable Classification Code)
- 5.3.2 Category 2 (Applicable Classification Code)
- 5.3.3 Category 3 (Applicable Classification Code)
- 5.3.4 Category 4 (Applicable Classification Code)
- 5.3.5 Category 5 (Applicable Classification Code)
- 5.4 Cross-Border Pricing & Transaction Benchmarks
- 5.4.1 Export Pricing – Segment & Country
- 5.4.2 Import Pricing – Segment & Source Country
- 5.4.3 Price Trends (2024)
- 5.5 Key Cross-Border Trade & Delivery Routes
- 5.5.1 Cross-Border Trade/Delivery Route 1
- 5.5.2 Cross-Border Trade/Delivery Route 2
- 5.5.3 Cross-Border Trade/Delivery Route 3
- 5.5.4 Cross-Border Trade/Delivery Route 4
- 5.5.5 Cross-Border Trade/Delivery Route 5
- 5.6 Trade Policy & Market Access Impact Assessment
- 5.6.1 Tariff & Non-Tariff Barriers
- 5.6.2 Regional Trade & Economic Integration Frameworks
- 5.6.3 Bilateral & Multilateral Trade Agreements
- 5.6.4 Cross-Border Operating, Licensing & Localization Requirements
Note: This chapter applies where cross-border trade or delivery is relevant to Electric Scooters. Goods, services, and digital offerings are assessed using applicable classifications and transaction measures. Import-export volumes, trade balances, and route analyses are included only where meaningful to the market.
Chapter 6. Competitive Landscape & Company Benchmarking
- 6.1 Electric Scooters Market Concentration & Structure
- 6.1.1 Herfindahl-Hirschman Index (HHI) – vs. 2024
- 6.1.2 Leading, Mid-Sized & Emerging Player Structure
- 6.1.3 Global, Regional & Local Player Dynamics
- 6.2 Electric Scooters Market Share Analysis – 2024
- 6.2.1 Global Revenue Share by Company
- 6.2.2 Global Volume Share by Company (Volume Where Applicable)
- 6.2.3 Regional Revenue Share
- 6.2.4 Market Share Evolution ( vs. 2024)
- 6.2.5 Company Market Share by Key Segment
- 6.2.6 Company Market Share by Customer Group
- 6.3 Operating Scale, Capacity & Infrastructure Analysis
- 6.3.1 Global Operating Scale & Supply Capacity
- 6.3.2 Resource Utilization & Operating Efficiency
- 6.3.3 Output, Service Delivery & Activity Metrics
- 6.3.4 Operating Footprint & Infrastructure Map
- 6.3.5 Planned Operational & Capacity Expansion
- 6.4 Electric Scooters Competitive Benchmarking Matrix
- 6.4.1 Revenue, Growth, Profitability & Operating Metric Comparison
- 6.4.2 Channel Revenue Mix
- 6.4.3 Geographic Revenue Exposure
- 6.4.4 R&D Intensity
- 6.4.5 Sustainability Maturity
- 6.5 Strategic Developments in Electric Scooters (Last 24 Months)
- 6.5.1 Mergers, Acquisitions & Divestments
- 6.5.2 New Products, Services & Solutions in Electric Scooters
- 6.5.3 Operational & Infrastructure Expansions
- 6.5.4 Strategic Alliances, Joint Ventures & Partnerships
- 6.5.5 Distribution Expansion & Market Entry
- 6.5.6 Sustainability & ESG Initiatives
- 6.6 Competitive Strategy Mapping
- 6.6.1 Leader, Challenger, Follower & Niche Classification
- 6.6.2 Pricing Strategy Comparison
- 6.6.3 Channel Strategy Matrix
Note: Strategic developments are included based on their materiality and the availability of reliable information.
Chapter 7. Global Electric Scooters Market – By Sales & Delivery Channel
- 7.1 Segment Overview
- 7.1.1 Volume & Revenue Split by Channel (2024 & 2032) (Volume Where Applicable)
- 7.1.2 Channel Mix Evolution (2024-2032)
Chapter 8. Regional Market Analysis – Global Overview
- 8.1 Global Regional Overview
- 8.1.1 Regional Volume Share (Volume Where Applicable)
- 8.1.2 Regional Revenue Share
- 8.1.3 Regional Volume by Region (Volume Where Applicable)
- 8.1.4 Regional Revenue by Region
- 8.1.5 Regional Forecast Through 2032
- 8.2 Cross-Regional Segment Analysis
- 8.2.1 By Sales & Delivery Channel
- 8.2.2 By Competitive Positioning & Price Tier
Chapter 9. North America Electric Scooters Market
- 9.1 United States
- 9.2 Canada
- 9.3 Mexico
Chapter 10. Europe Electric Scooters Market
- 10.1 Germany
- 10.2 France
- 10.3 Italy
- 10.4 United Kingdom
- 10.5 Spain
- 10.6 Poland
- 10.7 Russia
- 10.8 Netherlands
- 10.9 Belgium
- 10.10 Sweden
- 10.11 Denmark
- 10.12 Norway
- 10.13 Rest of Europe
Chapter 11. Asia Pacific Electric Scooters Market
- 11.1 China
- 11.2 India
- 11.3 Japan
- 11.4 South Korea
- 11.5 Thailand
- 11.6 Indonesia
- 11.7 Vietnam
- 11.8 Malaysia
- 11.9 Australia
- 11.10 Rest of Asia Pacific
Chapter 12. Latin America Electric Scooters Market
- 12.1 Brazil
- 12.2 Argentina
- 12.3 Colombia
- 12.4 Chile
- 12.5 Rest of Latin America
Chapter 13. Middle East Electric Scooters Market
- 13.1 Saudi Arabia
- 13.2 United Arab Emirates
- 13.3 Turkey
- 13.4 Israel
- 13.5 Iran
- 13.6 Rest of the Middle East
Chapter 14. Africa Electric Scooters Market
- 14.1 South Africa
- 14.2 Egypt
- 14.3 Nigeria
- 14.4 Morocco
- 14.5 Rest of Africa
Chapter 15. Electric Scooters Company Profiles
- 15.1 [Company 01]
- 15.1.1 Company Overview
- 15.1.2 Key Management Personnel
- 15.1.3 Products & Services Portfolio
- 15.1.4 Financial Performance
- 15.1.5 Key Market Focus & Geographic Presence
- 15.1.6 Recent Developments & Strategic Initiatives
Note: The company profile list is preliminary and may change based on research findings, market developments, data availability, and client requirements.
Chapter 16. Appendices
- Appendix A – List of Abbreviations & Acronyms
- Appendix B – Industry Classification Code Reference – Full Series
- Appendix C – Supply, Output & Operating Capacity Data Tables
- Appendix D – End-Use & Demand Base Tables
- Appendix E – Demand, Adoption & Usage Assumptions
- Appendix F – Pricing & Revenue Metric Reference Tables
- Appendix G – Company Operations & Infrastructure Database
- Appendix H – Cross-Border Trade & Activity Data Tables (Where Applicable)
- Appendix I – Regulatory Summary Tables
- Appendix J – Primary Research Participant List (Anonymized)
- Appendix K – Primary Research Questionnaire Framework
- Appendix L – Data Sources & Bibliography
- Appendix M – Market Size Divergence & Source Comparison
Chapter 17. Research Methodology
- 17.1 Research Framework & Philosophy
- 17.2 Secondary Research – Sources, Hierarchy & Data Extraction
- 17.3 Data Modeling – Bottom-Up & Top-Down Market Sizing
- 17.4 Primary Research – Stakeholder Framework, LOI & Sample Sizes
- 17.5 Forecast Methodology – Regression, Scenario & Sensitivity Analysis
- 17.6 Quality Control – Four-Layer Validation Framework
- 17.7 Limitations & Standard Assumptions
- 17.8 Disclaimer
