Market Overview
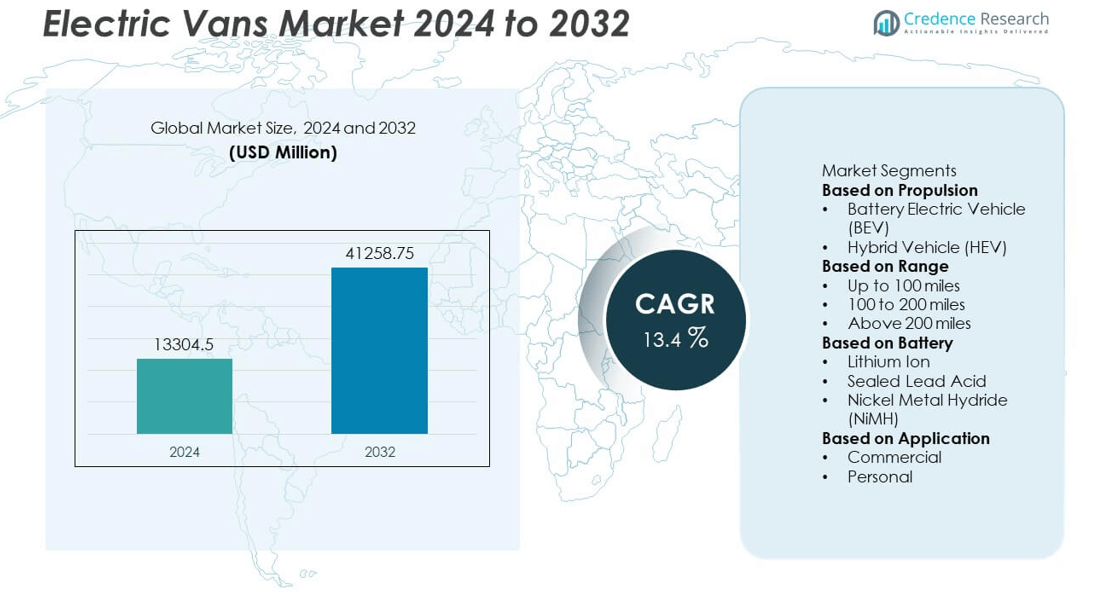
The Electric Vans Market was valued at USD 13,304.5 million in 2024 and is projected to reach USD 41,258.75 million by 2032, growing at a CAGR of 13.4% during the forecast period.
| REPORT ATTRIBUTE |
DETAILS |
| Historical Period |
2020-2023 |
| Base Year |
2024 |
| Forecast Period |
2025-2032 |
| Electric Vans Market Size 2024 |
USD 13,304.5 million |
| Electric Vans Market, CAGR |
13.4% |
| Electric Vans Market Size 2032 |
USD 41,258.75 million |
The Electric Vans Market is led by major players such as Rivian, MAN, Renault, BYD Singapore, Ford Motor Company, Stellantis Europe S.p.A., Mercedes-Benz USA, LLC, Volkswagen, and Nissan. These companies dominate through continuous advancements in battery technology, range optimization, and sustainable vehicle design. Manufacturers are focusing on expanding production capacity and forming strategic partnerships with logistics providers to meet rising global demand. Europe led the market in 2024 with a 35% share, driven by strict emission standards and strong government incentives, followed by North America with 33% and Asia-Pacific with 26%, supported by large-scale electric vehicle manufacturing and expanding charging infrastructure.
Market Insights
- The Electric Vans Market was valued at USD 13,304.5 million in 2024 and is projected to reach USD 41,258.75 million by 2032, growing at a CAGR of 13.4% during the forecast period.
- Growth is driven by rising demand for zero-emission commercial fleets, government incentives, and the rapid expansion of e-commerce logistics networks.
- Market trends highlight the integration of advanced lithium-ion batteries, fast-charging technology, and connected fleet management systems for efficient operations.
- Leading companies such as Ford Motor Company, Rivian, Mercedes-Benz, and Renault are focusing on R&D, expanding production capacity, and strategic collaborations with logistics operators.
- Europe led the market with a 35% share, followed by North America at 33% and Asia-Pacific at 26%, while the Battery Electric Vehicle (BEV) segment dominated with a 68% share due to its high efficiency, low maintenance cost, and compliance with stringent emission norms.
Access crucial information at unmatched prices!
Request your sample report today & start making informed decisions powered by Credence Research Inc.!
Download Sample
Market Segmentation Analysis:
By Propulsion
The Battery Electric Vehicle (BEV) segment dominated the Electric Vans Market in 2024 with a 68% market share. This dominance is driven by the rising adoption of zero-emission transport solutions across logistics and passenger mobility sectors. BEVs offer higher energy efficiency, lower maintenance costs, and improved range capabilities compared to hybrid models. Government incentives, emission regulations, and advancements in charging infrastructure continue to support BEV growth. Leading manufacturers such as Mercedes-Benz, Ford, and Rivian are expanding their electric van portfolios to meet growing demand for sustainable fleet operations.
- For instance, Mercedes-Benz introduced its new eSprinter Long Range variant equipped with a 113 kWh battery pack and 400V architecture. According to the Worldwide Harmonised Light Vehicle Test Procedure (WLTP) cycle, this variant provides a range of up to 440 kilometers per charge, although actual range can vary depending on conditions like driving style and vehicle load.
By Range
The 100 to 200 miles range segment accounted for a 54% market share in 2024, reflecting its suitability for urban and regional delivery operations. This range offers the best balance between cost, battery capacity, and daily fleet requirements. Medium-range vans are preferred by logistics providers, postal services, and ride-hailing companies for efficient city commutes. Continuous improvements in lithium-ion battery technology and charging networks are enabling higher operational uptime. The segment’s affordability and practicality make it the leading choice for commercial applications.
- For instance, Ford Motor Company’s E-Transit Standard Range van features a usable 68 kWh lithium-ion battery. Depending on the configuration, it is available with a 135 kW or 198 kW electric motor. The WLTP combined driving range is up to 315 km (196 miles), though real-world range can vary.
By Battery
The lithium-ion battery segment held a 72% market share in 2024, dominating the Electric Vans Market due to its superior energy density, longer lifespan, and faster charging capabilities. These batteries support extended driving ranges and consistent performance under heavy-duty use. Automakers are increasingly adopting lithium-ion systems for their lightweight and low-maintenance benefits. Major players such as BYD and Stellantis are investing in advanced battery chemistries and recycling initiatives to improve sustainability. The segment’s efficiency, coupled with declining production costs, continues to reinforce its leadership in powering electric vans globally.
Key Growth Drivers
Rising Demand for Zero-Emission Commercial Fleets
Growing environmental awareness and stricter emission regulations are accelerating the adoption of electric vans globally. Logistics and delivery companies are transitioning to electric fleets to meet sustainability goals and reduce fuel costs. Governments in major economies offer tax incentives, rebates, and grants to encourage fleet electrification. With expanding e-commerce and last-mile delivery needs, electric vans provide an efficient, low-emission solution for urban transport. This shift toward cleaner mobility is a major driver fueling steady growth in the global electric van market.
- For instance, Amazon’s electric delivery fleet, which includes vans from Rivian, has expanded significantly, with over 25,000 custom-made vans operating across the U.S. as of mid-2025.
Advancements in Battery and Charging Technologies
Continuous improvements in lithium-ion and solid-state batteries are extending vehicle range and reducing charging times. High energy density, enhanced safety, and declining battery costs are making electric vans more practical for daily operations. The expansion of fast-charging networks across cities further supports fleet adoption. Manufacturers are investing in modular battery packs and advanced energy management systems to improve vehicle efficiency. These innovations are addressing range anxiety and operational downtime, making electric vans increasingly viable for commercial and logistics applications.
- For instance, Stellantis developed its next-generation STLA Medium battery platform with a usable energy capacity of up to 98 kWh, delivering a vehicle range of more than 700 kilometers (435 miles).
Government Support and Electrification Policies
Global governments are implementing strong policies to promote electric mobility through purchase subsidies, emission regulations, and fleet electrification mandates. Programs such as the EU’s Green Deal, China’s NEV initiative, and the U.S. Inflation Reduction Act are incentivizing large-scale adoption. Municipalities are introducing low-emission zones, driving logistics operators to invest in cleaner transport alternatives. Combined with corporate sustainability targets, these policy measures are creating a favorable ecosystem for the expansion of electric vans across commercial and passenger transport segments.
Key Trends & Opportunities
Expansion of E-Commerce and Last-Mile Delivery
The rapid growth of e-commerce is driving demand for efficient, sustainable delivery vehicles. Electric vans are becoming the preferred choice for last-mile logistics due to their low operating costs and compliance with urban emission zones. Companies like Amazon and UPS are deploying large electric van fleets to achieve net-zero goals. The shift toward shorter delivery cycles and digital commerce continues to create significant opportunities for manufacturers offering high-performance, cost-effective electric delivery vehicles.
- For instance, DHL utilizes the StreetScooter Work XL electric van, which has a battery capacity of up to 76 kWh. This model, based on a Ford Transit chassis, has a range of up to 200 kilometers (NEDC) and a payload of up to 1,275 kilograms.
Integration of Connected and Autonomous Technologies
Electric vans are increasingly being equipped with smart connectivity and driver-assistance systems. Features such as telematics, predictive maintenance, and route optimization enhance fleet management efficiency. Automakers are integrating ADAS and autonomous capabilities to improve safety and reduce driver fatigue. These connected solutions not only enhance performance but also lower operational costs. As logistics operators prioritize digitalized fleet management, integration of intelligent systems will create new growth opportunities for electric van manufacturers.
- For instance, Rivian developed its FleetOS digital platform for its commercial vans, which collects and analyzes over 2 terabytes of vehicle data per day across fleet operations. The system integrates autonomous driver-assist functions, including lane-centering and adaptive braking, while enabling fleet managers to monitor energy use, vehicle health, and route efficiency through a centralized cloud dashboard, improving uptime and delivery accuracy.
Key Challenges
High Initial Cost and Limited Model Availability
Despite lower operating expenses, the high upfront cost of electric vans remains a significant barrier to adoption. Battery packs account for a large portion of total vehicle cost, making EVs more expensive than diesel counterparts. Additionally, limited model options in certain load capacities and regions restrict buyer choices. While prices are gradually decreasing with technological advancements, affordability remains a key challenge for small and medium fleet operators, slowing mass adoption across emerging markets.
Insufficient Charging Infrastructure and Range Constraints
Lack of adequate charging infrastructure continues to hinder widespread adoption, particularly in rural and developing regions. Commercial fleets often face limited access to high-speed chargers, impacting delivery efficiency and uptime. Range limitations also restrict the usability of electric vans for long-haul operations. Governments and private players are investing in charging corridors and depot-based solutions, but infrastructure development remains uneven. Addressing these limitations is essential for ensuring consistent operational reliability and supporting large-scale fleet electrification.
Regional Analysis
North America
North America held a 33% market share in 2024, driven by growing adoption of electric vans across logistics, delivery, and municipal fleets. The U.S. leads the region with strong policy support under the Inflation Reduction Act, offering incentives for fleet electrification. Companies like Ford and Rivian are expanding production to meet commercial demand from e-commerce players such as Amazon and FedEx. The rapid development of fast-charging networks and increasing investments in battery technology further support regional growth. Rising sustainability goals and corporate electrification commitments continue to strengthen North America’s leadership in the electric van market.
Europe
Europe accounted for a 35% market share in 2024, supported by strict emission regulations and ambitious decarbonization targets. Countries such as Germany, the Netherlands, and the United Kingdom are driving adoption through subsidies, tax benefits, and the introduction of zero-emission zones. Automakers like Mercedes-Benz, Renault, and Volkswagen dominate the regional market with extensive electric van portfolios. Expanding charging infrastructure and the growing presence of shared mobility and last-mile delivery services enhance demand. The region’s commitment to climate-neutral transport and technological innovation ensures steady growth in electric van deployment.
Asia-Pacific
Asia-Pacific captured a 26% market share in 2024, led by rapid industrialization, urbanization, and strong government initiatives supporting EV production. China remains the dominant contributor due to large-scale manufacturing and domestic adoption, driven by brands like BYD and SAIC Motor. Japan, South Korea, and India are also expanding investments in electric mobility infrastructure. The rising need for urban logistics, e-commerce delivery, and sustainable transport fuels regional demand. Favorable government policies, improving charging networks, and declining battery costs continue to position Asia-Pacific as one of the fastest-growing regions for electric vans.
Latin America
Latin America held a 4% market share in 2024, reflecting early-stage adoption driven by environmental policies and urban delivery electrification. Countries such as Brazil, Mexico, and Chile are investing in EV incentives and localized assembly to promote sustainable transport. Fleet operators are gradually adopting electric vans for logistics and public service applications to reduce fuel costs. Despite limited charging infrastructure, partnerships between regional distributors and global automakers are expanding vehicle availability. Continued government focus on renewable energy and emission reduction targets is expected to drive moderate yet steady growth across the region.
Middle East & Africa
The Middle East and Africa accounted for a 2% market share in 2024, with adoption primarily concentrated in the UAE, Saudi Arabia, and South Africa. The region’s growth is supported by national sustainability goals, smart city initiatives, and increasing investments in EV infrastructure. Electric vans are gaining traction in delivery, airport logistics, and urban mobility operations. High fuel prices and favorable regulatory frameworks are encouraging commercial fleet electrification. Although infrastructure remains limited, ongoing partnerships with global manufacturers and energy providers are expected to gradually expand electric van adoption across key urban markets.
Market Segmentations:
By Propulsion
- Battery Electric Vehicle (BEV)
- Hybrid Vehicle (HEV)
By Range
- Up to 100 miles
- 100 to 200 miles
- Above 200 miles
By Battery
- Lithium Ion
- Sealed Lead Acid
- Nickel Metal Hydride (NiMH)
By Application
By Geography
- North America
- Europe
- Germany
- France
- U.K.
- Italy
- Spain
- Rest of Europe
- Asia Pacific
- China
- Japan
- India
- South Korea
- South-east Asia
- Rest of Asia Pacific
- Latin America
- Brazil
- Argentina
- Rest of Latin America
- Middle East & Africa
- GCC Countries
- South Africa
- Rest of the Middle East and Africa
Competitive Landscape
The competitive landscape of the Electric Vans Market includes key players such as Rivian, MAN, Renault, BYD Singapore, Ford Motor Company, Stellantis Europe S.p.A., Mercedes-Benz USA, LLC, Volkswagen, and Nissan. These companies are actively expanding their electric van portfolios to cater to the growing demand for zero-emission commercial transport. Manufacturers are investing in advanced battery technologies, fast-charging capabilities, and lightweight designs to improve range and efficiency. Strategic collaborations with logistics providers and government-backed fleet programs are strengthening their market positions. Companies are also focusing on cost reduction, digital connectivity, and modular architecture to enhance operational flexibility. Increasing competition in the sector is driving innovation, with automakers targeting diverse applications such as urban logistics, passenger shuttles, and last-mile delivery. Continuous advancements in product performance and expanding production capacities are expected to accelerate the global adoption of electric vans in the coming years.
Shape Your Report to Specific Countries or Regions & Enjoy 30% Off!
Key Player Analysis
- Rivian
- MAN
- Renault
- BYD Singapore
- Ford Motor Company
- Stellantis Europe S.p.A.
- Mercedes-Benz USA, LLC
- Volkswagen
- Nissan
- Stellantis
Recent Developments
- In 2025, Renault unveiled the Trafic E-Tech Electric in France, equipped with a 90 kW electric motor and 52 kWh battery, providing a range of 297 kilometers per charge. The van supports both DC fast charging at 50 kW and AC charging at 22 kW for fleet flexibility.
- In 2024, Ford Motor Company expanded its E-Transit production in Kansas City, increasing annual capacity to over 150,000 units. The latest variant includes a 198 kW electric motor and supports DC fast charging up to 115 kW, targeting the growing e-commerce delivery market.
- In 2024, Rivian expanded production of its Electric Delivery Van (EDV) lineup for Amazon, surpassing 20,000 units delivered across North America
Report Coverage
The research report offers an in-depth analysis based on Propulsion, Range, Battery, Application and Geography. It details leading market players, providing an overview of their business, product offerings, investments, revenue streams, and key applications. Additionally, the report includes insights into the competitive environment, SWOT analysis, current market trends, as well as the primary drivers and constraints. Furthermore, it discusses various factors that have driven market expansion in recent years. The report also explores market dynamics, regulatory scenarios, and technological advancements that are shaping the industry. It assesses the impact of external factors and global economic changes on market growth. Lastly, it provides strategic recommendations for new entrants and established companies to navigate the complexities of the market.
Future Outlook
- The electric vans market will grow steadily as fleet operators transition to zero-emission vehicles.
- Advances in battery technology will enhance driving range, charging speed, and overall performance.
- Governments will continue to support adoption through subsidies, tax benefits, and emission regulations.
- Manufacturers will focus on lightweight materials and modular designs to improve efficiency and payload capacity.
- Integration of smart connectivity and telematics will optimize fleet management and route planning.
- Expanding e-commerce and last-mile delivery networks will drive large-scale electric van deployment.
- Public and private investments will accelerate the development of fast-charging infrastructure.
- Strategic partnerships between automakers and logistics providers will strengthen global market presence.
- Asia-Pacific will experience rapid growth due to strong government support and EV production expansion.
- Continuous innovation in design, range, and digital features will shape the next generation of electric vans.


