Market Overview
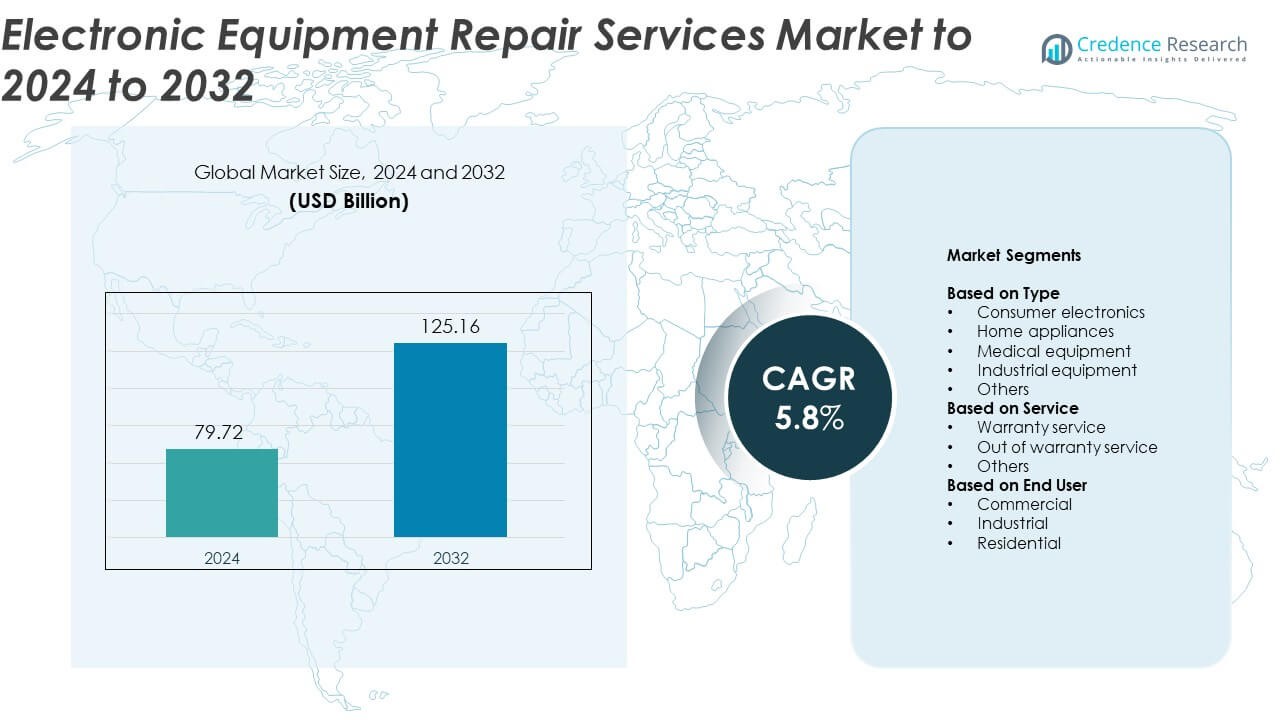
The Electronic Equipment Repair Services Market size was valued at USD 79.72 Billion in 2024 and is anticipated to reach USD 125.16 Billion by 2032, at a CAGR of 5.8% during the forecast period.
| REPORT ATTRIBUTE |
DETAILS |
| Historical Period |
2020-2023 |
| Base Year |
2024 |
| Forecast Period |
2025-2032 |
| Electronic Equipment Repair Service Market Size 2024 |
USD 79.72 Billion |
| Electronic Equipment Repair Service Market, CAGR |
5.8% |
| Electronic Equipment Repair Service Market Size 2032 |
USD 125.16 Billion |
The electronic equipment repair services market is shaped by key players such as Mendtronix Inc., Redington Services, Encompass Supply Chain Solutions, Inc., B2X Care Solutions GmbH, The Cableshoppe Inc. (CSI), uBreakiFix (Asurion LLC), Quest International, Inc., Moduslink Global Solutions, Electronix Services Ltd., Parts Town, and iCracked, Inc. (Square Trade). These companies dominate through wide service portfolios, advanced repair capabilities, and strong regional networks. North America leads the market with a 37% share in 2024, driven by high electronic device adoption and structured service systems. Europe follows with 29% share, supported by sustainability-focused repair initiatives, while Asia Pacific captures 24% share, reflecting growing demand from cost-conscious consumers.
Access crucial information at unmatched prices!
Request your sample report today & start making informed decisions powered by Credence Research Inc.!
Download Sample
Market Insights
- The electronic equipment repair services market was valued at USD 79.72 Billion in 2024 and is projected to reach USD 125.16 Billion by 2032, growing at a CAGR of 5.8%.
- Rising ownership of smartphones, laptops, and appliances is fueling demand for repair and maintenance services, with consumer electronics accounting for 46% of total market share.
- Growing focus on sustainability and the circular economy is driving adoption of repair-friendly policies and eco-efficient service models.
- The market is moderately fragmented, with companies expanding after-sales networks and integrating AI-based diagnostic tools to enhance service efficiency.
- North America leads with 37% share, followed by Europe at 29% and Asia Pacific at 24%, driven by robust digital infrastructure, environmental regulations, and increasing demand for affordable repair options.
Market Segmentation Analysis:
By Type
Consumer electronics dominate the electronic equipment repair services market, accounting for nearly 46% share in 2024. The dominance stems from the rising ownership of smartphones, laptops, and televisions that require frequent maintenance and part replacement. Rapid product innovation and shorter device lifecycles have increased demand for repair services. Growing e-waste concerns and the push for circular economy models are encouraging users to repair rather than replace devices. Expanding after-sales networks by manufacturers and independent service providers further strengthen the segment’s position in the global market.
- For instance, Apple operates 5,000+ Authorized Service Providers worldwide, supporting device repairs.
By Service
Out of warranty service leads the market with around 57% share in 2024. The growth is driven by the increasing number of electronic devices that exceed their warranty period but remain functional. Consumers prefer independent or third-party repair centers due to affordable pricing and accessibility. The rising cost of new electronics and greater awareness about repair rights also support this segment. Expanding availability of skilled technicians and certified spare parts enhances the reliability of out-of-warranty repair solutions globally.
- For instance, uBreakiFix by Asurion designated 50 flagship Samsung repair locations across the US.
By End User
The commercial segment holds the largest market share of approximately 48% in 2024. Businesses in retail, healthcare, and IT heavily rely on electronic systems that require regular servicing to avoid downtime. The growth is driven by increasing adoption of high-end devices in offices, clinics, and data centers. Outsourcing repair and maintenance helps enterprises reduce operational costs and extend asset lifespans. Rising focus on preventive maintenance programs and managed service contracts further supports sustained demand in the commercial end-use category.
Key Growth Drivers
Rising Electronic Device Penetration
The rapid adoption of smartphones, laptops, and smart home devices is a major growth driver. Increased consumer dependence on technology has expanded the need for maintenance and repair services. As digital lifestyles evolve, devices are being used more intensively, leading to frequent wear and technical failures. The constant product innovation cycle also raises demand for specialized repair expertise, encouraging service providers to expand their offerings.
- For instance, IDC reported approximately 17 billionsmartphones were shipped globally in 2023, which represented a 3.2% decline compared to 2022.
Shift Toward Sustainable Consumption
Growing environmental awareness is driving consumers to repair rather than replace electronics. Governments and manufacturers are supporting repair-friendly policies to reduce e-waste. This sustainability shift benefits independent and authorized repair centers alike, as users look for cost-effective, eco-conscious solutions. The trend is fostering a circular economy that extends product life cycles and supports market expansion globally.
- For instance, Best Buy’s Geek Squad fields 20,000+ Agents across the US.
Expanding After-Sales Service Networks
Manufacturers and third-party service providers are rapidly broadening their repair and maintenance infrastructure. Enhanced accessibility to service centers, online booking systems, and doorstep repairs have improved customer convenience. Strategic partnerships with retailers and insurers are strengthening after-sales ecosystems. This expansion helps build customer trust and supports long-term brand loyalty while ensuring continuous revenue for service providers.
Key Trends & Opportunities
Integration of AI and IoT in Diagnostics
Artificial intelligence and IoT-based tools are transforming repair diagnostics. These technologies enable predictive maintenance by identifying faults before they cause device failure. Automated analysis reduces repair time and enhances accuracy. Companies are integrating smart diagnostic software and remote monitoring systems to improve efficiency and customer satisfaction.
- For instance, Dell SupportAssist connects to 89 million+ devices for AI-driven diagnostics.
Growing Adoption of Subscription-Based Models
Subscription-based maintenance services are gaining popularity across commercial and residential sectors. Customers prefer predictable costs and proactive repairs over one-time expenses. Service providers are offering customized packages covering preventive maintenance, parts replacement, and remote support. This recurring revenue model is enhancing profitability and customer retention.
- For instance, HP Instant Ink counts about 13 million subscribers for subscription maintenance.
Key Challenges
Shortage of Skilled Technicians
A major challenge for the industry is the shortage of qualified repair professionals. The fast pace of technological change demands continuous training and certification. Many regions lack structured programs to develop technical expertise, leading to inconsistent service quality. This skill gap can limit market expansion and delay service delivery.
Rapid Product Obsolescence
Frequent updates and model changes in electronics make repair processes complex and costly. Manufacturers often restrict access to spare parts or repair manuals, limiting third-party service capabilities. As devices become more compact and integrated, repairability decreases. This trend pressures independent service providers to adapt quickly or risk losing competitiveness.
Regional Analysis
North America
North America leads the electronic equipment repair services market, accounting for around 37% share in 2024. The region benefits from high electronic device ownership and advanced after-sales service infrastructure. Growing demand for smartphone, laptop, and home appliance repairs supports strong growth. The presence of organized repair networks and extended product life initiatives also contribute to market expansion. The U.S. dominates regional revenue due to well-established electronics ecosystems, while Canada shows steady adoption driven by sustainability-focused consumer behavior.
Europe
Europe holds about 29% share of the market in 2024, driven by strong regulatory support for repair and sustainability. The EU’s “Right to Repair” policies have increased repair accessibility and affordability. Countries such as Germany, France, and the UK are leading due to high consumer awareness and mature service networks. The growing shift toward refurbished electronics further boosts the market. Increasing adoption of green practices and product lifecycle extension programs continues to strengthen Europe’s competitive position.
Asia Pacific
Asia Pacific accounts for nearly 24% share of the electronic equipment repair services market in 2024. Rapid urbanization, increasing electronic device penetration, and cost-sensitive consumers drive strong regional demand. China, Japan, and India are major contributors, supported by large consumer bases and expanding service networks. Local manufacturers and third-party service providers are increasing their presence, making repair services more affordable. Rising awareness about e-waste management and repair-friendly regulations are expected to further accelerate regional growth.
Latin America
Latin America represents around 6% share of the global market in 2024. The region’s growth is fueled by rising consumer electronics ownership and an increasing focus on cost-effective repair options. Brazil and Mexico dominate due to strong retail electronics sectors and growing networks of independent repair providers. Limited product replacement affordability encourages longer device usage, boosting repair demand. Government initiatives promoting e-waste reduction and recycling are also supporting regional expansion.
Middle East and Africa
The Middle East and Africa hold approximately 4% share of the electronic equipment repair services market in 2024. Growth is supported by increasing adoption of consumer electronics and expanding retail infrastructure. The UAE and Saudi Arabia lead regional development with growing demand for smartphone and appliance repair services. Africa’s market is gradually expanding due to affordability-driven repair culture and local entrepreneurship. Efforts to build organized service centers and improve spare parts availability are expected to enhance future market growth.
Market Segmentations:
By Type
- Consumer electronics
- Home appliances
- Medical equipment
- Industrial equipment
- Others
By Service
- Warranty service
- Out of warranty service
- Others
By End User
- Commercial
- Industrial
- Residential
By Geography
- North America
- Europe
- Germany
- France
- U.K.
- Italy
- Spain
- Rest of Europe
- Asia Pacific
- China
- Japan
- India
- South Korea
- South-east Asia
- Rest of Asia Pacific
- Latin America
- Brazil
- Argentina
- Rest of Latin America
- Middle East & Africa
- GCC Countries
- South Africa
- Rest of the Middle East and Africa
Competitive Landscape
The electronic equipment repair services market features a competitive landscape with key participants such as Mendtronix Inc., Redington Services, Encompass Supply Chain Solutions, Inc., B2X Care Solutions GmbH, The Cableshoppe Inc. (CSI), uBreakiFix (Asurion LLC), Quest International, Inc., Moduslink Global Solutions, Electronix Services Ltd., Parts Town, and iCracked, Inc. (Square Trade). The market is highly fragmented, with companies focusing on expanding service networks, improving turnaround times, and integrating advanced diagnostic technologies. Players are adopting digital platforms for booking, tracking, and customer support to enhance efficiency and transparency. Strategic alliances with OEMs and component suppliers strengthen access to genuine parts and service reliability. Many firms are investing in sustainability through repair-friendly initiatives and eco-efficient operations. Continuous staff training, certification programs, and global logistics capabilities further enhance competitiveness, positioning leading players to meet the growing demand for reliable, fast, and cost-effective electronic repair solutions.
Shape Your Report to Specific Countries or Regions & Enjoy 30% Off!
Key Player Analysis
- Mendtronix Inc.
- Redington Services
- Encompass Supply Chain Solutions, Inc.
- B2X Care Solutions GmbH
- The Cableshoppe Inc. (CSI)
- uBreakiFix (Asurion LLC)
- Quest International, Inc.
- Moduslink Global Solutions
- Electronix Services Ltd.
- Parts Town
- iCracked, Inc. (Square Trade)
Recent Developments
- In 2025, Encompass partnered strategically with ServicePower, a leading field service management platform.
- In 2025, uBreakiFix (Asurion LLC) Opened new repair locations, expanding U.S. footprint.
- In 2024, Parts Town launched two new AI-powered tools: PartPredictor and the HVAC Data Plate Scanner, aimed at improving efficiency in identifying correct parts for repairs across various equipment types.
Report Coverage
The research report offers an in-depth analysis based on Type, Service, End-User and Geography. It details leading market players, providing an overview of their business, product offerings, investments, revenue streams, and key applications. Additionally, the report includes insights into the competitive environment, SWOT analysis, current market trends, as well as the primary drivers and constraints. Furthermore, it discusses various factors that have driven market expansion in recent years. The report also explores market dynamics, regulatory scenarios, and technological advancements that are shaping the industry. It assesses the impact of external factors and global economic changes on market growth. Lastly, it provides strategic recommendations for new entrants and established companies to navigate the complexities of the market.
Future Outlook
- The market will continue growing as consumers favor repair over replacement to reduce waste.
- Expanding digitalization will drive demand for skilled technicians and advanced diagnostic tools.
- Manufacturers will strengthen authorized service networks to enhance customer trust.
- AI-driven predictive maintenance will become standard for both industrial and consumer applications.
- Governments will introduce more repair-friendly regulations supporting circular economy practices.
- Subscription-based repair and maintenance plans will see increased adoption among commercial users.
- Growth in refurbished electronics will create new revenue streams for service providers.
- Emerging economies will witness strong expansion due to cost-sensitive consumers.
- Online booking platforms and on-site repair models will improve customer convenience.
- Strategic partnerships between OEMs and independent service providers will enhance global service accessibility.


