
Market Overview
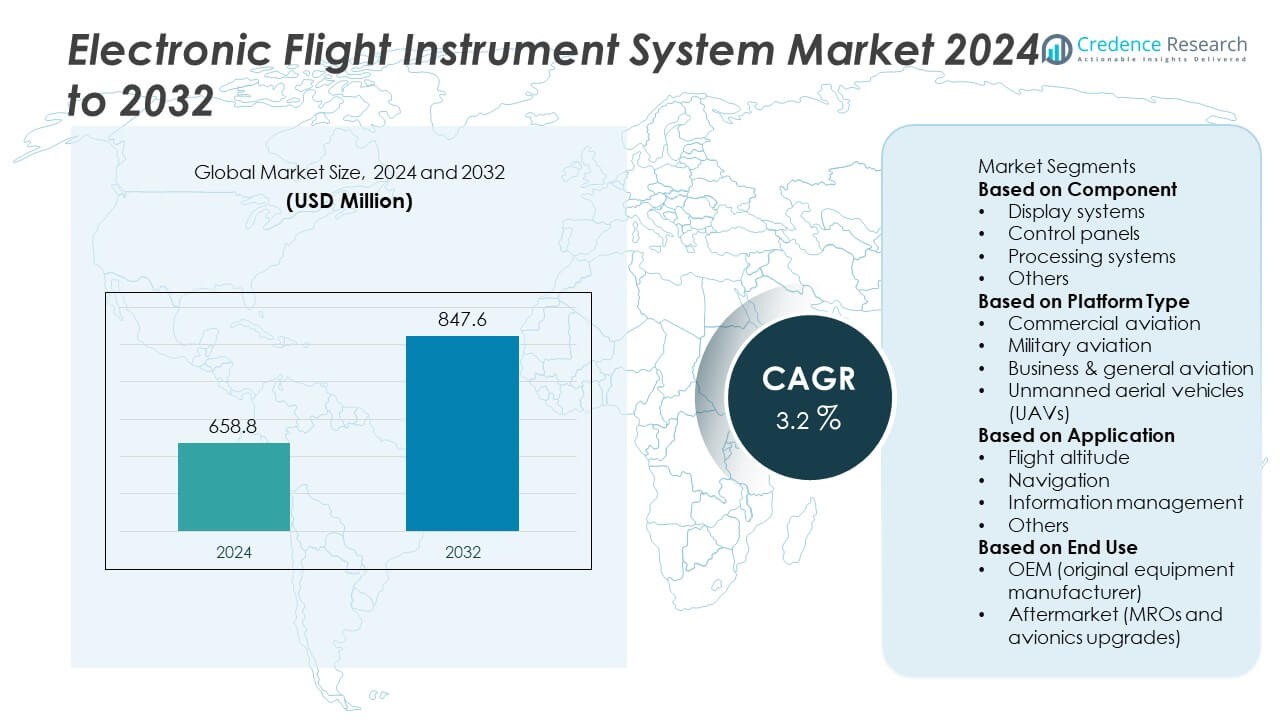
The Electronic Flight Instrument System (EFIS) market was valued at USD 658.8 million in 2024. The market is projected to reach USD 847.6 million by 2032, registering a CAGR of 3.2% during the forecast period.
| REPORT ATTRIBUTE | DETAILS |
|---|---|
| Historical Period | 2020-2023 |
| Base Year | 2024 |
| Forecast Period | 2025-2032 |
| Electronic Flight Instrument System Market Size 2024 | USD 658.8 Million |
| Electronic Flight Instrument System Market , CAGR | 3.2% |
| Electronic Flight Instrument System Market Size 2032 | USD 847.6 Million |
The top players in the Electronic Flight Instrument System market include Honeywell Aerospace, Garmin Ltd., Collins Aerospace, Thales Group, Elbit Systems, Safran, Aspen Avionics, Universal Avionics Systems, BAE Systems, and Curtiss-Wright Corporation, each focusing on advanced glass cockpit displays, synthetic vision technologies, and integrated flight management capabilities to enhance pilot situational awareness and operational safety. Asia Pacific leads the market with a 33% share, supported by rising commercial aircraft deliveries and expanding domestic aviation fleets in China and India. North America follows with 31%, driven by strong avionics upgrade programs across commercial and military aviation, while Europe holds a 27% share due to substantial investments in flight deck digitalization and regulatory compliance for next-generation cockpit systems.
Market Insights
- The Electronic Flight Instrument System market reached USD 658.8 million in 2024 and is expected to reach USD 847.6 million by 2032, registering a CAGR of 3.2% during the forecast period.
- Rising demand for advanced glass cockpit solutions in commercial and military aviation drives market growth, with display systems holding the largest 46% segment share due to increasing adoption of high-resolution multifunction flight displays.
- Key trends include integration of synthetic vision, touchscreen avionics, and satellite-based navigation, along with growing opportunities in unmanned aerial vehicles that require real-time flight data visualization and autonomous control.
- Honeywell Aerospace, Garmin Ltd., Collins Aerospace, Thales Group, Elbit Systems, and Safran lead the competitive landscape, focusing on software-driven EFIS upgrades, cybersecurity-hardened avionics, and scalable flight display architecture for new and retrofit aircraft programs.
- Asia Pacific leads regional demand with a 33% share, followed by North America at 31% and Europe at 27%, driven by fleet modernization, pilot training expansion, and increased adoption of ADS-B and performance-based navigation standards across major aviation markets.
Market Segmentation Analysis:
By Component
Display systems hold the largest 46% share of the Electronic Flight Instrument System market, driven by increasing adoption of high-resolution LCD and LED cockpit screens that enhance flight visibility and reduce pilot workload. Modern glass cockpit technologies replace analog gauges with multifunctional displays that integrate attitude, airspeed, altitude, and navigation data. Processing systems continue to grow as avionics upgrade programs demand faster data computation and improved situational awareness. Control panels also see steady usage for flight input functions, while other components include sensors, communication modules, and interface units supporting integrated flight data management.
- For instance, Garmin’s G3000 avionics suite uses three 14-inch WXGA screens and two touchscreen controllers, supporting more than 30 integrated flight functions.
By Platform Type
Commercial aviation dominates with a 52% share, supported by rising commercial aircraft deliveries and widespread transition toward advanced cockpit avionics. Airlines invest in next-generation EFIS solutions to improve fuel efficiency, reduce operational errors, and meet evolving airspace safety regulations. Military aviation follows due to modernization of fighter jets and transport aircraft with mission-specific flight displays. Business and general aviation benefits from growing demand for private jets and upgraded cockpit systems. Unmanned aerial vehicles (UAVs) represent an emerging segment as autonomous flight control and real-time telemetry drive EFIS integration.
- For instance, certain Airbus A320neo family aircraft, such as those operated by AirAsia and Lion Air, incorporate a Thales avionics package that includes the Thales TopFlight Flight Management System (FMS), which processes and shares vast amounts of data to assist pilots with navigation and optimize flight operations.
By Application
Navigation applications lead the market with a 41% share, driven by the need for precise flight routing, real-time location tracking, and integration with satellite-based GNSS systems. EFIS enhances route planning, autopilot functions, and collision avoidance, reinforcing safety and operational efficiency. Flight altitude monitoring remains essential for airspace compliance and terrain awareness, while information management supports centralized access to weather, system alerts, and engine data. Other applications include flight performance monitoring and communication support. Increasing demand for digital flight decks and regulatory requirements for aircraft modernization continue to strengthen EFIS adoption across all major aviation applications.
Key Growth Drivers
Rising Demand for Advanced Glass Cockpit Systems
Airlines and aircraft manufacturers increase adoption of glass cockpit systems to improve flight safety and reduce pilot workload. EFIS provides integrated displays combining navigation, weather, engine data, and flight performance information, enhancing situational awareness. The shift from analog gauges to digital flight decks supports fleet modernization across commercial and business aviation. Regulatory mandates for avionics upgrades and replacement of outdated instruments further accelerate installations. Growth in air passenger traffic and expanding aircraft production pipelines strengthen long-term demand for advanced electronic flight instrument solutions.
- For instance, Boeing 737 MAX uses four 15.1-inch Rockwell Collins LCD displays that process over 20 million pixels and integrate flight, engine, and systems data into a unified view.
Increasing Aircraft Fleet Modernization Programs
Commercial carriers and defense organizations invest in avionics upgrade programs to enhance fuel efficiency, navigation accuracy, and operational reliability. EFIS integration enables autopilot support, optimized flight routing, and improved communication with air traffic control systems. Older aircraft platforms undergo retrofitting to comply with airspace modernization initiatives, including Performance-Based Navigation (PBN) and ADS-B requirements. Military aviation benefits from mission-specific display enhancements and sensor-linked flight information systems. These modernization investments sustain growth opportunities for EFIS suppliers across global aircraft maintenance and overhaul networks.
- For instance, the Collins Aerospace and Boeing collaboration offers a large-format display system retrofit for Boeing 757 and 767 aircraft to replace legacy CRT displays with modern LCD displays, a modification which replaces 28 older line replaceable units with just 11, potentially paying for itself in as little as three years through reduced maintenance costs.
Growth in Unmanned Aerial Vehicles for Commercial and Defense Use
The expanding adoption of UAVs for defense surveillance, border security, agriculture, and logistical operations supports demand for EFIS integration. Advanced flight displays enable autonomous navigation, real-time telemetry, and camera-assisted situational awareness. Increasing use of UAVs for cargo, mapping, and disaster response requires reliable electronic flight instrumentation to ensure safe mission execution. As regulatory frameworks evolve to support beyond-visual-line-of-sight (BVLOS) operations, UAV platforms rely more heavily on EFIS-enabled flight control systems, creating new market opportunities for avionics manufacturers.
Key Trends & Opportunities
Rapid Development of Connected and Software-Driven Cockpit Technologies
The shift toward connected avionics drives integration of EFIS with cloud-based flight data systems, predictive maintenance platforms, and real-time weather intelligence. Digital cockpits feature touchscreen displays, synthetic vision, and augmented-reality-based guidance that enhance pilot decision-making. Opportunities emerge for software developers and avionics suppliers to deliver upgradeable display architectures and modular dashboards. Data-driven EFIS capabilities support more efficient fleet management and strengthen aircraft safety performance.
- For instance, Honeywell’s Forge Flight Analytics platform processes more than 100,000 flight data parameters per aircraft each day, enabling predictive maintenance and route optimization across airline fleets.
Adoption of Lightweight and Energy-Efficient Avionics Platforms
Aviation stakeholders prioritize weight reduction to improve fuel efficiency and lower emissions, supporting demand for compact EFIS components with reduced power consumption. Advancements in OLED and micro-LED display technologies help decrease cockpit weight while improving visibility and durability. Manufacturers explore new materials, embedded processors, and integrated sensor networks to optimize system performance. This trend encourages development of scalable EFIS solutions suitable for commercial, military, and emerging electric aircraft platforms.
- For instance, Thales Avionics’ avionics display units use micro-LED backlighting that reduces power draw to 12 watts per panel compared to 28 watts in older LCD units, extending component life cycle.
Key Challenges
High Cost of Installation and Certification Compliance
EFIS installation requires significant investment in hardware, software, pilot training, and aircraft downtime. Certification processes involve extensive testing to meet safety standards set by aviation authorities, increasing development and deployment costs. Smaller airlines and general aviation operators may delay upgrades due to budget constraints, slowing adoption rates. Manufacturers must continuously address regulatory changes while delivering cost-efficient solutions to expand market penetration.
Cybersecurity Risks and Vulnerability of Integrated Avionics Systems
As cockpits become more connected and dependent on digital communication, cybersecurity threats pose operational risks to EFIS platforms. Unauthorized access, data manipulation, or system failure can impact flight performance and passenger safety. Securing avionics networks, satellite links, and software updates demands advanced encryption and real-time monitoring. Rising cyber threats increase compliance obligations and technology costs for avionics suppliers, challenging system integration across global aviation fleets.
Regional Analysis
North America
North America holds a 31% share of the Electronic Flight Instrument System market, driven by strong demand for avionics modernization and next-generation cockpit integration across commercial and military fleets. The United States leads adoption due to continuous aircraft upgrades, large commercial airline networks, and advanced defense aircraft production. FAA mandates for performance-based navigation and ADS-B compliance support sustained EFIS installations. Growth in business aviation and increasing use of UAVs for surveillance and logistics further enhance market expansion. Well-established aerospace OEMs, MRO service providers, and avionics manufacturers strengthen the region’s long-term technology leadership.
Europe
Europe accounts for a 27% share of the market, supported by a strong aviation manufacturing base, growing investments in connected cockpit technologies, and strict safety regulations. Countries including Germany, France, and the United Kingdom drive adoption across commercial and defense aviation programs. EFIS integration accelerates as airlines replace legacy analog systems with digital flight displays to improve operational efficiency and meet EASA requirements. Research in hydrogen-powered and hybrid-electric aircraft promotes new avionics development. Expanding business jet usage and modernization of regional aircraft fleets further reinforce EFIS demand throughout Europe.
Asia Pacific
Asia Pacific leads the market with a 33% share, fueled by rising commercial aircraft deliveries, expanding low-cost carriers, and significant growth in domestic air travel. China, India, Japan, and South Korea invest heavily in fleet expansion and cockpit digitalization, supporting strong EFIS installation rates. Indigenous aircraft programs and increased MRO capabilities boost avionics localization. The region also sees rapid growth in UAV and military aviation procurement, requiring advanced electronic flight displays and integrated navigation systems. Infrastructure upgrades and growing pilot training capacity further strengthen EFIS adoption across the region.
Latin America
Latin America holds a 5% share of the market, supported by gradual modernization of commercial and cargo aircraft, particularly in Brazil and Mexico. Regional carriers invest in cockpit upgrades to improve operational safety and fuel efficiency, driving demand for integrated electronic flight displays. Economic constraints influence adoption speed, but EFIS installations rise in business aviation and helicopter fleets used for energy, agriculture, and emergency operations. Expansion of MRO centers and increasing air traffic management improvements support long-term EFIS adoption across the region.
Middle East & Africa
Middle East and Africa represent a 4% share of the market, driven by strong aviation activity in the United Arab Emirates, Saudi Arabia, and Qatar. Growing fleets of wide-body commercial aircraft and military aviation programs support EFIS installation and replacement cycles. Investments in pilot training, UAV systems, and regional airline expansions increase demand for digital cockpit avionics. Africa shows slower adoption due to budget limitations, yet EFIS demand rises in medical evacuation aircraft, cargo operations, and humanitarian aviation. As aerospace infrastructure develops, the region is expected to experience steady long-term EFIS growth.
Market Segmentations:
By Component
- Display systems
- Control panels
- Processing systems
- Others
By Platform Type
- Commercial aviation
- Military aviation
- Business & general aviation
- Unmanned aerial vehicles (UAVs)
By Application
- Flight altitude
- Navigation
- Information management
- Others
By End Use
- OEM (original equipment manufacturer)
- Aftermarket (MROs and avionics upgrades)
By Geography
- North America
- U.S.
- Canada
- Mexico
- Europe
- Germany
- France
- U.K.
- Italy
- Spain
- Rest of Europe
- Asia Pacific
- China
- Japan
- India
- South Korea
- South-east Asia
- Rest of Asia Pacific
- Latin America
- Brazil
- Argentina
- Rest of Latin America
- Middle East & Africa
- GCC Countries
- South Africa
- Rest of the Middle East and Africa
Competitive Landscape
Honeywell Aerospace, Garmin Ltd., Collins Aerospace, Thales Group, Elbit Systems, Safran, Aspen Avionics, Universal Avionics Systems, BAE Systems, and Curtiss-Wright Corporation lead the competitive landscape of the Electronic Flight Instrument System market. The market remains highly competitive, with manufacturers focusing on next-generation glass cockpit systems, enhanced situational awareness tools, and software-driven flight display platforms. Key players prioritize integration of synthetic vision, touchscreen interfaces, and satellite-based navigation to support safer and more efficient aircraft operations. Strategic partnerships with aircraft OEMs and avionics upgrade programs strengthen long-term supply relationships, while retrofit demand across commercial, business, and military fleets creates recurring revenue opportunities. Companies continue investing in cybersecurity-hardened avionics to address data integrity risks in connected cockpits. The expansion of autonomous and unmanned aerial systems further encourages EFIS innovation, positioning leading vendors to offer scalable flight display solutions for future aviation platforms.
Key Player Analysis
- Honeywell Aerospace
- Garmin Ltd.
- Collins Aerospace
- Thales Group
- Elbit Systems
- Safran
- Aspen Avionics
- Universal Avionics Systems
- BAE Systems
- Curtiss-Wright Corporation
Recent Developments
- In October 2025, Honeywell announced updated business-segment structure ahead of the spin-off of its Aerospace Technologies business, reinforcing its focus on automation.
- In September 2025, Thales Group signed strategic contracts with IndiGo Airlines for avionics support and fleet-wide EFB roll-out; the deal underscores Thales’ avionics/EFIS-adjacent offerings.
- In March 2025, RoadRunner Electronic Flight Instrument (EFI) of Astronautics Corporation of America was selected for upgrading the Royal Norwegian Air Force’s Bell 412 helicopters. Under this program, Astronautics is providing 32 Road Runner EFIs through its dealer Patria Helicopters AB. Each Bell 412 cockpit will be retrofitted with two EFIs, one for the pilot and one for the co-pilot.
- In November 2024, Collins Aerospace (an RTX business) secured a contract to provide upgraded avionics including cockpit displays for the UK H-47 Chinook fleet, making them interoperable with U.S. aircraft.
Report Coverage
The research report offers an in-depth analysis based on Component, Platform Type, Application, End Use and Geography. It details leading market players, providing an overview of their business, product offerings, investments, revenue streams, and key applications. Additionally, the report includes insights into the competitive environment, SWOT analysis, current market trends, as well as the primary drivers and constraints. Furthermore, it discusses various factors that have driven market expansion in recent years. The report also explores market dynamics, regulatory scenarios, and technological advancements that are shaping the industry. It assesses the impact of external factors and global economic changes on market growth. Lastly, it provides strategic recommendations for new entrants and established companies to navigate the complexities of the market.
Future Outlook
- Adoption will increase as airlines and defense forces accelerate cockpit modernization programs.
- Synthetic vision and augmented reality flight displays will gain wider integration.
- Demand for lightweight, low-power avionics will grow to support fuel-efficient aircraft.
- EFIS upgrades will expand in unmanned aerial vehicles requiring autonomous navigation.
- Cybersecure avionics architectures will become essential to protect connected flight systems.
- Touchscreen and modular display formats will drive next-generation flight deck design.
- Cloud-based data analytics will enhance predictive maintenance and flight optimization.
- Retrofit opportunities will rise as regional airlines extend aircraft service life.
- Asia Pacific will continue leading growth due to expanding commercial and military fleets.
- Collaboration between avionics suppliers and aircraft OEMs will strengthen product innovation.

Request a Free Sample
Fill in your details and we'll send you a free sample report.
- Sample data tables & charts
- Research methodology
Need a Custom Version of This Report?
Tailor the scope, geography, or segments to your exact requirements.
- Custom geography or segment scope
- Direct access to our analyst team
Frequently Asked Questions
What is the current market size for the Electronic Flight Instrument System market, and what is its projected size in 2032?
At what Compound Annual Growth Rate is the Electronic Flight Instrument System market projected to grow between 2025 and 2032?
Which Electronic Flight Instrument System market segment held the largest share in 2024?
What are the primary factors fueling the growth of the Electronic Flight Instrument System market?
Who are the leading companies in the Electronic Flight Instrument System market?
Which region commanded the largest share of the Electronic Flight Instrument System market in 2024?
Table of Content
Chapter 1. Report Introduction
- 1.1 Report Description & Purpose
- 1.1.1 Report Title & Market Definition
- 1.1.2 Unique Selling Propositions (USP) & Key Differentiators
- 1.1.3 Value Proposition for Stakeholders
- 1.2 Research Objectives
- 1.2.1 Market Sizing Objectives (Volume & Revenue)
- 1.2.2 Segmentation Objectives
- 1.2.3 Competitive Intelligence Objectives
- 1.2.4 Forecast & Scenario Objectives
- 1.3 Report Scope
- 1.3.1 Electronic Flight Instrument System Scope – Types & Subtypes Covered
- 1.3.2 Geographic Scope – Regions & Countries Covered
- 1.3.3 Historical Period, Base Year & Forecast Period (2024; forecast to 2032)
- 1.3.4 Inclusions & Exclusions
- 1.4 HS Code & Classification Framework
- 1.5 Currency, Units & Pricing Basis
- 1.6 Target Stakeholders
- 1.7 Limitations & Assumptions
Chapter 2. Executive Summary
- 2.1 Global Electronic Flight Instrument System Market Snapshot
- 2.1.1 Market Size – Historical (2024) & Forecast (2024-2032) (2024: USD 658.8 million → 2032: USD 847.6 million)
- 2.1.2 Volume & Revenue – Global Totals
- 2.1.3 Key Market Highlights – Top Five Facts
- 2.2 Electronic Flight Instrument System Market Segmentation Snapshot
- 2.2.1 Market Split by Region – 2024 vs. 2032
- 2.3 Competitive Snapshot
- 2.3.1 Top 10 Players by Revenue Share – 2024
- 2.3.2 Top 10 Players by Volume Share – 2024
- 2.3.3 Recent Strategic Developments (18-Month Summary)
- 2.4 Key Investment Highlights & Strategic Conclusions
Chapter 3. Electronic Flight Instrument System Market Dynamics & Industry Analysis
- 3.1 Market Overview & Context
- 3.1.1 Electronic Flight Instrument System Market Position in the Broader Automotive Value Chain
- 3.1.2 OEM vs. Replacement Market Dynamics
- 3.1.3 Market Maturity & Development Stage by Region
- 3.2 Electronic Flight Instrument System Market Drivers
- 3.3 Electronic Flight Instrument System Market Restraints & Challenges
- 3.4 Electronic Flight Instrument System Market Opportunities
- 3.5 Porter's Five Forces Analysis
- 3.5.1 Threat of New Entrants
- 3.5.2 Bargaining Power of Suppliers
- 3.5.3 Bargaining Power of Buyers
- 3.5.4 Threat of Substitutes
- 3.5.5 Competitive Rivalry – Intensity Assessment
- 3.6 Electronic Flight Instrument System Value Chain Analysis
- 3.6.1 Upstream – Raw Material/Input Suppliers
- 3.6.1.1 Raw Material/Input 1
- 3.6.1.2 Raw Material/Input 2
- 3.6.1.3 Raw Material/Input 3
- 3.6.2 Midstream – Production/Manufacturing/Service Delivery
- 3.6.2.1 Production/Process Overview
- 3.6.2.2 Key Facility Locations & Capacity by Manufacturer
- 3.6.3 Downstream – Distribution & End Consumer
- 3.6.3.1 Primary Channel – B2B/OEM
- 3.6.3.2 Secondary Channels – Dealer, Retail, Online, Direct
- 3.6.4 Value Chain Profitability Analysis
- 3.6.1 Upstream – Raw Material/Input Suppliers
- 3.7 PESTEL Analysis
- 3.7.1 Political Factors
- 3.7.2 Economic Factors
- 3.7.3 Social Factors
- 3.7.4 Technological Factors
- 3.7.5 Environmental Factors
- 3.7.6 Legal Factors
- 3.8 Electronic Flight Instrument System Supply Chain Analysis
- 3.8.1 Raw Material/Input Supply Risk Assessment
- 3.8.2 Manufacturing Concentration Risk (Geographic Exposure)
- 3.8.3 Trade Disruption Impact Analysis
- 3.9 Regulatory & Policy Landscape
Note: The regulatory and policy landscape section covers regulations based on their applicability to the market, Electronic Flight Instrument System category, geography, and scope of the study. Only regulatory frameworks with a material impact on operations, compliance, trade, sustainability, or market access are analyzed in detail.
Chapter 4. Key Investment Pockets & Opportunity Analysis
- 4.1 Electronic Flight Instrument System Market Attractiveness Analysis
- 4.1.1 By Region – Investment Attractiveness Matrix (Volume × CAGR)
- 4.2 Absolute Revenue Growth Opportunity
- 4.2.1 By Region – Absolute USD Growth Through 2032
- 4.3 Incremental Volume Opportunity
- 4.3.1 By Region – Incremental Volume Through 2032
- 4.3.2 Segment – Incremental Volume
- 4.4 Emerging Submarket Opportunity Deep Dive (Subject to Applicability)
- 4.5 Emerging Market Opportunity Scorecards
- 4.5.1 United States
- 4.5.2 Europe
- 4.5.3 Asia
- 4.5.4 Middle East & Africa
Note: Emerging Market Opportunity Scorecards will be included based on relevance and strategic importance. Regions listed are indicative and may vary depending on data availability and market dynamics.
Chapter 5. Electronic Flight Instrument System Import-Export Analysis & Trade Flows
- 5.1 Global Trade Overview
- 5.1.1 Global Export Value by Country (2024)
- 5.1.2 Global Export Volume by Country (2024)
- 5.1.3 Global Import Value by Country (2024)
- 5.1.4 Global Import Volume by Country (2024)
- 5.1.5 Net Trade Balance by Country (2024)
- 5.2 Export Analysis – Segment
- 5.2.1 Type 1 (HS Code)
- 5.2.2 Type 2 (HS Code)
- 5.2.3 Type 3 (HS Code)
- 5.2.4 Type 4 (HS Code)
- 5.2.5 Type 5 (HS Code)
- 5.3 Import Analysis – Segment
- 5.3.1 Type 1 (HS Code)
- 5.3.2 Type 2 (HS Code)
- 5.3.3 Type 3 (HS Code)
- 5.3.4 Type 4 (HS Code)
- 5.3.5 Type 5 (HS Code)
- 5.4 Average Unit Trade Prices
- 5.4.1 Average Export Price – Segment & Country
- 5.4.2 Average Import Price – Segment & Source Country
- 5.4.3 Price Trends (2024)
- 5.5 Key Trade Route Analysis
- 5.5.1 Trade Route 1
- 5.5.2 Trade Route 2
- 5.5.3 Trade Route 3
- 5.5.4 Trade Route 4
- 5.5.5 Trade Route 5
- 5.6 Trade Policy Impact Assessment
- 5.6.1 US Anti-Dumping & Section 301 Tariffs
- 5.6.2 EU Customs Union Impact
- 5.6.3 Major Free Trade Agreements
- 5.6.4 USMCA Rules of Origin
Note: Trade policy analysis will be included only where relevant to the Electronic Flight Instrument System market.
Chapter 6. Competitive Landscape & Company Benchmarking
- 6.1 Electronic Flight Instrument System Market Concentration & Structure
- 6.1.1 Herfindahl-Hirschman Index (HHI) – vs. 2024
- 6.1.2 Tier 1, Tier 2 & Tier 3 Market Structure
- 6.1.3 Global, Regional & Local Player Dynamics
- 6.2 Electronic Flight Instrument System Market Share Analysis – 2024
- 6.2.1 Global Revenue Share by Company
- 6.2.2 Global Volume Share by Company
- 6.2.3 Regional Revenue Share
- 6.2.4 Market Share Evolution ( vs. 2024)
- 6.2.5 OEM Segment Share by Company
- 6.2.6 Replacement Segment Share by Company
- 6.3 Production/Delivery Capacity & Facility Analysis
- 6.3.1 Global Installed Capacity
- 6.3.2 Capacity Utilization Rates
- 6.3.3 Production/Output Volume
- 6.3.4 Facility Locations & Capacity Map
- 6.3.5 Planned Capacity Additions
- 6.4 Electronic Flight Instrument System Competitive Benchmarking Matrix
- 6.4.1 Revenue, Volume, CAGR & Profitability Comparison
- 6.4.2 Channel Revenue Mix
- 6.4.3 Geographic Revenue Exposure
- 6.4.4 R&D Intensity
- 6.4.5 Sustainability Maturity
- 6.5 Strategic Developments in Electronic Flight Instrument System (Last 24 Months)
- 6.5.1 Mergers, Acquisitions & Divestments
- 6.5.2 New Electronic Flight Instrument System Launches
- 6.5.3 Facility Expansions
- 6.5.4 Strategic Alliances, Joint Ventures & Partnerships
- 6.5.5 Distribution Expansion & Market Entry
- 6.5.6 Sustainability & ESG Initiatives
- 6.6 Competitive Strategy Mapping
- 6.6.1 Leader, Challenger, Follower & Niche Classification
- 6.6.2 Pricing Strategy Comparison
- 6.6.3 Channel Strategy Matrix
Note: Strategic developments are included based on their materiality and the availability of reliable information.
Chapter 7. Global Electronic Flight Instrument System Market – By Distribution Channel
- 7.1 Segment Overview
- 7.1.1 Volume & Revenue Split by Channel (2024 & 2032)
- 7.1.2 Channel Mix Evolution (2024-2032)
Chapter 8. Regional Market Analysis – Global Overview
- 8.1 Global Regional Overview
- 8.1.1 Regional Volume Share
- 8.1.2 Regional Revenue Share
- 8.1.3 Regional Volume by Region
- 8.1.4 Regional Revenue by Region
- 8.1.5 Regional Forecast Through 2032
- 8.2 Cross-Regional Segment Analysis
- 8.2.1 By Distribution Channel
- 8.2.2 By Brand/Price Tier
Chapter 9. North America Electronic Flight Instrument System Market
- 9.1 United States
- 9.2 Canada
- 9.3 Mexico
Chapter 10. Europe Electronic Flight Instrument System Market
- 10.1 Germany
- 10.2 France
- 10.3 Italy
- 10.4 United Kingdom
- 10.5 Spain
- 10.6 Poland
- 10.7 Russia
- 10.8 Netherlands
- 10.9 Belgium
- 10.10 Sweden
- 10.11 Denmark
- 10.12 Norway
- 10.13 Rest of Europe
Chapter 11. Asia Pacific Electronic Flight Instrument System Market
- 11.1 China
- 11.2 India
- 11.3 Japan
- 11.4 South Korea
- 11.5 Thailand
- 11.6 Indonesia
- 11.7 Vietnam
- 11.8 Malaysia
- 11.9 Australia
- 11.10 Rest of Asia Pacific
Chapter 12. Latin America Electronic Flight Instrument System Market
- 12.1 Brazil
- 12.2 Argentina
- 12.3 Colombia
- 12.4 Chile
- 12.5 Rest of Latin America
Chapter 13. Middle East Electronic Flight Instrument System Market
- 13.1 Saudi Arabia
- 13.2 United Arab Emirates
- 13.3 Turkey
- 13.4 Israel
- 13.5 Iran
- 13.6 Rest of the Middle East
Chapter 14. Africa Electronic Flight Instrument System Market
- 14.1 South Africa
- 14.2 Egypt
- 14.3 Nigeria
- 14.4 Morocco
- 14.5 Rest of Africa
Chapter 15. Electronic Flight Instrument System Company Profiles
- 15.1 [Company 01]
- 15.1.1 Company Overview
- 15.1.2 Key Management Personnel
- 15.1.3 Products & Services Portfolio
- 15.1.4 Financial Performance
- 15.1.5 Key Market Focus & Geographic Presence
- 15.1.6 Recent Developments & Strategic Initiatives
Note: The company profile list is preliminary and may change based on research findings, market developments, data availability, and client requirements.
Chapter 16. Appendices
- Appendix A – List of Abbreviations & Acronyms
- Appendix B – Industry Classification Code Reference – Full Series
- Appendix C – Production & Capacity Data Tables
- Appendix D – End-Use & Demand Base Tables
- Appendix E – Consumption & Replacement Rate Assumptions
- Appendix F – ASP Reference Tables
- Appendix G – Manufacturing & Facility Database
- Appendix H – Import-Export Data Tables
- Appendix I – Regulatory Summary Tables
- Appendix J – Primary Research Participant List (Anonymized)
- Appendix K – Primary Research Questionnaire Framework
- Appendix L – Data Sources & Bibliography
- Appendix M – Market Size Divergence & Source Comparison
Chapter 17. Research Methodology
- 17.1 Research Framework & Philosophy
- 17.2 Secondary Research – Sources, Hierarchy & Data Extraction
- 17.3 Data Modeling – Bottom-Up & Top-Down Market Sizing
- 17.4 Primary Research – Stakeholder Framework, LOI & Sample Sizes
- 17.5 Forecast Methodology – Regression, Scenario & Sensitivity Analysis
- 17.6 Quality Control – Four-Layer Validation Framework
- 17.7 Limitations & Standard Assumptions
- 17.8 Disclaimer
