
Fig Ingredient Market Overview:
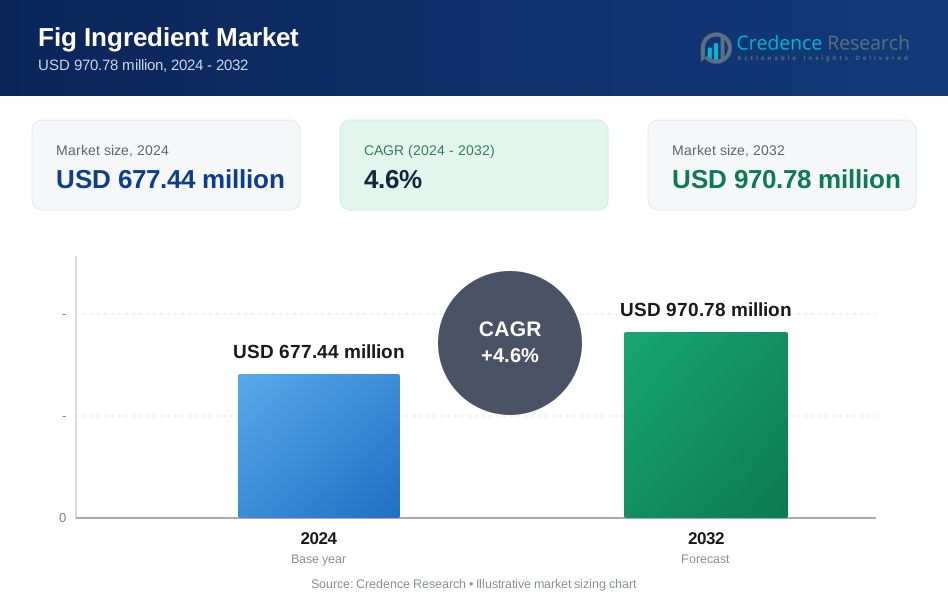
The fig ingredient market was valued at USD 677.44 million in 2024 and is expected to reach USD 970.78 million by 2032, growing at a CAGR of 4.6% during the forecast period.
| REPORT ATTRIBUTE | DETAILS |
|---|---|
| Historical Period | 2020-2023 |
| Base Year | 2024 |
| Forecast Period | 2025-2032 |
| Fig Ingredient Market Size 2024 | USD 677.44 million |
| Fig Ingredient Market, CAGR | 4.6% |
| Fig Ingredient Market Size 2032 | USD 970.78 million |
Fig Ingredient Market Insights
- Clean-label demand acts as a key driver, with fig paste leading the product type segment at a 46% share due to use as a natural sweetener and binder in bakery and snacks.
- Market trends show strong preference for conventional fig ingredients, which hold a 68% share, supported by cost efficiency and large-scale food manufacturing adoption.
- Competitive analysis indicates a moderately fragmented market, where leading suppliers focus on sourcing reliability, processing consistency, and expansion into organic and functional fig formats.
- Regional analysis shows North America leading with a 31% market share, followed by Europe at 27%, Asia Pacific at 22%, Latin America at 11%, and the Middle East and Africa at 9%.
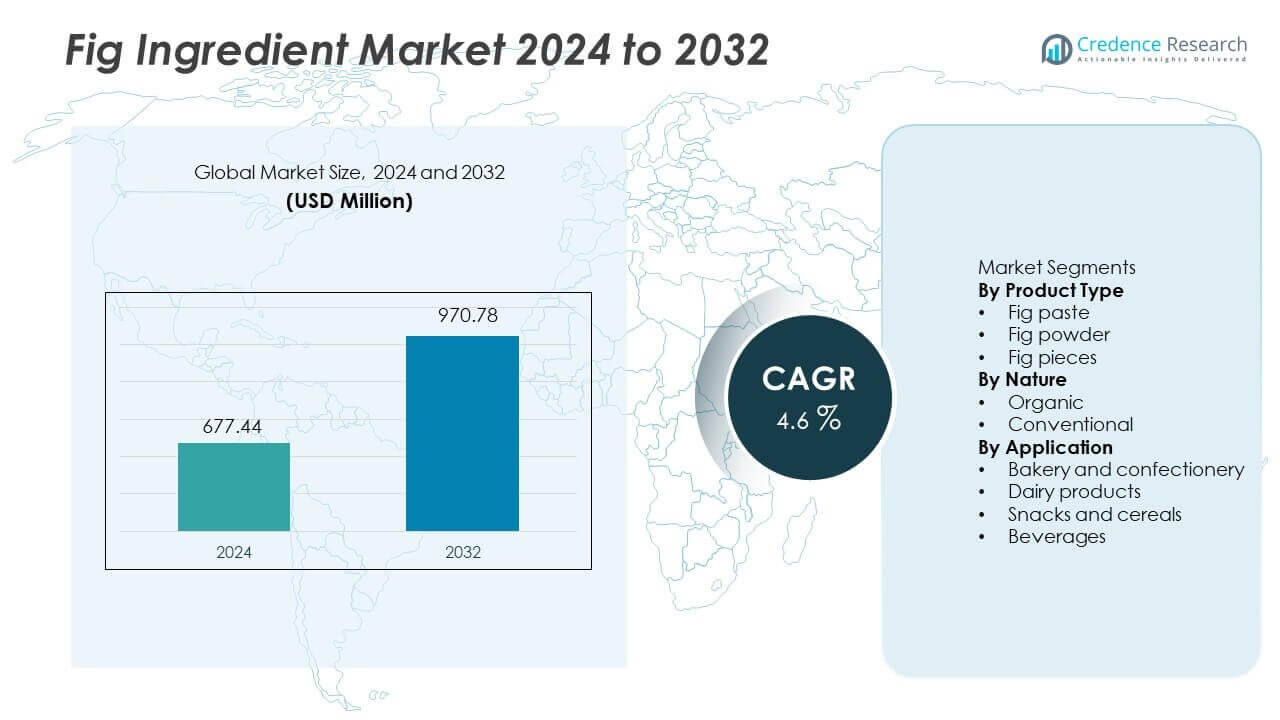
Fig Ingredient Market Segmentation Analysis:
By Product Type
By product type, fig paste dominates the fig ingredient market with a 46% market share, driven by its wide use as a natural sweetener and texture enhancer. Bakery and confectionery manufacturers prefer fig paste for moisture retention, binding properties, and clean-label positioning. Strong demand from bars, fillings, and spreads supports high-volume usage. Fig powder follows, supported by ease of storage, long shelf life, and application in dry mixes and nutrition products. Fig pieces hold a smaller share but gain traction in premium bakery and snack products where visual appeal and fruit texture add product differentiation.
- For instance, Barry Callebaut expanded its portfolio of specialized fruit-based and non-cocoa filling applications to provide versatile alternatives across several confectionery categories.
By Nature
By nature, conventional fig ingredients lead the market with a 68% market share, supported by cost efficiency and broad availability. Food manufacturers favor conventional variants for large-scale production and price-sensitive markets. Strong supply consistency supports steady adoption across bakery, snacks, and dairy applications. Organic fig ingredients account for the remaining share, driven by rising consumer preference for organic and clean-label products. Demand for organic variants remains strong in premium and health-focused segments, particularly in developed markets, where certifications and traceability influence purchasing decisions.
- For instance, Olam Group secured several sustainability and operational milestones, including a Climate Change score improvement and various regional Top Employer certifications, to expand its global reach.
By Application
By application, bakery and confectionery hold the largest share at 42%, driven by high usage of fig ingredients in cookies, cakes, bars, and fillings. Natural sweetness and fiber content support formulation of better-for-you products. Snacks and cereals follow, supported by demand for fruit-based inclusions in granola bars and breakfast products. Dairy products maintain steady demand through flavored yogurts and desserts. Beverages represent a smaller share but show gradual growth as manufacturers explore fruit-based blends and functional drink formulations using fig extracts.
Key Growth Drivers
Rising Demand for Natural and Clean-Label Ingredients
Growing consumer preference for natural and minimally processed foods strongly drives the fig ingredient market. Food manufacturers increasingly replace refined sugars and artificial additives with fruit-based ingredients. Fig ingredients offer natural sweetness, fiber, and nutritional value, supporting clean-label formulation goals. Bakery, snack, and dairy producers adopt fig paste and powder to improve ingredient transparency. Clean-label positioning enhances brand trust and premium appeal. Regulatory focus on ingredient disclosure further supports adoption. This driver remains strong across health-focused and mainstream food categories.
- For instance, the Döhler Group upgraded its fruit processing capabilities with high-efficiency extraction technology to support the production of clean-label formulations.
Expansion of Bakery and Snack Product Consumption
Rising consumption of bakery and snack products supports steady demand for fig ingredients. Busy lifestyles increase preference for convenient and indulgent food options. Fig ingredients improve texture, moisture retention, and flavor in baked goods and snack bars. Manufacturers value figs for versatility across fillings, inclusions, and sweetening applications. Growth of packaged bakery and cereal bars drives volume usage. This driver supports consistent demand across both mass-market and premium food products.
- For instance, Valley Fig Growers distributed fig ingredients to numerous new bakery product lines throughout 2024.
Increasing Awareness of Nutritional Benefits
Health awareness strengthens demand for fig-based ingredients. Figs provide dietary fiber, minerals, and antioxidants, supporting digestive health claims. Consumers seek functional ingredients that offer nutritional benefits without compromising taste. Food brands highlight fruit-based nutrition to attract health-conscious buyers. Demand rises in snacks, cereals, and dairy products positioned as better-for-you options. This driver aligns with long-term wellness trends and preventive nutrition focus.
Key Trends and Opportunities
Growing Adoption in Functional and Health Foods
Functional food development creates new opportunities for fig ingredients. Manufacturers incorporate figs into energy bars, nutrition blends, and fortified snacks. Natural fiber content supports digestive health positioning. Fig powder enables easy integration into dry formulations. Innovation in functional food categories supports premium product development. This trend allows suppliers to expand beyond traditional bakery applications.
- For instance, SunOpta expanded its plant-based nutrition product lines in 2024 by increasing production capacity for high-demand beverages and launching innovative snack options to support health-focused consumer preferences.
Rising Demand for Organic Fig Ingredients
Organic food demand creates growth opportunities. Consumers increasingly seek certified organic fruit ingredients. Organic fig ingredients gain traction in premium bakery, baby food, and health snacks. Retailers promote organic product lines to meet sustainability goals. This trend supports higher margins and product differentiation, especially in developed markets.
- For instance, California Dried Fruit Inc. processed organic figs to fulfill supply requirements for bakery and snack manufacturers.
Key Challenges
Supply Chain Dependence and Seasonal Availability
Fig ingredient production depends on seasonal harvests and regional supply. Climate variability affects yield and quality. Limited growing regions increase sourcing risk. Supply fluctuations impact pricing and availability. Managing consistent quality requires strong supplier relationships. This challenge adds complexity to large-scale production planning.
Price Sensitivity and Processing Costs
Processing figs into paste or powder involves drying, grinding, and quality control costs. Higher production expenses affect pricing competitiveness. Price-sensitive markets may limit premium ingredient adoption. Balancing cost efficiency with quality remains challenging. Manufacturers must optimize processing to maintain margins while meeting market demand.
Regional Analysis
North America
North America holds 31% market share in the fig ingredient market, driven by strong demand for clean-label and natural food products. Bakery, snack bars, and cereal manufacturers активно use fig paste and powder as natural sweeteners and fiber sources. High consumer awareness of health and nutrition supports steady adoption. The region benefits from advanced food processing infrastructure and strong presence of premium and organic product lines. Innovation in functional snacks and plant-based foods further strengthens demand. Retail penetration and private-label expansion support consistent volume growth across the United States and Canada.
Europe
Europe accounts for 27% market share, supported by strong consumption of bakery and confectionery products. Traditional European baked goods активно incorporate fig ingredients for flavor and texture. Strict food labeling regulations encourage use of natural fruit-based ingredients. Demand for organic and sustainably sourced figs remains strong, especially in Western Europe. Health-conscious consumers drive adoption in snacks and dairy products. Well-established food manufacturing sectors and growing interest in Mediterranean-style ingredients continue to support stable market growth across the region.
Asia Pacific
Asia Pacific commands 22% market share, driven by expanding packaged food consumption and rising health awareness. Urbanization and changing dietary habits increase demand for fruit-based ingredients in snacks, cereals, and bakery products. Growing middle-class income supports adoption of premium and functional foods. Local manufacturers increasingly use fig ingredients to enhance nutrition profiles. Expansion of modern retail and e-commerce channels improves product accessibility. Countries such as China, India, and Japan lead demand due to large consumer bases and evolving food preferences.
Latin America
Latin America holds 11% market share, supported by growing consumption of processed bakery and snack products. Fig ingredients gain traction as natural sweeteners in regional baked goods and cereals. Rising urbanization and improving retail infrastructure support packaged food demand. Price sensitivity favors conventional fig ingredients over organic variants. Local food producers gradually adopt fruit-based ingredients to improve product appeal. Brazil and Mexico remain key markets due to expanding food processing industries and increasing health awareness.
Middle East and Africa
The Middle East and Africa represent 9% market share, driven by traditional consumption of figs and fig-based products. Bakery and confectionery applications dominate demand. Cultural preference for dried fruits supports steady usage of fig pieces and paste. Growth in modern food processing and packaged snack categories supports incremental demand. Import dependence influences pricing and availability. Rising interest in natural and minimally processed foods creates long-term growth opportunities, particularly in urban and high-income markets.
Fig Ingredient Market Segmentations:
By Product Type
- Fig paste
- Fig powder
- Fig pieces
By Nature
- Organic
- Conventional
By Application
- Bakery and confectionery
- Dairy products
- Snacks and cereals
- Beverages
By Geography
- North America
- U.S.
- Canada
- Mexico
- Europe
- Germany
- France
- U.K.
- Italy
- Spain
- Rest of Europe
- Asia Pacific
- China
- Japan
- India
- South Korea
- South-east Asia
- Rest of Asia Pacific
- Latin America
- Brazil
- Argentina
- Rest of Latin America
- Middle East & Africa
- GCC Countries
- South Africa
- Rest of the Middle East and Africa
Competitive Landscape
Competitive landscape analysis highlights a moderately fragmented fig ingredient market led by key players including Olam Group Limited, Archer Daniels Midland Company, Döhler Group, Barry Callebaut Group, SunOpta Inc., Tree Top, Inc., Valley Fig Growers, Traina Foods, California Dried Fruit Inc., and Ingredients by Nature, Inc. These companies compete through product quality, sourcing reliability, and application expertise across bakery, snacks, and dairy. Leading players invest in processing capabilities such as paste standardization and powder milling to ensure consistency and clean-label compliance. Strategic sourcing from key growing regions supports supply stability and traceability. Product portfolio expansion into organic and functional variants strengthens differentiation. Partnerships with food manufacturers enable customized formulations and long-term contracts. Smaller specialists focus on premium cuts, flavor profiles, and regional sourcing to serve niche applications. Continuous innovation and supply chain efficiency shape competitive positioning.
Key Player Analysis
- Olam Group Limited
- Archer Daniels Midland Company
- Döhler Group
- Barry Callebaut Group
- SunOpta Inc.
- Tree Top, Inc.
- Valley Fig Growers
- Traina Foods
- California Dried Fruit Inc.
- Ingredients by Nature, Inc.
Recent Developments
- In November 2025, Barry Callebaut Group partnered with NotCo AI to integrate AI into its ingredients innovation and recipe development to accelerate product formulation and sustainability.
- In September 2025, Archer Daniels Midland Company (ADM) announced a joint venture with Alltech to combine U.S. feed mills, part of a broader strategy to pivot toward specialty ingredients.
Report Coverage
The research report offers an in-depth analysis based on Product Type, Nature, Application and Geography. It details leading market players, providing an overview of their business, product offerings, investments, revenue streams, and key applications. Additionally, the report includes insights into the competitive environment, SWOT analysis, current market trends, as well as the primary drivers and constraints. Furthermore, it discusses various factors that have driven market expansion in recent years. The report also explores market dynamics, regulatory scenarios, and technological advancements that are shaping the industry. It assesses the impact of external factors and global economic changes on market growth. Lastly, it provides strategic recommendations for new entrants and established companies to navigate the complexities of the market.
Future Outlook
- Demand for natural fruit-based ingredients will continue to increase.
- Bakery and snack applications will remain the primary growth drivers.
- Fig paste usage will expand due to clean-label sweetening needs.
- Organic fig ingredients will gain higher adoption in premium products.
- Functional food development will create new application opportunities.
- Suppliers will invest in processing efficiency and quality consistency.
- Emerging markets will show steady growth in packaged food consumption.
- E-commerce and modern retail will improve ingredient accessibility.
- Sustainability and traceability will influence sourcing decisions.
- Product innovation will strengthen long-term market competitiveness.
Request a Free Sample
Fill in your details and we'll send you a free sample report.
- Sample data tables & charts
- Research methodology
Need a Custom Version of This Report?
Tailor the scope, geography, or segments to your exact requirements.
- Custom geography or segment scope
- Direct access to our analyst team
Frequently Asked Questions
What is the current market size for Fig Ingredient market, and what is its projected size in 2032?
At what Compound Annual Growth Rate is the Fig Ingredient market projected to grow between 2024 and 2032?
Which Fig Ingredient market segment held the largest share in 2024?
What are the primary factors fueling the growth of the Fig Ingredient market?
Who are the leading companies in the Fig Ingredient market?
Which region commanded the largest share of the Fig Ingredient market in 2024?
Table of Content
Chapter 1. Report Introduction
- 1.1 Report Description & Purpose
- 1.1.1 Report Title & Market Definition
- 1.1.2 Unique Selling Propositions (USP) & Key Differentiators
- 1.1.3 Value Proposition for Stakeholders
- 1.2 Research Objectives
- 1.2.1 Market Sizing Objectives (Volume & Revenue)
- 1.2.2 Segmentation Objectives
- 1.2.3 Competitive Intelligence Objectives
- 1.2.4 Forecast & Scenario Objectives
- 1.3 Report Scope
- 1.3.1 Fig Ingredient Scope – Types & Subtypes Covered
- 1.3.2 Geographic Scope – Regions & Countries Covered
- 1.3.3 Historical Period, Base Year & Forecast Period (2024; forecast to 2032)
- 1.3.4 Inclusions & Exclusions
- 1.4 HS Code & Classification Framework
- 1.5 Currency, Units & Pricing Basis
- 1.6 Target Stakeholders
- 1.7 Limitations & Assumptions
Chapter 2. Executive Summary
- 2.1 Global Fig Ingredient Market Snapshot
- 2.1.1 Market Size – Historical (2024) & Forecast (2024-2032) (2024: USD 677.44 million → 2032: USD 970.78 million)
- 2.1.2 Volume & Revenue – Global Totals
- 2.1.3 Key Market Highlights – Top Five Facts
- 2.2 Fig Ingredient Market Segmentation Snapshot
- 2.2.1 Market Split by Region – 2024 vs. 2032
- 2.3 Competitive Snapshot
- 2.3.1 Top 10 Players by Revenue Share – 2024
- 2.3.2 Top 10 Players by Volume Share – 2024
- 2.3.3 Recent Strategic Developments (18-Month Summary)
- 2.4 Key Investment Highlights & Strategic Conclusions
Chapter 3. Fig Ingredient Market Dynamics & Industry Analysis
- 3.1 Market Overview & Context
- 3.1.1 Fig Ingredient Market Position in the Broader Automotive Value Chain
- 3.1.2 OEM vs. Replacement Market Dynamics
- 3.1.3 Market Maturity & Development Stage by Region
- 3.2 Fig Ingredient Market Drivers
- 3.3 Fig Ingredient Market Restraints & Challenges
- 3.4 Fig Ingredient Market Opportunities
- 3.5 Porter's Five Forces Analysis
- 3.5.1 Threat of New Entrants
- 3.5.2 Bargaining Power of Suppliers
- 3.5.3 Bargaining Power of Buyers
- 3.5.4 Threat of Substitutes
- 3.5.5 Competitive Rivalry – Intensity Assessment
- 3.6 Fig Ingredient Value Chain Analysis
- 3.6.1 Upstream – Raw Material/Input Suppliers
- 3.6.1.1 Raw Material/Input 1
- 3.6.1.2 Raw Material/Input 2
- 3.6.1.3 Raw Material/Input 3
- 3.6.2 Midstream – Production/Manufacturing/Service Delivery
- 3.6.2.1 Production/Process Overview
- 3.6.2.2 Key Facility Locations & Capacity by Manufacturer
- 3.6.3 Downstream – Distribution & End Consumer
- 3.6.3.1 Primary Channel – B2B/OEM
- 3.6.3.2 Secondary Channels – Dealer, Retail, Online, Direct
- 3.6.4 Value Chain Profitability Analysis
- 3.6.1 Upstream – Raw Material/Input Suppliers
- 3.7 PESTEL Analysis
- 3.7.1 Political Factors
- 3.7.2 Economic Factors
- 3.7.3 Social Factors
- 3.7.4 Technological Factors
- 3.7.5 Environmental Factors
- 3.7.6 Legal Factors
- 3.8 Fig Ingredient Supply Chain Analysis
- 3.8.1 Raw Material/Input Supply Risk Assessment
- 3.8.2 Manufacturing Concentration Risk (Geographic Exposure)
- 3.8.3 Trade Disruption Impact Analysis
- 3.9 Regulatory & Policy Landscape
Note: The regulatory and policy landscape section covers regulations based on their applicability to the market, Fig Ingredient category, geography, and scope of the study. Only regulatory frameworks with a material impact on operations, compliance, trade, sustainability, or market access are analyzed in detail.
Chapter 4. Key Investment Pockets & Opportunity Analysis
- 4.1 Fig Ingredient Market Attractiveness Analysis
- 4.1.1 By Region – Investment Attractiveness Matrix (Volume × CAGR)
- 4.2 Absolute Revenue Growth Opportunity
- 4.2.1 By Region – Absolute USD Growth Through 2032
- 4.3 Incremental Volume Opportunity
- 4.3.1 By Region – Incremental Volume Through 2032
- 4.3.2 Segment – Incremental Volume
- 4.4 Emerging Submarket Opportunity Deep Dive (Subject to Applicability)
- 4.5 Emerging Market Opportunity Scorecards
- 4.5.1 United States
- 4.5.2 Europe
- 4.5.3 Asia
- 4.5.4 Middle East & Africa
Note: Emerging Market Opportunity Scorecards will be included based on relevance and strategic importance. Regions listed are indicative and may vary depending on data availability and market dynamics.
Chapter 5. Fig Ingredient Import-Export Analysis & Trade Flows
- 5.1 Global Trade Overview
- 5.1.1 Global Export Value by Country (2024)
- 5.1.2 Global Export Volume by Country (2024)
- 5.1.3 Global Import Value by Country (2024)
- 5.1.4 Global Import Volume by Country (2024)
- 5.1.5 Net Trade Balance by Country (2024)
- 5.2 Export Analysis – Segment
- 5.2.1 Type 1 (HS Code)
- 5.2.2 Type 2 (HS Code)
- 5.2.3 Type 3 (HS Code)
- 5.2.4 Type 4 (HS Code)
- 5.2.5 Type 5 (HS Code)
- 5.3 Import Analysis – Segment
- 5.3.1 Type 1 (HS Code)
- 5.3.2 Type 2 (HS Code)
- 5.3.3 Type 3 (HS Code)
- 5.3.4 Type 4 (HS Code)
- 5.3.5 Type 5 (HS Code)
- 5.4 Average Unit Trade Prices
- 5.4.1 Average Export Price – Segment & Country
- 5.4.2 Average Import Price – Segment & Source Country
- 5.4.3 Price Trends (2024)
- 5.5 Key Trade Route Analysis
- 5.5.1 Trade Route 1
- 5.5.2 Trade Route 2
- 5.5.3 Trade Route 3
- 5.5.4 Trade Route 4
- 5.5.5 Trade Route 5
- 5.6 Trade Policy Impact Assessment
- 5.6.1 US Anti-Dumping & Section 301 Tariffs
- 5.6.2 EU Customs Union Impact
- 5.6.3 Major Free Trade Agreements
- 5.6.4 USMCA Rules of Origin
Note: Trade policy analysis will be included only where relevant to the Fig Ingredient market.
Chapter 6. Competitive Landscape & Company Benchmarking
- 6.1 Fig Ingredient Market Concentration & Structure
- 6.1.1 Herfindahl-Hirschman Index (HHI) – vs. 2024
- 6.1.2 Tier 1, Tier 2 & Tier 3 Market Structure
- 6.1.3 Global, Regional & Local Player Dynamics
- 6.2 Fig Ingredient Market Share Analysis – 2024
- 6.2.1 Global Revenue Share by Company
- 6.2.2 Global Volume Share by Company
- 6.2.3 Regional Revenue Share
- 6.2.4 Market Share Evolution ( vs. 2024)
- 6.2.5 OEM Segment Share by Company
- 6.2.6 Replacement Segment Share by Company
- 6.3 Production/Delivery Capacity & Facility Analysis
- 6.3.1 Global Installed Capacity
- 6.3.2 Capacity Utilization Rates
- 6.3.3 Production/Output Volume
- 6.3.4 Facility Locations & Capacity Map
- 6.3.5 Planned Capacity Additions
- 6.4 Fig Ingredient Competitive Benchmarking Matrix
- 6.4.1 Revenue, Volume, CAGR & Profitability Comparison
- 6.4.2 Channel Revenue Mix
- 6.4.3 Geographic Revenue Exposure
- 6.4.4 R&D Intensity
- 6.4.5 Sustainability Maturity
- 6.5 Strategic Developments in Fig Ingredient (Last 24 Months)
- 6.5.1 Mergers, Acquisitions & Divestments
- 6.5.2 New Fig Ingredient Launches
- 6.5.3 Facility Expansions
- 6.5.4 Strategic Alliances, Joint Ventures & Partnerships
- 6.5.5 Distribution Expansion & Market Entry
- 6.5.6 Sustainability & ESG Initiatives
- 6.6 Competitive Strategy Mapping
- 6.6.1 Leader, Challenger, Follower & Niche Classification
- 6.6.2 Pricing Strategy Comparison
- 6.6.3 Channel Strategy Matrix
Note: Strategic developments are included based on their materiality and the availability of reliable information.
Chapter 7. Global Fig Ingredient Market – By Distribution Channel
- 7.1 Segment Overview
- 7.1.1 Volume & Revenue Split by Channel (2024 & 2032)
- 7.1.2 Channel Mix Evolution (2024-2032)
Chapter 8. Regional Market Analysis – Global Overview
- 8.1 Global Regional Overview
- 8.1.1 Regional Volume Share
- 8.1.2 Regional Revenue Share
- 8.1.3 Regional Volume by Region
- 8.1.4 Regional Revenue by Region
- 8.1.5 Regional Forecast Through 2032
- 8.2 Cross-Regional Segment Analysis
- 8.2.1 By Distribution Channel
- 8.2.2 By Brand/Price Tier
Chapter 9. North America Fig Ingredient Market
- 9.1 United States
- 9.2 Canada
- 9.3 Mexico
Chapter 10. Europe Fig Ingredient Market
- 10.1 Germany
- 10.2 France
- 10.3 Italy
- 10.4 United Kingdom
- 10.5 Spain
- 10.6 Poland
- 10.7 Russia
- 10.8 Netherlands
- 10.9 Belgium
- 10.10 Sweden
- 10.11 Denmark
- 10.12 Norway
- 10.13 Rest of Europe
Chapter 11. Asia Pacific Fig Ingredient Market
- 11.1 China
- 11.2 India
- 11.3 Japan
- 11.4 South Korea
- 11.5 Thailand
- 11.6 Indonesia
- 11.7 Vietnam
- 11.8 Malaysia
- 11.9 Australia
- 11.10 Rest of Asia Pacific
Chapter 12. Latin America Fig Ingredient Market
- 12.1 Brazil
- 12.2 Argentina
- 12.3 Colombia
- 12.4 Chile
- 12.5 Rest of Latin America
Chapter 13. Middle East Fig Ingredient Market
- 13.1 Saudi Arabia
- 13.2 United Arab Emirates
- 13.3 Turkey
- 13.4 Israel
- 13.5 Iran
- 13.6 Rest of the Middle East
Chapter 14. Africa Fig Ingredient Market
- 14.1 South Africa
- 14.2 Egypt
- 14.3 Nigeria
- 14.4 Morocco
- 14.5 Rest of Africa
Chapter 15. Fig Ingredient Company Profiles
- 15.1 [Company 01]
- 15.1.1 Company Overview
- 15.1.2 Key Management Personnel
- 15.1.3 Products & Services Portfolio
- 15.1.4 Financial Performance
- 15.1.5 Key Market Focus & Geographic Presence
- 15.1.6 Recent Developments & Strategic Initiatives
Note: The company profile list is preliminary and may change based on research findings, market developments, data availability, and client requirements.
Chapter 16. Appendices
- Appendix A – List of Abbreviations & Acronyms
- Appendix B – Industry Classification Code Reference – Full Series
- Appendix C – Production & Capacity Data Tables
- Appendix D – End-Use & Demand Base Tables
- Appendix E – Consumption & Replacement Rate Assumptions
- Appendix F – ASP Reference Tables
- Appendix G – Manufacturing & Facility Database
- Appendix H – Import-Export Data Tables
- Appendix I – Regulatory Summary Tables
- Appendix J – Primary Research Participant List (Anonymized)
- Appendix K – Primary Research Questionnaire Framework
- Appendix L – Data Sources & Bibliography
- Appendix M – Market Size Divergence & Source Comparison
Chapter 17. Research Methodology
- 17.1 Research Framework & Philosophy
- 17.2 Secondary Research – Sources, Hierarchy & Data Extraction
- 17.3 Data Modeling – Bottom-Up & Top-Down Market Sizing
- 17.4 Primary Research – Stakeholder Framework, LOI & Sample Sizes
- 17.5 Forecast Methodology – Regression, Scenario & Sensitivity Analysis
- 17.6 Quality Control – Four-Layer Validation Framework
- 17.7 Limitations & Standard Assumptions
- 17.8 Disclaimer
