Market Overview
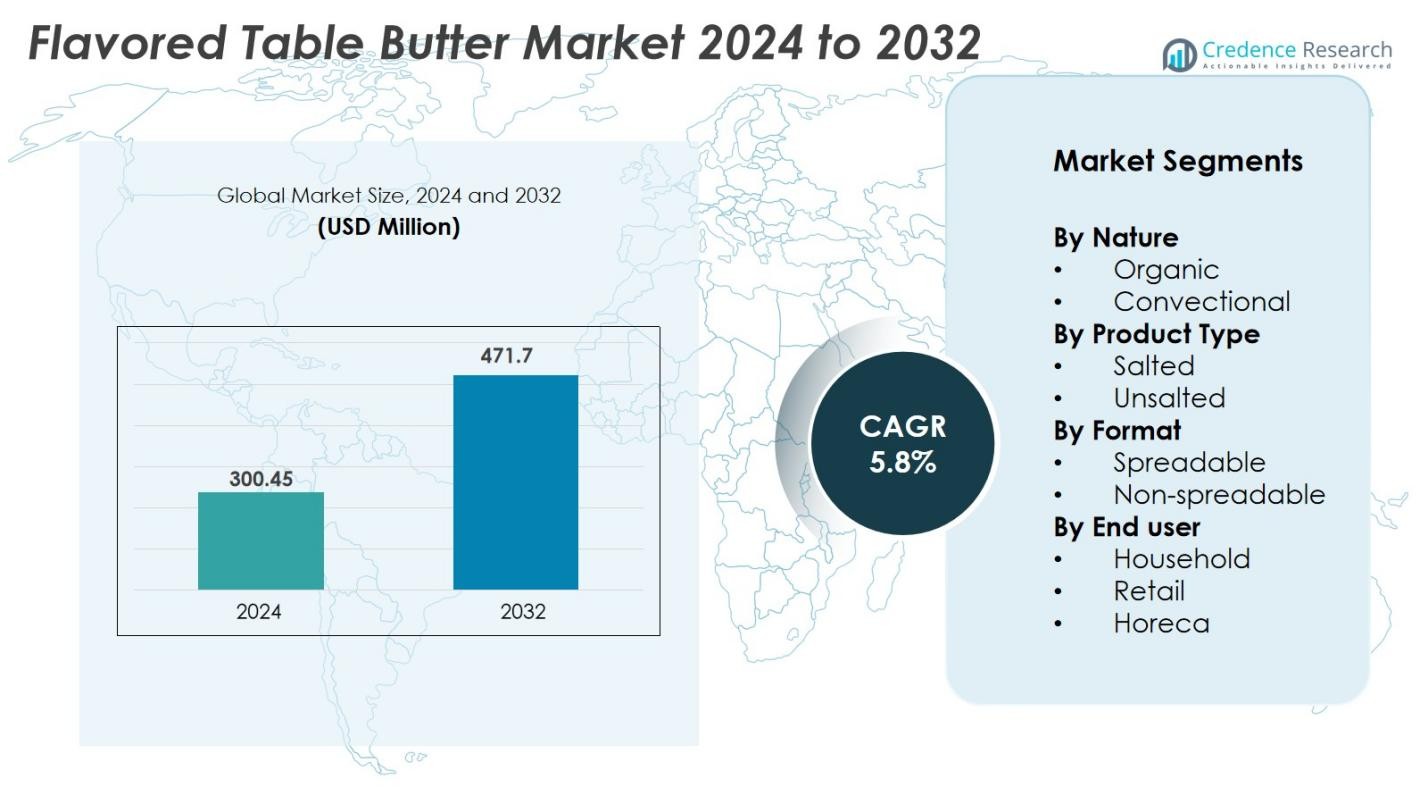
Flavored Table Butter Market size was valued at USD 300.45 Million in 2024 and is anticipated to reach USD 471.7 Million by 2032, at a CAGR of 5.8% during the forecast period.
| REPORT ATTRIBUTE |
DETAILS |
| Historical Period |
2020-2023 |
| Base Year |
2024 |
| Forecast Period |
2025-2032 |
| Flavored Table Butter Market Size 2024 |
USD 300.45 Million |
| Flavored Table Butter Market, CAGR |
5.8% |
| Flavored Table Butter Market Size 2032 |
USD 471.7 Million |
Flavored Table Butter Market features a competitive landscape led by major players such as Unilever (U.K.), Procter & Gamble (U.S.), The J.M. Smucker Company (U.S.), Hormel Foods Corporation (U.S.), and The Kraft Heinz Company (U.S.). These companies hold strong market positions through wide product portfolios, innovative flavor offerings, and robust distribution channels. Regional players like Britannia Dairy Private Limited (India) also contribute significantly by catering to local tastes. North America leads the global market with a 32% share, driven by strong consumer preferences for premium dairy products, flavor innovation, and well-established retail infrastructure. The combination of local and global strategies supports market expansion.
Market Insights
- The Flavored Table Butter market was valued at USD 300.45 Million in 2024 and is projected to reach USD 471.7 Million by 2032, growing at a CAGR of 5.8% during the forecast period.
- Rising consumer demand for premium, flavored spreads and healthier butter alternatives is a key driver, supported by innovations in organic and functional ingredient formulations.
- Market trends include growing popularity of artisanal, plant-based, and exotic flavor variations, with spreadable formats holding around 68% of segment share.
- Competitive dynamics feature established players like Unilever, Procter & Gamble, and Kraft Heinz, alongside emerging regional brands, driving flavor innovation and customized product offerings.
- Regionally, North America leads with a 32% share, followed by Europe at 28% and Asia Pacific at 25%; challenges include high pricing in emerging markets and regulatory compliance affecting product entry and expansion.
Access crucial information at unmatched prices!
Request your sample report today & start making informed decisions powered by Credence Research Inc.!
Download Sample
Market Segmentation Analysis
By Nature
In the Flavored Table Butter market, the conventional segment dominates with 72% market share in 2024, driven by its widespread availability, lower price points, and preference among mass consumers. The conventional segment benefits from established distribution networks and familiarity among household buyers, especially in developing markets. In contrast, the organic segment, while smaller, is growing steadily due to rising health awareness, premiumization of dairy products, and increasing consumer preference for clean-label, non-GMO ingredients. The organic category is expected to see accelerated adoption, especially in urban and high-income consumer groups.
- For instance, Heritage Pasturised Table Butter offers traditional flavors with a consistent nutritional profile, including 80g total fat and 52g saturated fat per 100g serving, appealing to regular consumers seeking reliable quality.
By Product Type
The salted flavored butter segment leads the market with 64% share, driven primarily by consumer preference for enhanced taste and its extensive use in both household and foodservice applications. Salted varieties also benefit from longer shelf life and versatility across dishes, from spreads to baking. Meanwhile, the unsalted flavored butter segment appeals to consumers seeking controlled sodium intake and those using butter for culinary purposes where flavor customization is required. Growing awareness of health needs and a rise in gourmet cooking at home are fueling the steady growth of unsalted offerings in the segment.
- For instance, Cabot Creamery highlights that salted butter lasts about five months compared to unsalted butter’s three months, helping reduce waste and maintain freshness.
By Format
The spreadable flavored butter format holds a dominant share of 68%, attributed to its convenience, ease of use, and compatibility with everyday foods like bread, bagels, and snacks. The rise in on-the-go consumption and premium breakfast trends further supports demand for spreadable options. Non-spreadable flavored butter, while less popular, continues to serve specific culinary applications such as baking and cooking. Its growth is supported by increasing use in specialty foods and recipes, primarily among professional chefs and informed home cooks seeking enhanced texture and flavor precision.
Key Growth Drivers
Rising Consumer Preference for Premium and Artisanal Food Products
The growing inclination toward premiumization in the food and beverage industry is significantly driving the flavored table butter market. Consumers, especially in urban and high-income segments, increasingly prefer gourmet and artisanal flavored butters that offer unique taste profiles and high-quality ingredients. This shift is spurred by a broader trend toward experiential eating, where consumers seek indulgent yet wholesome products. Brands are responding by introducing varieties infused with herbs, spices, fruit extracts, and regional flavors. Additionally, trends in home baking, culinary experimentation, and social media food culture are further boosting demand.
- For instance, Fabrique Delices Black Truffle Butter features real black truffle pieces, providing a luxury experience that appeals to consumers seeking indulgent, high-end spreads for special occasions.
Growing Awareness of Functional and Health-Enhancing Ingredients
Health-conscious consumers are driving demand for flavored butters that incorporate functional ingredients with added nutritional value. This includes products infused with natural herbs, probiotics, or superfoods that provide digestive, anti-inflammatory, or antioxidant benefits. The increasing attention to ingredient transparency and cleaner label claims is encouraging manufacturers to reformulate their products using organic, grass-fed, or plant-based dairy sources. This aligns with the global push towards wellness and preventive nutrition. Moreover, flavored butters are gradually replacing traditional spreads like margarine due to growing awareness of clean fats and natural dairy benefits. The market’s shift towards healthier indulgence is also stimulating product innovation within the natural and organic categories.
- For instance, Butterball Farms offers plant-based flavored butters made with healthy ingredients like turmeric, ginger, and flax seeds, aligning with consumers’ interest in natural, wellness-boosting additives.
Expansion of Retail and E-commerce Distribution Channels
The proliferation of modern retail formats and e-commerce platforms is significantly bolstering the availability and visibility of flavored table butter globally. Supermarkets, hypermarkets, and specialty grocery chains have expanded refrigerated sections to accommodate premium and niche butter products. Simultaneously, the rise of online grocery platforms and quick commerce delivery services enables consumers to access a wider range of flavored butter options conveniently. Digital channels provide opportunities for brands to target niche audiences with personalized messaging and promotions. Subscription-based models and direct-to-consumer (D2C) brands are gaining traction in major economies, offering curated butter assortments.
Key Trends & Opportunities
Innovation in Flavor Profiles and Customization
Manufacturers and brands in the flavored table butter market are increasingly focusing on innovative flavor development to cater to diverse consumer preferences. Beyond traditional options, brands are experimenting with bold and exotic blends such as smoked chili, honey-cinnamon, truffle, and lemon-dill. This shift aligns with the global trend toward experimentation in home cooking and interest in world cuisines. Personalized flavor options and limited-edition releases offer opportunities to attract adventurous eaters and seasonal demand. Additionally, partnerships with premium restaurants and celebrity chefs allow brands to co-create signature spreads that appeal to gourmet consumers.
- For instance, Savor’s animal- and plant-free butter, developed in collaboration with Michelin-starred chefs, introduces innovative mouthfeel and texture options tailored to gourmet kitchens.
Growth of Plant-Based and Lactose-Free Alternatives
An emerging opportunity in the flavored table butter market lies in the increasing consumer demand for plant-based and lactose-free products. With rising cases of lactose intolerance, dairy allergies, and shifts toward vegan lifestyles, brands are introducing flavored butter alternatives using coconut oil, almond milk, and other plant-based ingredients. These products are gaining traction among environmentally conscious consumers who seek sustainable, cruelty-free alternatives without sacrificing taste or texture. Leading companies are enhancing product formulations to mimic the creaminess and flavor richness of traditional butter. This trend also opens doors for dairy brands to diversify their portfolio and appeal to broader demographics.
- For instance, White Cub offers plant-based butter made from coconut oil and fortified with vitamins B12 and D2, mimicking traditional butter’s flavor and nutrition.
Key Challenges
High Price Sensitivity in Developing Economies
One of the major challenges in the flavored table butter market is the sensitivity to pricing, particularly in price-conscious regions such as Asia and Latin America. Premium flavored butters, especially those with organic or artisanal positioning, often carry a higher price tag due to elevated production costs, specialized ingredients, and smaller batch manufacturing. This limits their accessibility to middle-income groups and restricts penetration beyond urban centers. Additionally, fluctuations in dairy prices and supply chain disruptions can affect overall production costs, forcing brands to make hard choices between margin protection and competitive pricing.
Stringent Regulatory and Labeling Compliance
The flavored table butter market faces rigorous regulatory requirements related to food labeling, health claims, and dairy standards. Ensuring compliance with local regulations, such as EU food safety laws or the U.S. FDA labeling guidelines, poses a significant challenge, especially for smaller producers entering multiple international markets. Claims related to organic certification, health benefits, or “clean label” status must be backed by credible data to avoid penalties or brand reputation risks. In addition, flavored products may need to adhere to specific additive and preservative regulations, further increasing the time and cost of product development. As the market aligns with global clean label and transparency initiatives, brands must invest in compliance mechanisms and third-party certifications, which can slow down innovation and increase operational complexity.
Regional Analysis
North America
North America holds a significant share of the flavored table butter market, commanding 32% of global revenue in 2024. The region’s growth is driven by a strong consumer preference for premium and gourmet foods, diverse flavor innovation, and the presence of established dairy brands. High disposable incomes and evolving culinary trends, including the popularity of home baking and artisanal spreads, further support market expansion. The U.S. and Canada lead demand, with products increasingly featured in retail and specialty stores. The rise of organic and functional flavored butters also fuels this region’s steady market performance.
Europe
Europe captures 28% of the flavored table butter market share in 2024, supported by a long-standing tradition of butter consumption and a mature market for dairy-based spreads. Countries like France, Germany, and the U.K. are key consumers, with growing interest in innovative flavors and organic variants. The region’s stringent food quality standards and consumer preference for natural ingredients promote clean-label product adoption. Additionally, the premiumisation trend across the bakery and breakfast segment drives consumption of high-quality flavored butters. The market’s growth is steady, bolstered by well-established distribution networks and evolving dietary preferences.
Asia Pacific
Asia Pacific represents 25% of the global flavored table butter market in 2024, driven by rising urbanization, Western dietary influence, and expanding middle-class incomes. Countries like India, China, and Japan are emerging traction points for premium dairy products, including flavored butter. The growing bakery industry, coupled with regional interest in innovative, fusion flavors, supports demand. Additionally, the increasing availability of international brands through modern trade and e-commerce routes is enhancing accessibility. While price sensitivity remains a barrier in rural areas, urban consumers are embracing high-quality flavored spreads, creating a substantial growth opportunity in the region.
Latin America
Latin America holds 8% of the flavored table butter market, driven by rising consumption of bakery and packaged foods and the gradual introduction of premium dairy products. Countries like Brazil, Argentina, and Mexico are key contributors, benefiting from improving economic conditions and growing foodservice investments. The market remains relatively nascent but is gaining momentum as consumers become more exposed to flavored spreads through retail chains and quick-service restaurants. However, high price sensitivity and limited cold-chain infrastructure in rural areas present challenges. Growth prospects remain positive with the expansion of modern trade and emerging local brands.
Middle East & Africa
The Middle East & Africa accounts for 7% of the flavored table butter market in 2024. Growth is led by increasing western food adoption, rising incomes in urban areas, and greater availability of imported dairy products. The Gulf Cooperation Council (GCC) countries represent a significant share, with strong demand for premium and halal-certified flavored butters. African markets, although smaller, are seeing rising interest among middle-class consumers. However, challenges such as fluctuating import costs and limited local production capacity restrict faster penetration. Ongoing investments in food retail infrastructure are likely to support future expansion of flavored butter offerings across the region.
Market Segmentations
By Nature
By Product Type
By Format
- Spreadable
- Non-spreadable
By End user
By Geography
- North America
- Europe
- Germany
- France
- U.K.
- Italy
- Spain
- Rest of Europe
- Asia Pacific
- China
- Japan
- India
- South Korea
- South-east Asia
- Rest of Asia Pacific
- Latin America
- Brazil
- Argentina
- Rest of Latin America
- Middle East & Africa
- GCC Countries
- South Africa
- Rest of the Middle East and Africa
Competitive Landscape
The competitive landscape of the Flavored Table Butter market is moderately fragmented, featuring a mix of established global brands and emerging regional players. Key companies such as Unilever (U.K.), Procter & Gamble (U.S.), The J.M. Smucker Company (U.S.), Hormel Foods Corporation (U.S.), and The Kraft Heinz Company (U.S.) maintain a strong market presence through diversified product portfolios, extensive distribution networks, and strategic marketing initiatives. These leaders focus on innovation in flavors, organic formulations, and value-added products to cater to evolving consumer preferences. Regional players like Britannia Dairy Private Limited (India) and Justin’s, LLC (U.S.) are gaining traction through customized offerings and localized strategies. Increasing demand for artisanal and clean-label flavored butters is driving differentiation across brands. Strategic partnerships, acquisitions, and investments in product development are common strategies adopted to enhance market share and expand geographic reach in this growing category.
Key Player Analysis
- Britannia Dairy Private Limited (India)
- Justin’s, LLC (U.S.)
- Conagra Brands, Inc. (U.S.)
- The Kraft Heinz Company (U.S.)
- Butter Buds Inc. (U.S.)
- Procter & Gamble (U.S.)
- Hormel Foods Corporation (U.S.)
- Unilever (U.K.)
- The J.M. Smucker Company (U.S.)
- Hormel Foods Corporation (U.S.)
Recent Developments
- In November 2025, SpartanNash rolled out a new line of flavored butters under its “Fresh & Finest by Our Family®” brand including cinnamon butter, garlic herb butter, truffle butter and more available at select stores.
- In September 2025, All Things Butter (UK) introduced a new Truffle Butter targeting cooking-enthusiast consumers.
- In September 2024, Epicurean Butter partnered with A.1. Steak Sauce (a brand of Kraft Heinz) to nationally launch A.1. Steakhouse Butter, a flavored butter product combining A.1. steak-sauce flavour, fresh herbs, and butter.
Shape Your Report to Specific Countries or Regions & Enjoy 30% Off!
Report Coverage
The research report offers an in-depth analysis based on Nature, Product Type, Format, End-User and Geography. It details leading market players, providing an overview of their business, product offerings, investments, revenue streams, and key applications. Additionally, the report includes insights into the competitive environment, SWOT analysis, current market trends, as well as the primary drivers and constraints. Furthermore, it discusses various factors that have driven market expansion in recent years. The report also explores market dynamics, regulatory scenarios, and technological advancements that are shaping the industry. It assesses the impact of external factors and global economic changes on market growth. Lastly, it provides strategic recommendations for new entrants and established companies to navigate the complexities of the market.
Future Outlook
- The flavored table butter market will experience steady growth driven by demand for premium culinary products.
- Increased consumer interest in gourmet and artisanal flavors will further diversify product offerings.
- Health-conscious consumers will favor organic and clean-label butter options.
- Plant-based and lactose-free flavored butter alternatives will gain more traction.
- Digital retail channels will continue to expand market accessibility and reach.
- Innovation in packaging and shelf-stable formats will enhance product convenience.
- Emerging economies will contribute significantly to market volume growth.
- Strategic collaborations with chefs and restaurants will boost flavor experimentation.
- Sustainability and ethical sourcing will become core brand differentiation factors.
- Regulatory alignment and compliance will be critical for cross-border market expansion.


