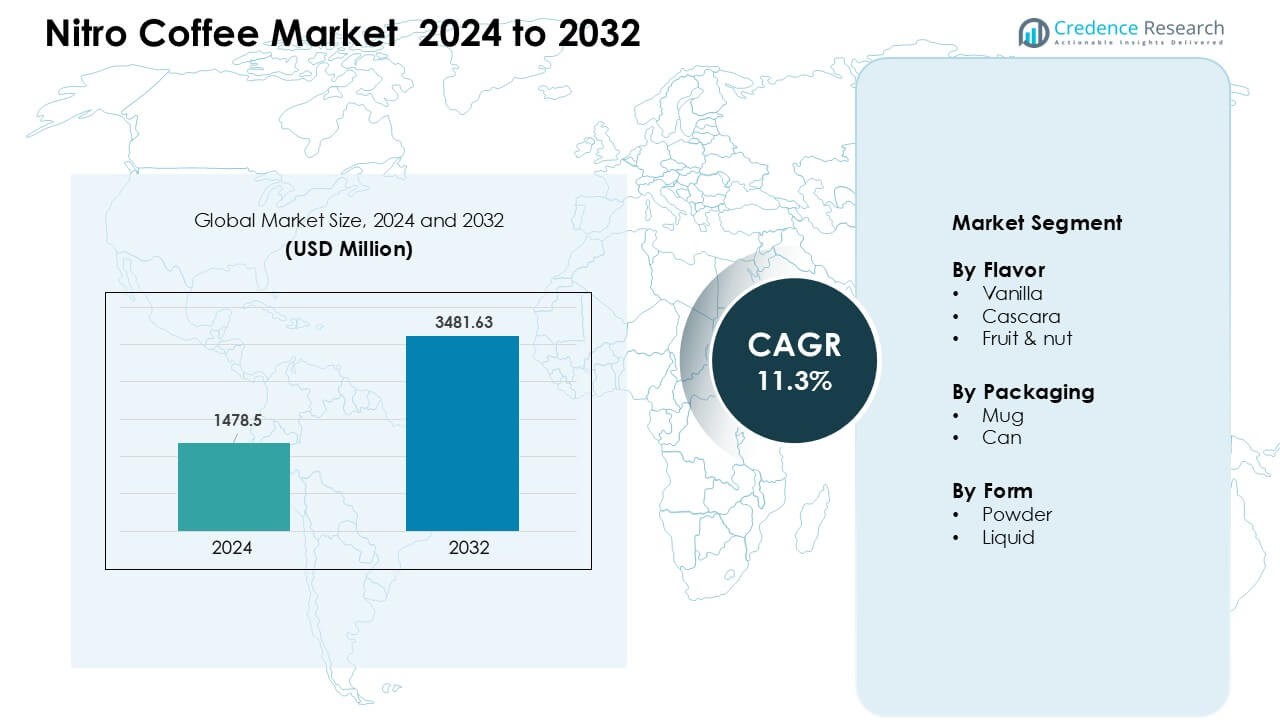
Home » Food & Beverage » Nitro Coffee Market

Nitro Coffee Market By Flavors (Oat Milk Nitrogenated Coffee, Classic Latte Nitrogenated Coffee, Mocha Latte Nitrogenated Coffee, Coconut Nitrogenated Coffee, Vanilla Nitrogenated Coffee, Other Nitrogenated Coffee) By Packaging (Nitrogenated Coffee Cans, Nitrogenated Coffee in Glass Bottles) – Growth, Future Prospects & Competitive Analysis, 2016 – 2028

Price: $4999

Published: | Report ID: 14403 | Report Format : PDF

About this report

The global Nitro Coffee Market report explores the critical analysis of the Nitro Coffee industry using key parameters. The report consists of investment strategies, the need for investments in the Nitro Coffee industry, and the multiple benefits for the investors. Importantly, this report sets out major changes in the global technical regulations for the Nitro Coffee industry and how economic and non-economic barriers are helping the Nitro Coffee market grow. Moreover, the report analyzes the global, regional, and country-level historic and forecasted market size. The report also provides a comprehensive analysis of key investment propositions, demand and supply gap, competitors positioning, STAR analysis, SRC analysis, and Tornado analysis. Key technological developments and other analyses such as porter’s five forces analysis, PESTEL analysis, value chain analysis, etc.

Key Highlights of the report

How are the major segments performing in the Nitro Coffee Market?

In 2021, with more than 60.0% of the total industry revenue, the can segment led the market. Many customers choose to sip their cold brew at restaurants or coffee shops that provide the beverage in cans.

Vanilla had the highest revenue proportion by flavor as of 2021, accounting for more than 40.0%. The demand for vanilla-flavored coffee is very high worldwide. It is among the most well-liked flavors on the entire planet. The coffee’s sharp flavor is complemented by its mellow, sweet flavor, which mixes in seamlessly. This flavor is available worldwide in several local or national-level cafés.

Design Element 2

Access crucial information at unmatched prices!

Request your free sample report today & start making informed decisions powered by Credence Research!

Download Free Sample
CTA Design Element 3

Which region dominated the Nitro Coffee Market?

North America accounted for more than 80% of global revenue in 2021. The National Coffee Association estimates that as of 2018, 64% of Americans drank coffee. Three cups of coffee are consumed by an average American every day. In this area, cold brew coffee has grown more rapidly than iced coffee during the last few years. The cold brew had a 42% faster growth rate than the iced drink as of 2020. Due to the high density of coffee drinkers in this area, numerous corporations have been establishing and growing their operations there.

What is the competitive environment of the Nitro Coffee Market?

The nitro coffee industry’s competitive environment offers information on the total economic profit made by suppliers and businesses, the sales and revenues produced in this sector, the nitro coffee market share globally, the business organization overview, the introduction of new products, and the opportunities for the nitro coffee market. Major competitors focus on nitro coffee flavor innovation to gain a competitive advantage. For instance, Starbucks Reserve, which sells unique and uncommon items, introduced Starbucks Nitro Dirty Chai, a coffee and chai blend, in July 2017. This creative cold brew is anticipated to become a popular summer beverage.

Executive Summary

What are the developments being developed in the Nitro Coffee Market?

The development of cost-effective manufacturing methods and technological advancements are projected to significantly benefit the food and beverage industry and the worldwide nitrogenated coffee market. Nitrogenated coffee has several appealing qualities, including low calories, organic, shelf-stable, and artisan beverages.

Which are the key investments by the players in the Nitro Coffee Market?

Key players make various investments throughout the market to expand their store outlets across various regions and innovations. For instance, In China, Starbucks Corporation’s store count climbed from 1,017 in 2013 to 3,300 in 2018. Starbucks Nitro Dirty Chai, a blend of coffee and chai, was introduced in July 2017 by Starbucks Reserve, a division specializing in unusual and exceptional goods. This creative cold brew is anticipated to become a popular summer beverage.

Some of the major players in the market are Stumptown Coffee Roasters, Rise Brewing Co., Coffee Company, Starbucks Corporation, Lucky Jack, Califia Farms, Caveman Coffee Co., Convergent Coffee Co., and Blackeye Roasting Co.).

What are the Major Driving Factors for the Nitro Coffee Market?

Over the coming years, one of the key aspects influencing the market for nitrogenated coffee is anticipated to be the growth of the market for cold beverages. Additionally, the market for nitrogenated coffee grew due to quickly shifting consumer behavior and an increase in canned ready-to-drink coffee. The development of cost-effective manufacturing methods and technological advancements are projected to significantly benefit the food and beverage industry and the worldwide nitrogenated coffee market. Nitrogenated coffee has several appealing qualities, including low calories, organic, shelf-stable, and artisan beverages.

What are the Major Risks for the Nitro Coffee Market?

Although there are many end users in the nitrogenated coffee market, various barriers could potentially restrain market expansion. The growth of the nitrogenated coffee market is fuelled by the population’s growing health consciousness and reduced sales of fizzy drinks. In the forecasted years, the market for nitrogenated coffee may see growth challenges due to a lack of consumer awareness and inadequate distribution channels. Because traditional coffee drinkers are hesitant to try nitrogenated coffee, the market for nitrogenated coffee is growing in income.

Which is the key Packaging in the Nitro Coffee Market?

The cans sector led with more than 60.0% of the total industry revenue in 2021. Many customers choose to sip their cold brew at restaurants or coffee shops that provide the beverage in cans. As a result, the product used to fill cans generated most of the sales. The serving table has a specific tap that releases the product, giving it a bar-like appearance. The nitrogenated coffee business has found this serving method appealing in cities like Portland.

The Packaging for cans is also expected to grow at the fastest rate. The global market for canned goods is anticipated to rise in response to consumer demand for ready-to-drink beverages and convenience. In Ireland and UK, Nescafé Azera Nitro, a new line of coffee products injected with nitrogen, was introduced by Nestlé in March 2018. Nescafé Azera Nitro Latte and Nescafé Azera Nitro Americano are these cans’ flavors.

How is the Nitro Coffee Market performing in regions?

In 2021, more than 80% of worldwide income came from North America. According to the National Coffee Association, 64% of Americans drink coffee as of 2018. Every day, the average American consumes three cups of coffee. In recent years, cold brew coffee has expanded in this market more quickly than iced coffee. By 2020, the cold brew was growing at a rate that was 42% higher than the iced beverage. Numerous businesses have been expanding their operations in this area because of the large density of coffee drinkers there.

During the forecast period, Asia Pacific is anticipated to grow the fastest. Cold brew consumption has been rising in Asia, particularly in China, Japan, South Korea, Indonesia, the Philippines, Malaysia, and Thailand. International coffee shops, like Starbucks Corporation, have been quickly growing their locations in these countries during the past few years. For instance, the number of Starbucks Corporation locations in China expanded from 1,017 in 2013 to 3,300 in 2018.

What is the regulatory landscape for the Nitro Coffee Market?

The regulatory landscape for this market is that governments monitor the permissible caffeine levels, the level of roasted coffee and so on. For instance, food safety and hygiene are the primary concerns of European Union legislation regarding food goods like coffee. The governing body in this area is the General Food Law. The quality of food items is ensured by this law across the entire supply chain. Products won’t be allowed into the European Union if they’re unsafe.

What is the Market Size of Nitro Coffee regarding value?

The global Nitro Coffee Market is anticipated to grow at a substantial CAGR of 3.9% in the upcoming years. The global Nitro Coffee industry was estimated to be worth USD 35.9 billion in 2021 and was expected to be worth USD 45.2 billion by 2028.

Shape Your Report to Specific Countries or Regions & Enjoy 30% Off!

What are the major players planning for the future of the Nitro Coffee Market?

The key players in the Nitro Coffee market are investing heavily in numerous sectors, including different flavors and unique tastes of coffee. Furthermore, according to the future scenarios, well-known market giants would invest heavily in small and medium-sized firms in order to offer practical solutions to the sector. High odds exist that significant players may buy out or merge with major businesses or startups in order to achieve a competitive advantage.

Segmentation of Global Nitro Coffee Market-

Global Nitro Coffee Market – By Flavors

  • Oat Milk Nitrogenated Coffee
  • Classic Latte Nitrogenated Coffee
  • Mocha Latte Nitrogenated Coffee
  • Coconut Nitrogenated Coffee
  • Vanilla Nitrogenated Coffee
  • Other Nitrogenated Coffee

 Global Nitro Coffee Market – By Packaging

  • Nitrogenated Coffee Cans
  • Nitrogenated Coffee in Glass Bottles

Global Nitro Coffee Market – By Distribution Channel

  • Nitrogenated Coffee Sales via Convenience Stores
  • Nitrogenated Coffee Sales via Specialty Stores
  • Nitrogenated Coffee Sales via Supermarkets/Hypermarkets
  • Nitrogenated Coffee Sales via Online retailers

Global Nitro Coffee Market – By Region

  • North America
    • USUS.
    • Canada
  • Europe
    • Germany
    • France
    • U.K.
    • Italy
    • Spain
    • Rest of Europe
  • Asia Pacific
    • China
    • Japan
    • India
    • South Korea
    • South-east Asia
    • Rest of Asia Pacific
  • Latin America
    • Brazil
    • Mexico
    • Rest of Latin America
  • Middle East & Africa
    • GCC Countries
    • South Africa
    • Rest of Middle East and Africa

1. Preface
1.1. Report Description
1.1.1. Purpose of the Report
1.1.2. Target Audience
1.1.3. USP and Key Offerings
1.2. Research Scope
1.3. Research Methodology
1.3.1. Phase I – Secondary Research
1.3.2. Phase II – Primary Research
1.3.3. Phase III – Expert Panel Review
1.3.4. Approach Adopted
1.3.4.1. Top-Down Approach
1.3.4.2. Bottom-Up Approach
1.3.5. Assumptions
1.4. Market Segmentation

2. Executive Summary
2.1. Market Snapshot: Global Nitro Coffee Market
2.2. Global Nitro Coffee Market, By Flavors
2.3. Global Nitro Coffee Market, By Packaging
2.4. Global Nitro Coffee Market, By Distribution Channel
2.5. Global Nitro Coffee Market, By Region

3. Market Dynamics & Factors Analysis
3.1. Introduction
3.1.1. Global Nitro Coffee Market Value, 2016-2028, (US$ Bn)
3.2. Market Dynamics
3.2.1. Key Growth Trends
3.2.2. Market Drivers
3.2.3. Market Restraints
3.2.4. Market Opportunities
3.2.5. Major Industry Challenges
3.3. Attractive Investment Proposition,2021
3.3.1. Product
3.3.2. Age Group
3.3.3. Sales Channel
3.3.4. Platform
3.3.5. End User
3.3.6. Geography

4. Premium Insights
4.1. STAR (Situation, Task, Action, Results) Analysis
4.2. Porter’s Five Forces Analysis
4.2.1. Threat of New Entrants
4.2.2. Bargaining Power of Buyers/Consumers
4.2.3. Bargaining Power of Suppliers
4.2.4. Threat of Substitute Types
4.2.5. Intensity of Competitive Rivalry
4.3. Value Chain Analysis
4.4. Technology Analysis
4.5. Marketing Strategy Analysis
4.5.1. Direct Marketing
4.5.2. Indirect Marketing
4.5.3. Marketing Channel Development Trend

5. Market Positioning of Key Players, 2021
5.1. Company market share of key players, 2021
5.2. Competitive Benchmarking
5.3. Market Positioning of Key Vendors
5.4. Geographical Presence Analysis
5.5. Major Strategies Adopted by Key Players
5.5.1. Key Strategies Analysis
5.5.2. Mergers and Acquisitions
5.5.3. Partnerships
5.5.4. Product Launch
5.5.5. Geographical Expansion
5.5.6. Others

6. COVID 19 Impact Analysis
6.1. Global Nitro Coffee Market Pre Vs Post COVID 19, 2019 – 2028
6.2. Impact on Import & Export
6.3. Impact on Demand & Supply

7. Global Nitro Coffee Market
7.1. Global Nitro Coffee Market, By Flavors, 2016-2028(US$ Bn)
7.1.1. Overview
7.1.2. Global Nitro Coffee Market, By Flavors, 2021 vs 2028 (in%)
7.1.3. Global Nitro Coffee Market, By Oat Milk Nitrogenated Coffee, 2016-2028 (US$ Bn)
7.1.4. Global Nitro Coffee Market, By Classic Latte Nitrogenated Coffee, 2016-2028 (US$ Bn)
7.1.5. Global Nitro Coffee Market, By Mocha Latte Nitrogenated Coffee, 2016-2028 (US$ Bn)
7.1.6. Global Nitro Coffee Market, By Coconut Nitrogenated Coffee, 2016-2028 (US$ Bn)
7.1.7. Global Nitro Coffee Market, By Vanilla Nitrogenated Coffee, 2016-2028 (US$ Bn)
7.1.8. Global Nitro Coffee Market, By Other Nitrogenated Coffee Flavors, 2016-2028 (US$ Bn)
7.2. Global Nitro Coffee Market, By Packaging, 2016-2028(US$ Bn)
7.2.1. Overview
7.2.2. Global Nitro Coffee Market, By Packaging, 2021 vs 2028 (in%)
7.2.3. Global Nitro Coffee Market, By Cans, 2016-2028 (US$ Bn)
7.2.4. Global Nitro Coffee Market, By Glass Bottles, 2016-2028 (US$ Bn)
7.3. Global Nitro Coffee Market, By Distribution Channel, 2016-2028(US$ Bn)
7.3.1. Overview
7.3.2. Global Nitro Coffee Market, By Distribution Channel, 2021 vs 2028 (in%)
7.3.3. Global Nitro Coffee Market, By Hypermarkets/Supermarkets, 2016-2028 (US$ Bn)
7.3.4. Global Nitro Coffee Market, By Convenience Stores, 2016-2028 (US$ Bn)
7.3.5. Global Nitro Coffee Market, By Specialty Stores, 2016-2028 (US$ Bn)
7.3.6. Global Nitro Coffee Market, By Online Stores, 2016-2028 (US$ Bn)

8. North America Nitro Coffee Market Analysis
8.1. North America Nitro Coffee Market, By Flavors, 2016-2028(US$ Bn)
8.1.1. Overview
8.1.2. SRC Analysis
8.2. North America Nitro Coffee Market, By Packaging, 2016-2028(US$ Bn)
8.2.1. Overview
8.2.2. SRC Analysis
8.3. North America Nitro Coffee Market, By Distribution Channel, 2016-2028(US$ Bn)
8.3.1. Overview
8.3.2. SRC Analysis
8.4. North America Nitro Coffee Market, by Country, 2016-2028 (US$ Bn)
8.4.1. U.S.
8.4.1.1. U.S. Nitro Coffee Market Estimates and Forecast, 2016-2028 (US$ Bn)
8.4.1.2. U.S. Nitro Coffee, By Flavors, 2016-2028 (US$ Bn)
8.4.1.3. U.S. Nitro Coffee, By Packaging, 2016-2028 (US$ Bn)
8.4.1.4. U.S. Nitro Coffee, By Distribution Channel, 2016-2028 (US$ Bn)
8.4.2. Canada
8.4.2.1. Canada Nitro Coffee Market Estimates and Forecast, 2016-2028 (US$ Bn)
8.4.2.2. Canada Nitro Coffee, By Flavors, 2016-2028 (US$ Bn)
8.4.2.3. Canada Nitro Coffee, By Packaging, 2016-2028 (US$ Bn)
8.4.2.4. Canada Nitro Coffee, By Distribution Channel, 2016-2028 (US$ Bn)

9. Europe Nitro Coffee Market Analysis
9.1. Europe Nitro Coffee Market, By Flavors, 2016-2028(US$ Bn)
9.1.1. Overview
9.1.2. SRC Analysis
9.2. Europe Nitro Coffee Market, By Packaging, 2016-2028(US$ Bn)
9.2.1. Overview
9.2.2. SRC Analysis
9.3. Europe Nitro Coffee Market, By Distribution Channel, 2016-2028(US$ Bn)
9.3.1. Overview
9.3.2. SRC Analysis
9.4. Europe Nitro Coffee Market, by Platform, 2016-2028(US$ Bn)
9.4.1. Overview
9.4.2. SRC Analysis
9.5. Europe Nitro Coffee Market, by End User, 2016-2028(US$ Bn)
9.5.1. Overview
9.5.2. SRC Analysis
9.6. Europe Nitro Coffee Market, by Country, 2016-2028 (US$ Bn)
9.6.1. Germany
9.6.1.1. Germany Nitro Coffee Market Estimates and Forecast, 2016-2028 (US$ Bn)
9.6.1.2. Germany Nitro Coffee, By Flavors, 2016-2028 (US$ Bn)
9.6.1.3. Germany Nitro Coffee, By Packaging, 2016-2028 (US$ Bn)
9.6.1.4. Germany Nitro Coffee, By Distribution Channel, 2016-2028 (US$ Bn)
9.6.2. France
9.6.2.1. France Nitro Coffee Market Estimates and Forecast, 2016-2028 (US$ Bn)
9.6.2.2. France Nitro Coffee, By Flavors, 2016-2028 (US$ Bn)
9.6.2.3. France Nitro Coffee, By Packaging, 2016-2028 (US$ Bn)
9.6.2.4. France Nitro Coffee, By Distribution Channel, 2016-2028 (US$ Bn)
9.6.3. UK
9.6.3.1. UK Nitro Coffee Market Estimates and Forecast, 2016-2028 (US$ Bn)
9.6.3.2. UK Nitro Coffee, By Flavors, 2016-2028 (US$ Bn)
9.6.3.3. UK Nitro Coffee, By Packaging, 2016-2028 (US$ Bn)
9.6.3.4. UK Nitro Coffee, By Distribution Channel, 2016-2028 (US$ Bn)
9.6.4. Italy
9.6.4.1. Italy Nitro Coffee Market Estimates and Forecast, 2016-2028 (US$ Bn)
9.6.4.2. Italy Nitro Coffee, By Flavors, 2016-2028 (US$ Bn)
9.6.4.3. Italy Nitro Coffee, By Packaging, 2016-2028 (US$ Bn)
9.6.4.4. Italy Nitro Coffee, By Distribution Channel, 2016-2028 (US$ Bn)
9.6.5. Spain
9.6.5.1. Spain Nitro Coffee Market Estimates and Forecast, 2016-2028 (US$ Bn)
9.6.5.2. Spain Nitro Coffee, By Flavors, 2016-2028 (US$ Bn)
9.6.5.3. Spain Nitro Coffee, By Packaging, 2016-2028 (US$ Bn)
9.6.5.4. Spain Nitro Coffee, By Distribution Channel, 2016-2028 (US$ Bn)
9.6.6. Rest of Europe
9.6.6.1. Rest of Europe Nitro Coffee Market Estimates and Forecast, 2016-2028 (US$ Bn)
9.6.6.2. Rest of Europe Nitro Coffee, By Flavors, 2016-2028 (US$ Bn)
9.6.6.3. Rest of Europe Nitro Coffee, By Packaging, 2016-2028 (US$ Bn)
9.6.6.4. Rest of Europe Nitro Coffee, By Distribution Channel, 2016-2028 (US$ Bn)

10. Asia Pacific Nitro Coffee Market Analysis
10.1. Asia Pacific Nitro Coffee Market, By Flavors, 2016-2028(US$ Bn)
10.1.1. Overview
10.1.2. SRC Analysis
10.2. Asia Pacific Nitro Coffee Market, By Packaging, 2016-2028(US$ Bn)
10.2.1. Overview
10.2.2. SRC Analysis
10.3. Asia Pacific Nitro Coffee Market, By Distribution Channel, 2016-2028(US$ Bn)
10.3.1. Overview
10.3.2. SRC Analysis
10.4. Asia Pacific Nitro Coffee Market, by Country, 2016-2028 (US$ Bn)
10.4.1. China
10.4.1.1. China Nitro Coffee Market Estimates and Forecast, 2016-2028 (US$ Bn)
10.4.1.2. China Nitro Coffee, By Flavors, 2016-2028 (US$ Bn)
10.4.1.3. China Nitro Coffee, By Packaging, 2016-2028 (US$ Bn)
10.4.1.4. China Nitro Coffee, By Distribution Channel, 2016-2028 (US$ Bn)
10.4.2. Japan
10.4.2.1. Japan Nitro Coffee Market Estimates and Forecast, 2016-2028 (US$ Bn)
10.4.2.2. Japan Nitro Coffee, By Flavors, 2016-2028 (US$ Bn)
10.4.2.3. Japan Nitro Coffee, By Packaging, 2016-2028 (US$ Bn)
10.4.2.4. Japan Nitro Coffee, By Distribution Channel, 2016-2028 (US$ Bn)
10.4.3. India
10.4.3.1. India Nitro Coffee Market Estimates and Forecast, 2016-2028 (US$ Bn)
10.4.3.2. India Nitro Coffee, By Flavors, 2016-2028 (US$ Bn)
10.4.3.3. India Nitro Coffee, By Packaging, 2016-2028 (US$ Bn)
10.4.3.4. India Nitro Coffee, By Distribution Channel, 2016-2028 (US$ Bn)
10.4.4. South Korea
10.4.4.1. South Korea Nitro Coffee Market Estimates and Forecast, 2016-2028 (US$ Bn)
10.4.4.2. South Korea Nitro Coffee, By Flavors, 2016-2028 (US$ Bn)
10.4.4.3. South Korea Nitro Coffee, By Packaging, 2016-2028 (US$ Bn)
10.4.4.4. South Korea Nitro Coffee, By Distribution Channel, 2016-2028 (US$ Bn)
10.4.5. South-East Asia
10.4.5.1. South-East Asia Nitro Coffee Market Estimates and Forecast, 2016-2028 (US$ Bn)
10.4.5.2. South-East Asia Nitro Coffee, By Flavors, 2016-2028 (US$ Bn)
10.4.5.3. South-East Asia Nitro Coffee, By Packaging, 2016-2028 (US$ Bn)
10.4.5.4. South-East Asia Nitro Coffee, By Distribution Channel, 2016-2028 (US$ Bn)
10.4.6. Rest of Asia Pacific
10.4.6.1. Rest of Asia Pacific Nitro Coffee Market Estimates and Forecast, 2016-2028 (US$ Bn)
10.4.6.2. Rest of Asia Pacific Nitro Coffee, By Flavors, 2016-2028 (US$ Bn)
10.4.6.3. Rest of Asia Pacific Nitro Coffee, By Packaging, 2016-2028 (US$ Bn)
10.4.6.4. Rest of Asia Pacific Nitro Coffee, By Distribution Channel, 2016-2028 (US$ Bn)

11. Latin America Nitro Coffee Market Analysis
11.1. Latin America Nitro Coffee Market, By Flavors, 2016-2028(US$ Bn)
11.1.1. Overview
11.1.2. SRC Analysis
11.2. Latin America Nitro Coffee Market, By Packaging, 2016-2028(US$ Bn)
11.2.1. Overview
11.2.2. SRC Analysis
11.3. Latin America Nitro Coffee Market, By Distribution Channel, 2016-2028(US$ Bn)
11.3.1. Overview
11.3.2. SRC Analysis
11.4. Latin America Nitro Coffee Market, by Country, 2016-2028 (US$ Bn)
11.4.1. Brazil
11.4.1.1. Brazil Nitro Coffee Market Estimates and Forecast, 2016-2028 (US$ Bn)
11.4.1.2. Brazil Nitro Coffee, By Flavors, 2016-2028 (US$ Bn)
11.4.1.3. Brazil Nitro Coffee, By Packaging, 2016-2028 (US$ Bn)
11.4.1.4. Brazil Nitro Coffee, By Distribution Channel, 2016-2028 (US$ Bn)
11.4.2. Mexico
11.4.2.1. Mexico Nitro Coffee Market Estimates and Forecast, 2016-2028 (US$ Bn)
11.4.2.2. Mexico Nitro Coffee, By Flavors, 2016-2028 (US$ Bn)
11.4.2.3. Mexico Nitro Coffee, By Packaging, 2016-2028 (US$ Bn)
11.4.2.4. Mexico Nitro Coffee, By Distribution Channel, 2016-2028 (US$ Bn)
11.4.3. Rest of Latin America
11.4.3.1. Rest of Latin America Nitro Coffee Market Estimates and Forecast, 2016-2028 (US$ Bn)
11.4.3.2. Rest of Latin America Nitro Coffee, By Flavors, 2016-2028 (US$ Bn)
11.4.3.3. Rest of Latin America Nitro Coffee, By Packaging, 2016-2028 (US$ Bn)
11.4.3.4. Rest of Latin America Nitro Coffee, By Distribution Channel, 2016-2028 (US$ Bn)

12. Middle East and Africa Nitro Coffee Market Analysis
12.1. Middle East and Africa Nitro Coffee Market, By Flavors, 2016-2028(US$ Bn)
12.1.1. Overview
12.1.2. SRC Analysis
12.2. Middle East and Africa Nitro Coffee Market, By Packaging, 2016-2028(US$ Bn)
12.2.1. Overview
12.2.2. SRC Analysis
12.3. Middle East and Africa Nitro Coffee Market, By Distribution Channel, 2016-2028(US$ Bn)
12.3.1. Overview
12.3.2. SRC Analysis
12.4. Middle East and Africa Nitro Coffee Market, by Country, 2016-2028 (US$ Bn)
12.4.1. GCC Countries
12.4.1.1. GCC Countries il Nitro Coffee Market Estimates and Forecast, 2016-2028 (US$ Bn)
12.4.1.2. GCC Countries Nitro Coffee, By Flavors, 2016-2028 (US$ Bn)
12.4.1.3. GCC Countries Nitro Coffee, By Packaging, 2016-2028 (US$ Bn)
12.4.1.4. GCC Countries Nitro Coffee, By Distribution Channel, 2016-2028 (US$ Bn)
12.4.2. South Africa
12.4.2.1. South Africa Nitro Coffee Market Estimates and Forecast, 2016-2028 (US$ Bn)
12.4.2.2. South Africa Nitro Coffee, By Flavors, 2016-2028 (US$ Bn)
12.4.2.3. South Africa Nitro Coffee, By Packaging, 2016-2028 (US$ Bn)
12.4.2.4. South Africa Nitro Coffee, By Distribution Channel, 2016-2028 (US$ Bn)
12.4.3. Rest of Middle East and Africa
12.4.3.1. Rest of Middle East and Africa Nitro Coffee Market Estimates and Forecast, 2016-2028 (US$ Bn)
12.4.3.2. Rest of Middle East and Africa Nitro Coffee, By Flavors, 2016-2028 (US$ Bn)
12.4.3.3. Rest of Middle East and Africa Nitro Coffee, By Packaging, 2016-2028 (US$ Bn)
12.4.3.4. Rest of Middle East and Africa Nitro Coffee, By Distribution Channel, 2016-2028 (US$ Bn)

13. Company Profiles
13.1. Stumptown Coffee Roasters
13.1.1. Company Overview
13.1.2. Products/Services Portfolio
13.1.3. Geographical Presence
13.1.4. Financial Summary
13.1.4.1. Market Revenue and Net Profit (2019-2021)
13.1.4.2. Business Segment Revenue Analysis
13.1.4.3. Geographical Revenue Analysis
13.2. Rise Brewing Co.
13.3. Coffee Company
13.4. Starbucks Corporation
13.5. Lucky Jack
13.6. Califia Farms
13.7. Caveman Coffee Co.
13.8. Convergent Coffee Co.
13.9. Blackeye Roasting Co.
13.10. Others

List of Figures

FIG. 1 Global Nitro Coffee Market: Research Methodology
FIG. 2 Market Size Estimation – Top Down & Bottom up Approach
FIG. 3 Global Nitro Coffee Market Segmentation
FIG. 4 Global Nitro Coffee Market, By Flavors, 2021 (US$ Bn)
FIG. 5 Global Nitro Coffee Market, By Packaging, 2021 (US$ Bn)
FIG. 6 Global Nitro Coffee Market, By Distribution Channel Type, 2021 (US$ Bn)
FIG. 7 Global Nitro Coffee Market, by Geography, 2021 (US$ Bn)
FIG. 8 Attractive Investment Proposition, By Flavors, 2021
FIG. 9 Attractive Investment Proposition, By Packaging, 2021
FIG. 10 Attractive Investment Proposition, By Distribution Channel Type, 2021
FIG. 11 Attractive Investment Proposition, by Geography, 2021
FIG. 12 Global Market Share Analysis of Key Nitro Coffee Market Manufacturers, 2021
FIG. 13 Global Market Positioning of Key Nitro Coffee Market Manufacturers, 2021
FIG. 14 Global Nitro Coffee Market Value Contribution, By Flavors, 2021 & 2028 (Value %)
FIG. 15 Global Nitro Coffee Market, by Oat Milk Nitrogenated Coffee, Value, 2016-2028 (US$ Bn)
FIG. 16 Global Nitro Coffee Market, by Classic Latte Nitrogenated Coffee, Value, 2016-2028 (US$ Bn)
FIG. 17 Global Nitro Coffee Market, By Mocha Latte Nitrogenated Coffee, Value, 2016-2028 (US$ Bn)
FIG. 18 Global Nitro Coffee Market, By Coconut Nitrogenated Coffee, 2016-2028 (US$ Bn)
FIG. 19 Global Nitro Coffee Market, By Vanilla Nitrogenated Coffee, 2016-2028 (US$ Bn)
FIG. 20 Global Nitro Coffee Market, By Other Nitrogenated Coffee Flavors, 2016-2028 (US$ Bn)
FIG. 21 Global Nitro Coffee Market Value Contribution, By Packaging, 2021 & 2028 (Value %)
FIG. 22 Global Nitro Coffee Market, by Cans, Value, 2016-2028 (US$ Bn)
FIG. 23 Global Nitro Coffee Market, by Glass Bottles, Value, 2016-2028 (US$ Bn)
FIG. 24 Global Nitro Coffee Market Value Contribution, By Distribution Channel, 2021 & 2028 (Value %)
FIG. 25 Global Nitro Coffee Market, by Hypermarkets/Supermarkets, Value, 2016-2028 (US$ Bn)
FIG. 26 Global Nitro Coffee Market, by Convenience Stores, Value, 2016-2028 (US$ Bn)
FIG. 27 Global Nitro Coffee Market, by Specialty Stores, Value, 2016-2028 (US$ Bn)
FIG. 28 Global Nitro Coffee Market, by Online Stores, Value, 2016-2028 (US$ Bn)
FIG. 29 U.S. Nitro Coffee Market, 2016-2028 (US$ Bn)
FIG. 30 Canada Nitro Coffee Market, 2016-2028 (US$ Bn)
FIG. 31 Germany Nitro Coffee Market, 2016-2028 (US$ Bn)
FIG. 32 France Nitro Coffee Market, 2016-2028 (US$ Bn)
FIG. 33 U.K. Nitro Coffee Market, 2016-2028 (US$ Bn)
FIG. 34 Italy Nitro Coffee Market, 2016-2028 (US$ Bn)
FIG. 35 Spain Nitro Coffee Market, 2016-2028 (US$ Bn)
FIG. 36 Rest of Europe Nitro Coffee Market, 2016-2028 (US$ Bn)
FIG. 37 China Nitro Coffee Market, 2016-2028 (US$ Bn)
FIG. 38 Japan Nitro Coffee Market, 2016-2028 (US$ Bn)
FIG. 39 India Nitro Coffee Market, 2016-2028 (US$ Bn)
FIG. 40 South Korea Nitro Coffee Market, 2016-2028 (US$ Bn)
FIG. 41 Southeast Asia Nitro Coffee Market, 2016-2028 (US$ Bn)
FIG. 42 Rest of Asia Pacific Nitro Coffee Market, 2016-2028 (US$ Bn)
FIG. 43 Latin America Nitro Coffee Market, 2016-2028 (US$ Bn)
FIG. 44 Brazil Nitro Coffee Market, 2016-2028 (US$ Bn)
FIG. 45 Mexico Nitro Coffee Market, 2016-2028 (US$ Bn)
FIG. 46 Rest of Latin America Nitro Coffee Market, 2016-2028 (US$ Bn)
FIG. 47 Middle East & Africa Nitro Coffee Market, 2016-2028 (US$ Bn)
FIG. 48 GCC Countries Nitro Coffee Market, 2016-2028 (US$ Bn)
FIG. 49 South Africa Nitro Coffee Market, 2016-2028 (US$ Bn)
FIG. 50 Rest of Middle East and Africa Nitro Coffee Market, 2016-2028 (US$ Bn)

List of Tables

TABLE 1 Market Snapshot: Global Nitro Coffee Market
TABLE 2 Global Nitro Coffee Market, by Competitive Benchmarking, 2021
TABLE 3 Global Nitro Coffee Market, by Geographical Presence Analysis, 2021
TABLE 4 Global Nitro Coffee Market, by Key Strategies Analysis, 2021
TABLE 5 Global Nitro Coffee Market, By Flavors, 2016-2028 (US$ Bn)
TABLE 6 Global Nitro Coffee Market, By Packaging, 2016-2028 (US$ Bn)
TABLE 7 Global Nitro Coffee Market, By Distribution Channel, 2016-2028 (US$ Bn)
TABLE 8 Global Nitro Coffee Market, by Geography, 2016-2028 (US$ Bn)
TABLE 9 North America Nitro Coffee Market, By Flavors, 2016-2028 (US$ Bn)
TABLE 10 North America Nitro Coffee Market, By Packaging, 2016-2028 (US$ Bn)
TABLE 11 North America Nitro Coffee Market, By Distribution Channel, 2016-2028 (US$ Bn)
TABLE 12 North America Nitro Coffee Market, by Country, 2016-2028 (US$ Bn)
TABLE 13 US Nitro Coffee Market, By Flavors, 2016-2028 (US$ Bn)
TABLE 14 US Nitro Coffee Market, By Packaging, 2016-2028 (US$ Bn)
TABLE 15 US Nitro Coffee Market, By Distribution Channel, 2016-2028 (US$ Bn)
TABLE 16 Canada Nitro Coffee Market, By Flavors, 2016-2028 (US$ Bn)
TABLE 17 Canada Nitro Coffee Market, By Packaging, 2016-2028 (US$ Bn)
TABLE 18 Canada Nitro Coffee Market, By Distribution Channel, 2016-2028 (US$ Bn)
TABLE 19 Europe Nitro Coffee Market, By Flavors, 2016-2028 (US$ Bn)
TABLE 20 Europe Nitro Coffee Market, By Packaging, 2016-2028 (US$ Bn)
TABLE 21 Europe Nitro Coffee Market, By Distribution Channel, 2016-2028 (US$ Bn)
TABLE 22 Europe Nitro Coffee Market, by Country, 2016-2028 (US$ Bn)
TABLE 23 Germany Nitro Coffee Market, By Flavors, 2016-2028 (US$ Bn)
TABLE 24 Germany Nitro Coffee Market, By Packaging, 2016-2028 (US$ Bn)
TABLE 25 Germany Nitro Coffee Market, By Distribution Channel, 2016-2028 (US$ Bn)
TABLE 26 France Nitro Coffee Market, By Flavors, 2016-2028 (US$ Bn)
TABLE 27 France Nitro Coffee Market, By Packaging, 2016-2028 (US$ Bn)
TABLE 28 France Nitro Coffee Market, By Distribution Channel, 2016-2028 (US$ Bn)
TABLE 29 UK Nitro Coffee Market, By Flavors, 2016-2028 (US$ Bn)
TABLE 30 UK Nitro Coffee Market, By Packaging, 2016-2028 (US$ Bn)
TABLE 31 UK Nitro Coffee Market, By Distribution Channel, 2016-2028 (US$ Bn)
TABLE 32 Italy Nitro Coffee Market, By Flavors, 2016-2028 (US$ Bn)
TABLE 33 Italy Nitro Coffee Market, By Packaging, 2016-2028 (US$ Bn)
TABLE 34 Italy Nitro Coffee Market, By Distribution Channel, 2016-2028 (US$ Bn)
TABLE 35 Spain Nitro Coffee Market, By Flavors, 2016-2028 (US$ Bn)
TABLE 36 Spain Nitro Coffee Market, By Packaging, 2016-2028 (US$ Bn)
TABLE 37 Spain Nitro Coffee Market, By Distribution Channel, 2016-2028 (US$ Bn)
TABLE 38 Rest of Europe Nitro Coffee Market, By Flavors, 2016-2028 (US$ Bn)
TABLE 39 Rest of Europe Nitro Coffee Market, By Packaging, 2016-2028 (US$ Bn)
TABLE 40 Rest of Europe Nitro Coffee Market, By Distribution Channel, 2016-2028 (US$ Bn)
TABLE 41 Asia Pacific Nitro Coffee Market, By Flavors, 2016-2028 (US$ Bn)
TABLE 42 Asia Pacific Nitro Coffee Market, By Packaging, 2016-2028 (US$ Bn)
TABLE 43 Asia Pacific Nitro Coffee Market, By Distribution Channel, 2016-2028 (US$ Bn)
TABLE 44 Asia Pacific Nitro Coffee Market, by Country, 2016-2028 (US$ Bn)
TABLE 45 China Nitro Coffee Market, By Flavors, 2016-2028 (US$ Bn)
TABLE 46 China Nitro Coffee Market, By Packaging, 2016-2028 (US$ Bn)
TABLE 47 China Nitro Coffee Market, By Distribution Channel, 2016-2028 (US$ Bn)
TABLE 48 Japan Nitro Coffee Market, By Flavors, 2016-2028 (US$ Bn)
TABLE 49 Japan Nitro Coffee Market, By Packaging, 2016-2028 (US$ Bn)
TABLE 50 Japan Nitro Coffee Market, By Distribution Channel, 2016-2028 (US$ Bn)
TABLE 51 India Nitro Coffee Market, By Flavors, 2016-2028 (US$ Bn)
TABLE 52 India Nitro Coffee Market, By Packaging, 2016-2028 (US$ Bn)
TABLE 53 India Nitro Coffee Market, By Distribution Channel, 2016-2028 (US$ Bn)
TABLE 54 South Korea Nitro Coffee Market, By Flavors, 2016-2028 (US$ Bn)
TABLE 55 South Korea Nitro Coffee Market, By Packaging, 2016-2028 (US$ Bn)
TABLE 56 South Korea Nitro Coffee Market, By Distribution Channel, 2016-2028 (US$ Bn)
TABLE 57 South-East Asia Nitro Coffee Market, By Flavors, 2016-2028 (US$ Bn)
TABLE 58 South-East Asia Nitro Coffee Market, By Packaging, 2016-2028 (US$ Bn)
TABLE 59 South-East Asia Nitro Coffee Market, By Distribution Channel, 2016-2028 (US$ Bn)
TABLE 60 Rest of Asia Pacific Nitro Coffee Market, By Flavors, 2016-2028 (US$ Bn)
TABLE 61 Rest of Asia Pacific Nitro Coffee Market, By Packaging, 2016-2028 (US$ Bn)
TABLE 62 Rest of Asia Pacific Nitro Coffee Market, By Distribution Channel, 2016-2028 (US$ Bn)
TABLE 63 Latin America Nitro Coffee Market, By Flavors, 2016-2028 (US$ Bn)
TABLE 64 Latin America Nitro Coffee Market, By Packaging, 2016-2028 (US$ Bn)
TABLE 65 Latin America Nitro Coffee Market, By Distribution Channel, 2016-2028 (US$ Bn)
TABLE 66 Latin America Nitro Coffee Market, by Country, 2016-2028 (US$ Bn)
TABLE 67 Brazil Nitro Coffee Market, By Flavors, 2016-2028 (US$ Bn)
TABLE 68 Brazil Nitro Coffee Market, By Packaging, 2016-2028 (US$ Bn)
TABLE 69 Brazil Nitro Coffee Market, By Distribution Channel, 2016-2028 (US$ Bn)
TABLE 70 Mexico Nitro Coffee Market, By Flavors, 2016-2028 (US$ Bn)
TABLE 71 Mexico Nitro Coffee Market, By Packaging, 2016-2028 (US$ Bn)
TABLE 72 Mexico Nitro Coffee Market, By Distribution Channel, 2016-2028 (US$ Bn)
TABLE 73 Rest of Latin America Nitro Coffee Market, By Flavors, 2016-2028 (US$ Bn)
TABLE 74 Rest of Latin America Nitro Coffee Market, By Packaging, 2016-2028 (US$ Bn)
TABLE 75 Rest of Latin America Nitro Coffee Market, By Distribution Channel, 2016-2028 (US$ Bn)
TABLE 76 Middle East and Africa Nitro Coffee Market, By Flavors, 2016-2028 (US$ Bn)
TABLE 77 Middle East and Africa Nitro Coffee Market, By Packaging, 2016-2028 (US$ Bn)
TABLE 78 Middle East and Africa Nitro Coffee Market, By Distribution Channel, 2016-2028 (US$ Bn)
TABLE 79 Middle East and Africa Nitro Coffee Market, by Country, 2016-2028 (US$ Bn)
TABLE 80 GCC Countries Nitro Coffee Market, By Flavors, 2016-2028 (US$ Bn)
TABLE 81 GCC Countries Nitro Coffee Market, By Packaging, 2016-2028 (US$ Bn)
TABLE 82 GCC Countries Nitro Coffee Market, By Distribution Channel, 2016-2028 (US$ Bn)
TABLE 83 South Africa Nitro Coffee Market, By Flavors, 2016-2028 (US$ Bn)
TABLE 84 South Africa Nitro Coffee Market, By Packaging, 2016-2028 (US$ Bn)
TABLE 85 South Africa Nitro Coffee Market, By Distribution Channel, 2016-2028 (US$ Bn)
TABLE 86 Rest of Middle East and Africa Nitro Coffee Market, By Flavors, 2016-2028 (US$ Bn)
TABLE 87 Rest of Middle East and Africa Nitro Coffee Market, By Packaging, 2016-2028 (US$ Bn)
TABLE 88 Rest of Middle East and Africa Nitro Coffee Market, By Distribution Channel, 2016-2028 (US$ Bn)

Frequently Asked Questions

How does COVID-19 Impact the global nitro coffee market?

Nitro Coffee Market was negatively impacted due to the temporary suspension of cafés and restaurants.

Which is the leading market for nitro coffee?

North America accounted for the highest share in the global nitro coffee market.

What are the key drivers for the growth of the nitro coffee market?

Increasing demand for cold drinks and beverages and increasing demand for cafes are the major factors driving the market’s growth.

Which is the major segment in the nitro coffee market by flavor?

The vanilla segment had a major share 2021 of the market revenue.

Which is the major segment in the nitro coffee market by Packaging?

The can segment had a major share in the global market in 2021 and is projected to continue its dominance over the forecast period.

Food & Beverage Vending Machines Market

Published:
Report ID: 5489

Functional Food Ingredients Market

Published:
Report ID: 5704

Food And Beverages Nano-Enabled Packaging Market

Published:
Report ID: 5488

Almond Oil Market

Published:
Report ID: 36611

Edible Gold Market

Published:
Report ID: 36608

Artificial Sweetener Market

Published:
Report ID: 36605

Individual Quick Freezing (IQF) Fruits Market

Published:
Report ID: 6585

Specialty Yeast Market

Published:
Report ID: 36557

Prebiotic Ingredients Market

Published:
Report ID: 36544

Chia Seeds Market

Published:
Report ID: 3952

Cereal Bars Market

Published:
Report ID: 3837

Food Encapsulation Market

Published:
Report ID: 5663

Purchase Options

$2999
Delivery Format: Excel.
$4999
Designed for the individual purchaser.
$6999
Users located at a single corporate site or regional office.
$7999
Allowed for unlimited sharing globally within one company.
Smallform of Sample request

Have a question?

User Profile

Don’t settle for less – trust Mitul to help you find the best solution.

Report delivery within 24 to 48 hours

– Other Info –

What people say?-

User Review

I am very impressed with the information in this report. The author clearly did their research when they came up with this product and it has already given me a lot of ideas.

Jana Schmidt
CEDAR CX Technologies

– Connect with us –

Phone

+91 6232 49 3207


support

24/7 Research Support


sales@credenceresearch.com

– Research Methodology –

Going beyond the basics: advanced techniques in research methodology

– Trusted By –

Pepshi, LG, Nestle
Motorola, Honeywell, Johnson and johnson
LG Chem, SIEMENS, Pfizer
Unilever, Samsonite, QIAGEN