Plants move fog compute beside the machine
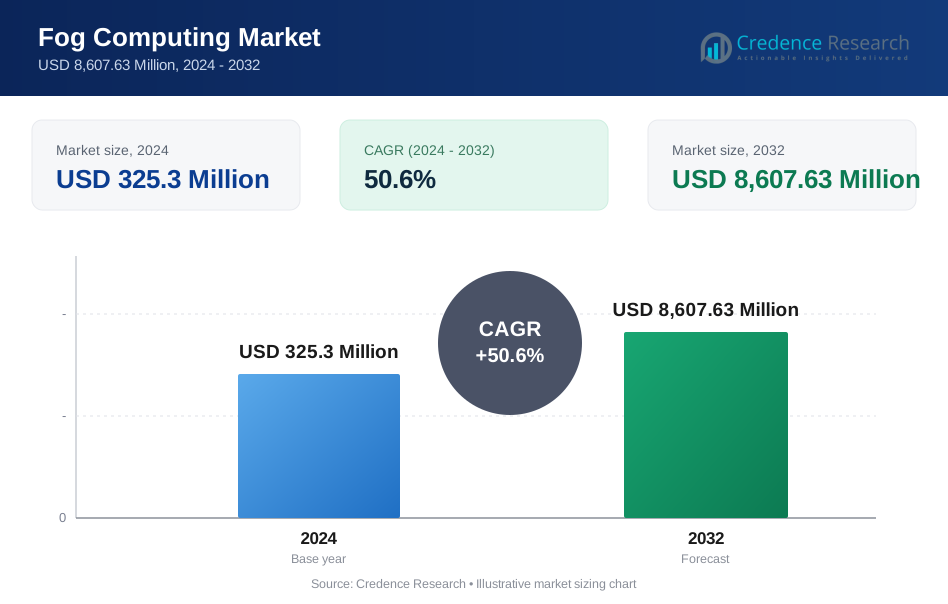
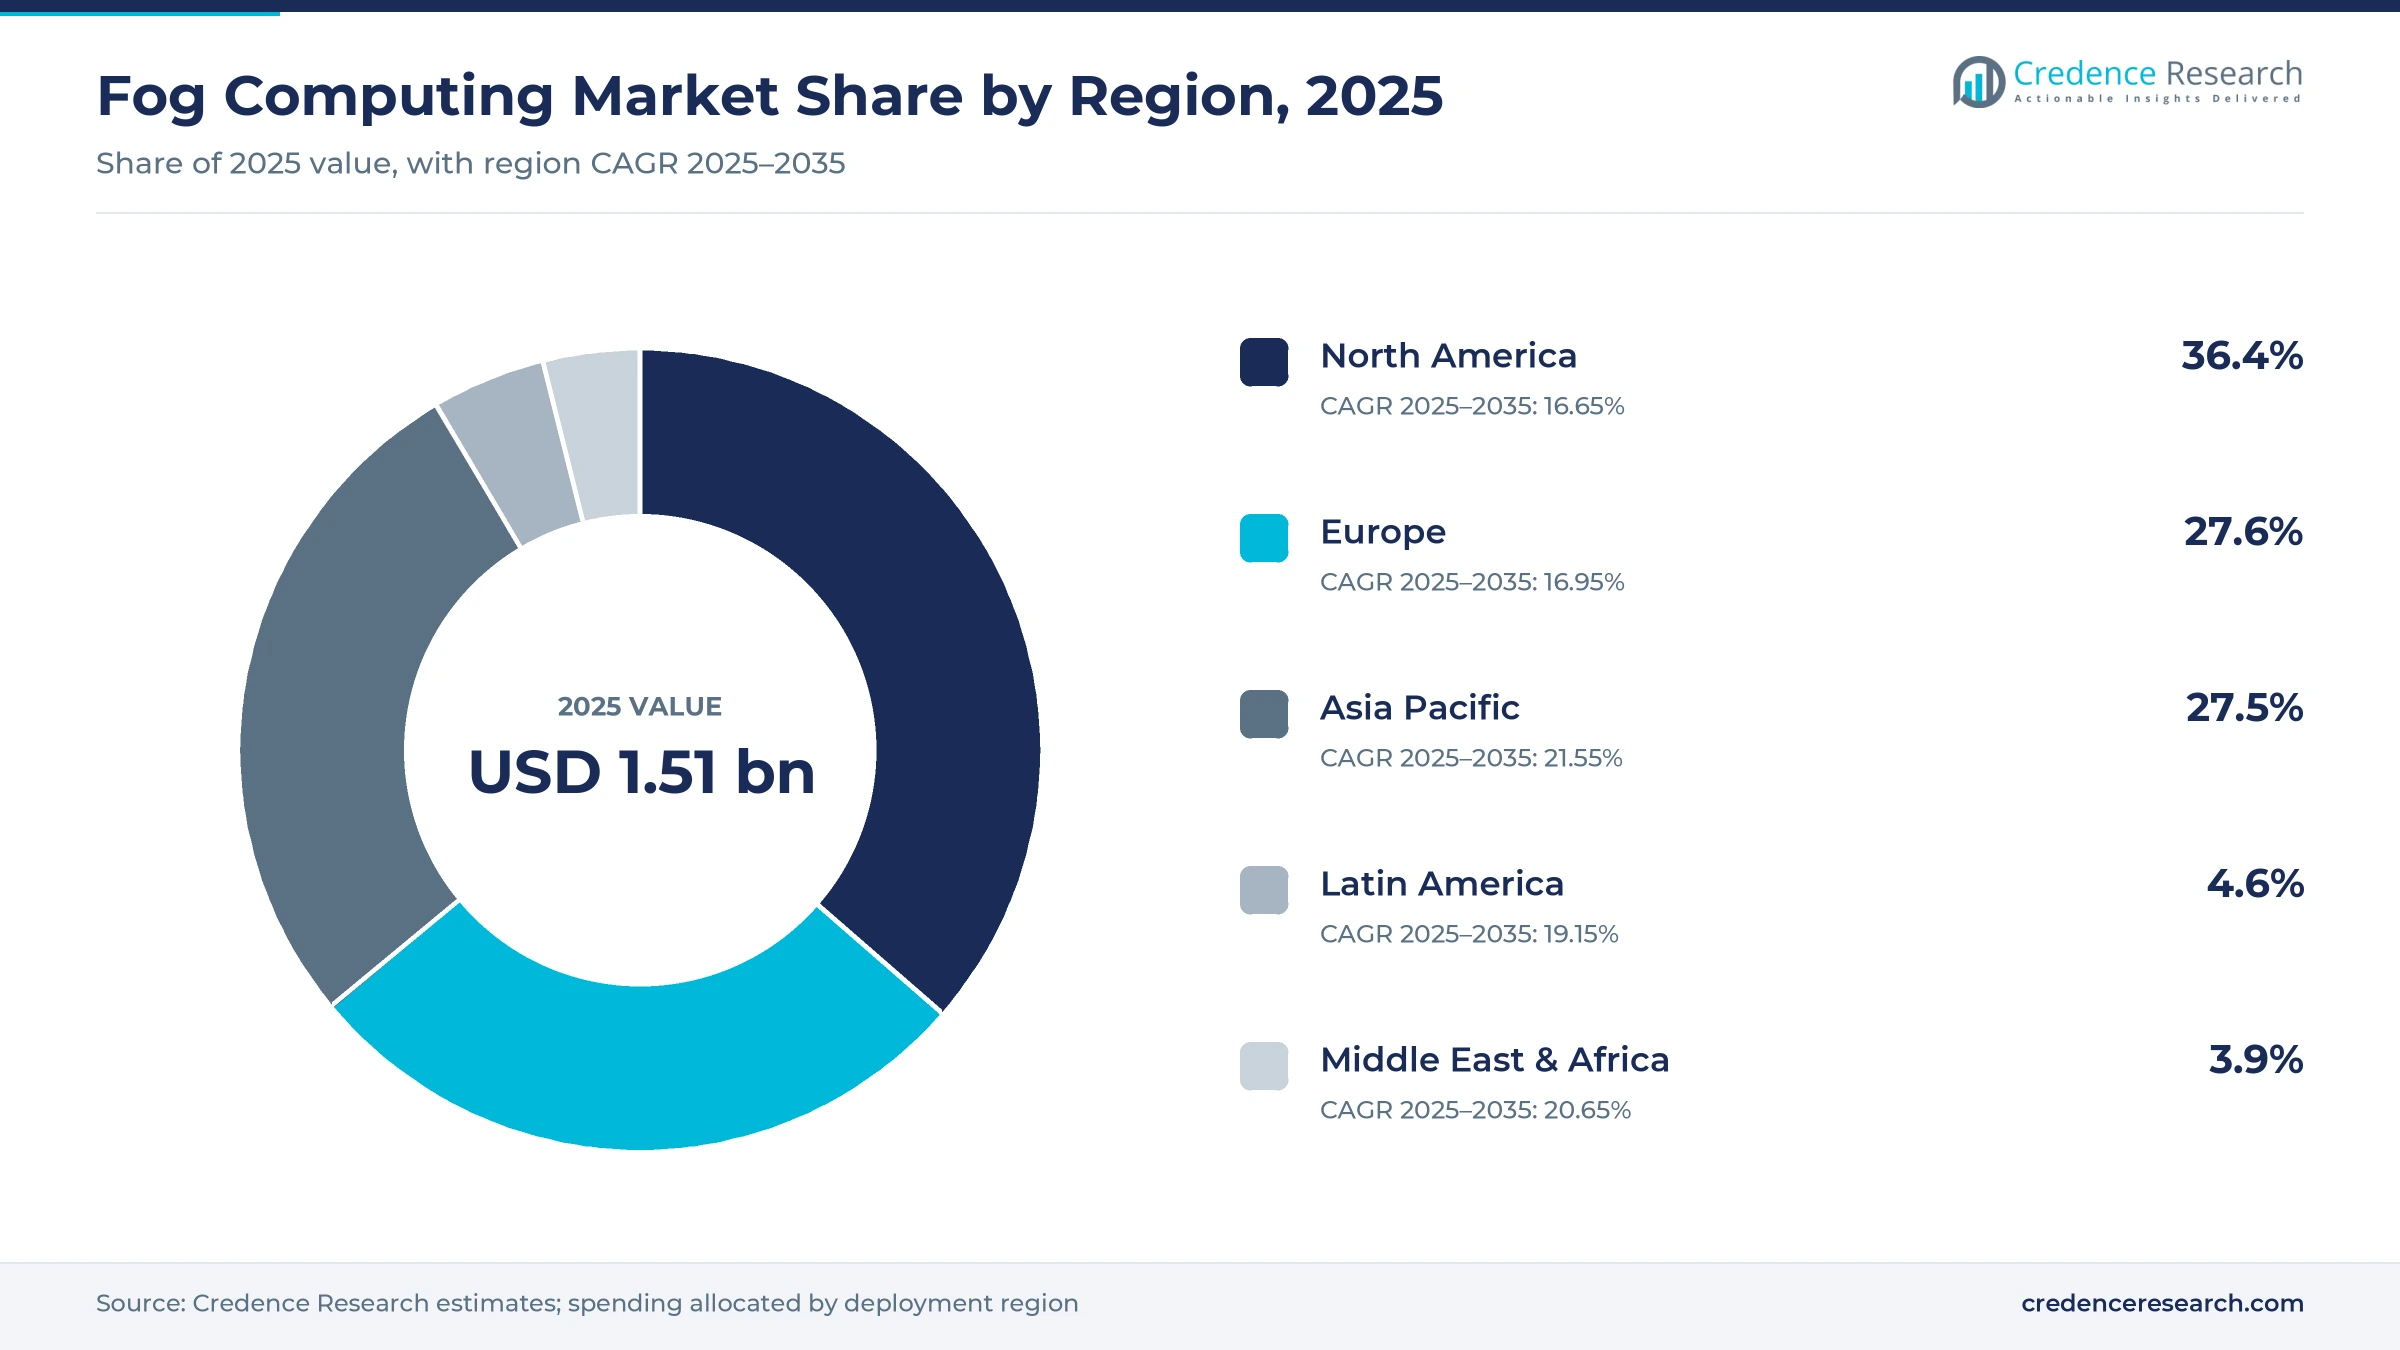
The fog computing market was valued at USD 1.51 billion in 2025. Revenue is estimated at USD 1.79 billion in 2026 and is projected to reach USD 8.27 billion by 2035, an 18.54% CAGR over 2025–2035. Demand comes from AI inference beside production lines, software-defined automation that moves control logic into containers and virtual PLCs, data-residency and operational technology security rules, and private 5G networks that put more sensors and robots on the shop floor. North America held the largest regional share, 36.4% in 2025, backed by the deepest pool of cloud, server and networking suppliers, while Asia Pacific is the fastest-growing region at 21.55% a year. The main technology change is the shift from single gateways to orchestrated, interoperable node fleets, marked by the Margo initiative's first preview specification for cross-vendor edge applications in January 2026.
Fog spending more than quintuples by 2035
The market adds USD 0.28 billion from 2025 to 2026 and USD 6.76 billion over 2025–2035, compounding across ten years.
Where does the fog layer start and stop?
Fog computing is the compute that sits one or two hops from the machine. The NIST Fog Computing Conceptual Model, published in March 2018 as SP 500-325, describes a layered model of physical or virtual fog nodes between smart end devices and centralized cloud services, with characteristics that include low latency, geographic distribution and federation of node clusters. IEEE 1934, which grew out of the OpenFog reference architecture, sets out the same layered picture. Buyers are plant owners, logistics operators, hospitals and large building operators.
The estimate counts industrial edge gateways, rugged edge PCs and compact edge servers that run fog workloads, node runtimes and orchestration software, and integration and managed services. It excludes wider edge computing, including content delivery and public-cloud edge zones, telecom operator multi-access edge platforms, edge and micro data center buildings, and the sensors and controllers that NIST calls mist computing.
Fog Computing Market Insights
- The fog computing market is projected to rise from USD 1.79 billion in 2026 to USD 8.27 billion by 2035, an 18.54% CAGR, as plants move AI inference and control onto local nodes.
- North America held 36.4% of 2025 value, the largest regional share, while Asia Pacific grows fastest at 21.55% a year as new factories add private 5G.
- Hardware accounted for 48.1% of 2025 value because every deployment starts with a rugged node, while software grows fastest at 22.81% a year through 2035.
- The Margo initiative's Preview Release 1 in January 2026 marks a shift from closed vendor stacks toward interoperable fog fleets that plants can manage from one console.
- Cisco's Unified Edge launch in November 2025 and Siemens' Industrial AI Suite in April 2026 show suppliers competing on integrated appliances and orchestration software.
Rugged nodes lead as orchestration software grows fastest
Hardware leads the component mix while software grows fastest
Based on component, the market is categorized into hardware, software and services. Hardware led with 48.1% of 2025 value, because every fog deployment starts with a physical node rated for heat, dust and vibration, from industrial gateways and fanless edge PCs to compact servers with AI accelerators. Software grows fastest at 22.81% a year, as orchestration, container runtimes and per-node application subscriptions recur across an expanding installed fleet, which rewards suppliers with fleet management platforms.
Smart manufacturing leads by application while connected health grows fastest
Based on application, the market is categorized into smart manufacturing, transportation and logistics, building and home automation, connected health and other applications. Smart manufacturing led with 40.6% of 2025 value, as discrete and process plants use fog nodes for quality inspection, virtual control, energy monitoring and machine connectivity. Connected health grows fastest at 21.43% a year, because hospitals combine strict data-residency rules with imaging, patient monitoring and building systems that benefit from local processing.
| Segment Group | Leading Sub-segment | Share, 2025 | Fastest-growing Sub-segment | CAGR, 2025–2035 |
|---|---|---|---|---|
| By Component | Hardware | 48.1% | Software | 22.81% |
| By Application | Smart Manufacturing | 40.6% | Connected Health | 21.43% |
Request a Free Sample
Fill in your details and we'll send you a free sample report.
- Sample data tables & charts
- Research methodology
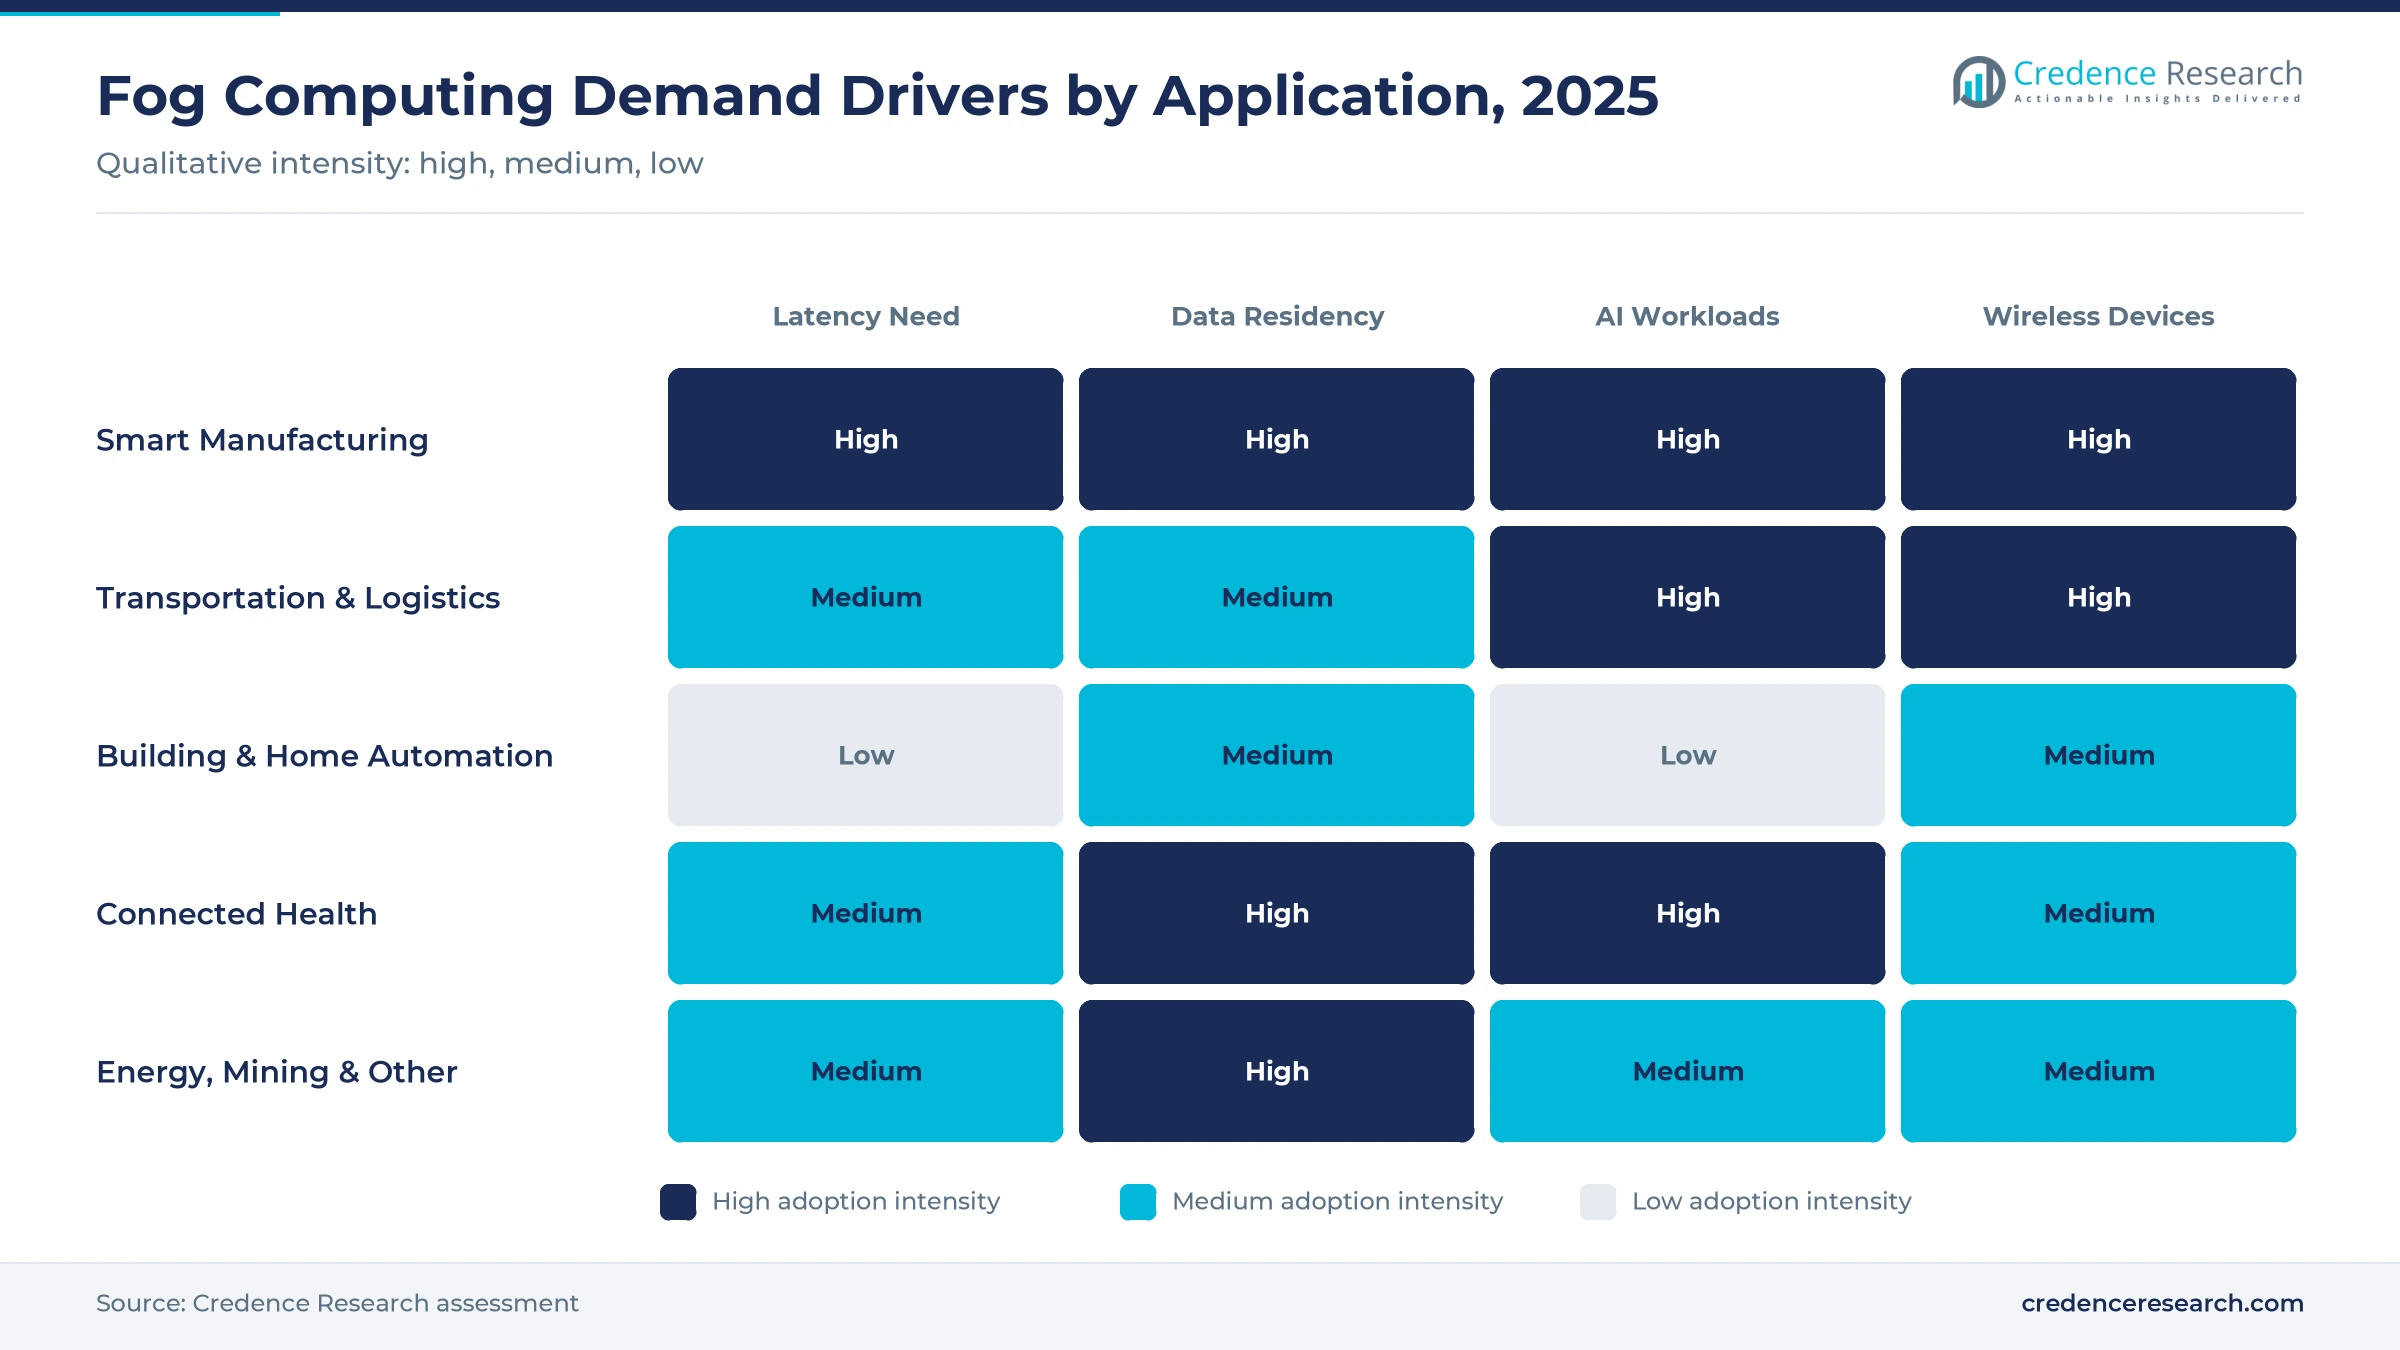
Shop-floor AI and virtual control drive fog demand
AI inspection and Copilots need models running beside the line
Vision-based quality inspection, predictive maintenance and operator copilots all need a model running beside the line, which makes AI inference the strongest single driver of fog spending. Siemens unveiled its Industrial Copilot for Operations for the factory edge at CES in January 2025, and in April 2026 it made its Industrial AI Suite generally available for deploying and scaling models across locations and retraining them with production data. AI workloads lift the value of each node in plants across North America, Europe and Asia through 2035.
Virtual PLCs and containerized control move logic onto general-purpose nodes
Control logic that once lived in proprietary hardware is moving into containers and virtual PLCs that run on general-purpose fog nodes. Siemens offers WinCC Open Architecture as an Edge App and for its virtual S7-1500 controller, and Schneider Electric presented EcoStruxure Automation Expert as an open, software-defined platform at Hannover Messe in March 2025. Each virtualized controller needs a hardened node, a runtime and an orchestration layer, which makes software the fastest-growing component over the decade.
Data-residency and OT security rules keep process data on site
Plant owners in chemicals, pharmaceuticals and energy want raw process data to stay on site, and operational technology security standards such as IEC 62443 push them to segment networks and patch centrally. A managed fog node delivers both local data and central control. Siemens has targeted IEC 62443-4-2 certified security functions, including air-gapped operation, for the second half of 2026, and hospitals apply similar residency rules to imaging and monitoring data, supporting medium-term demand in Europe and North America.
Private 5G and cloud tooling bring more devices and familiar software to the plant
Private 5G and Wi-Fi 6 put more wireless sensors, cameras and mobile robots on the shop floor, and each needs a nearby node to act on its data. Nokia added six partner applications to its MX Industrial Edge platform in March 2025 for ports, mines and factories. Microsoft announced general availability of Azure IoT Operations in November 2024, and AWS released second-generation Outposts racks in April 2025, while older equipment reaches these nodes through industrial multiprotocol gateways.
Orchestrated fleets and open specifications replace silos
Orchestration is emerging as the product
Early fog projects paired one gateway with one application, but buyers now want fleets of nodes updated from a single console. Dell's NativeEdge 2.0, released in February 2024, added blueprints that define an edge solution's settings, networking and workflows in one file, plus orchestration onto non-Dell infrastructure. Siemens' Industrial Edge Management 2.0, shown in April 2026, added support for OpenShift and Hyper-V. Software is therefore where suppliers now compete, and it is the fastest-growing component.
Rise of open interoperability specifications
Industrial users have long complained that each automation vendor's edge stack is a closed island. The Margo initiative, hosted by the Linux Foundation, published Preview Release 1 of its specification for industrial edge application lifecycle management in January 2026, with a sandbox, and plans a first general release in 2026. ETSI released its first MEC Phase 4 specifications in October 2025, extending multi-access edge computing to the far edge, so plant nodes and nearby cell-site servers start to look like one resource pool.
Integrated Edge Appliances for hospitals, stores and plants open an opportunity
Suppliers increasingly sell compute, networking, storage and security as a single box. Cisco Unified Edge launched on Nov. 3, 2025, naming retail stores, healthcare facilities and factory floors as target sites. Connected health is the fastest-growing application at 21.43% a year, and hospitals with strict data-residency rules and limited IT staff are natural buyers. Suppliers that own both networking and compute can shorten deployments and win sites that never ran a fog project before.
Brownfield retrofits and managed fog services offer an opportunity
Most factories that will exist in 2035 already exist today, which makes brownfield retrofits the larger prize. Data-ops applications such as the Prosys OPC UA tool in Nokia's 2025 release collect data from many older assets through one access point, turning a retrofit into a software project. Many mid-sized manufacturers lack staff to run a node fleet, so managed services that handle patching and monitoring under a subscription open a large market for integrators and platform owners.
Fragmented stacks and IT-OT ownership gaps slow rollouts
Fragmented vendor stacks leave plants running two fog layers
Every large automation and cloud supplier has its own edge runtime, management console and application store, so a plant that buys controllers from two vendors can end up with two fog stacks. Plant engineers and integrators carry the cost of running both, and some projects stall at the pilot stage. Margo and ETSI MEC address the problem, but neither has a general release that plants can specify in tenders yet, so interoperability remains a barrier to 2026–2028 growth.
Unclear IT and OT ownership stalls projects
Fog nodes sit on the line between the plant network and the corporate network, and many firms still have no clear owner for them. Projects stall when the automation team and the IT team disagree on patching windows, remote access or who answers the call at night. The commercial consequence is longer sales cycles and smaller first orders for suppliers. Joint IT and OT governance and managed services that take over day-to-day operation are the most practical fixes.
Every node adds an attack surface in a hard-to-watch place
Each node is a new attack surface in a place that is hard to watch. IEC 62443 certification, secure boot and remote attestation add cost and engineering time, and the burden falls hardest on smaller plants, which often decide that a cloud-only design, or no project at all, is safer. As a result, the addressable base narrows among mid-sized firms. Suppliers respond with pre-certified hardware, centrally managed patching and security functions built into the platform.
A blurred fog-versus-edge label splits budgets
Buyers and suppliers often use fog and edge computing as synonyms, which makes budgets hard to track and pushes some spending into broader edge or micro data center line items. Suppliers struggle to show a return when spending is split across IT, OT and facilities budgets. Credence Research counts only nodes, software and services that fit the NIST definition, and suppliers that tie offers to measurable plant outcomes, such as scrap or downtime reduction, find budgets easier to secure.
North America leads as Asia Pacific adds nodes fastest
| Region | Share, 2025 | CAGR, 2025–2035 |
|---|---|---|
| North America | 36.4% | 16.65% |
| Europe | 27.6% | 16.95% |
| Asia Pacific | 27.5% | 21.55% |
| Latin America | 4.6% | 19.15% |
| Middle East & Africa | 3.9% | 20.65% |
North America has the deepest supplier pool and early appliance buyers
North America held 36.4% of 2025 value and grows at 16.65% a year. The United States has the deepest pool of cloud, server and networking suppliers, and its manufacturers, logistics firms and hospital networks were among the first to buy managed edge appliances and on-premises cloud racks. Azure IoT Operations and second-generation AWS Outposts racks give IT teams familiar tools for plant workloads, while Cisco's Unified Edge targets retail, healthcare and factory sites.
Europe relies on home-grown automation suppliers and on-site data habits
Europe held 27.6% of 2025 value and grows at 16.95% a year. Germany, Italy and the Nordics lead, helped by home-grown automation suppliers and strict data-protection habits that favor on-site processing. Hannover Messe has become the main launch venue for industrial edge products, including Schneider Electric's software-defined automation platform in 2025 and Siemens' Industrial Edge Management 2.0 in 2026. Nokia adds private wireless and edge platforms for ports and mines.
Asia Pacific adds nodes fastest in new electronics, battery and automotive plants
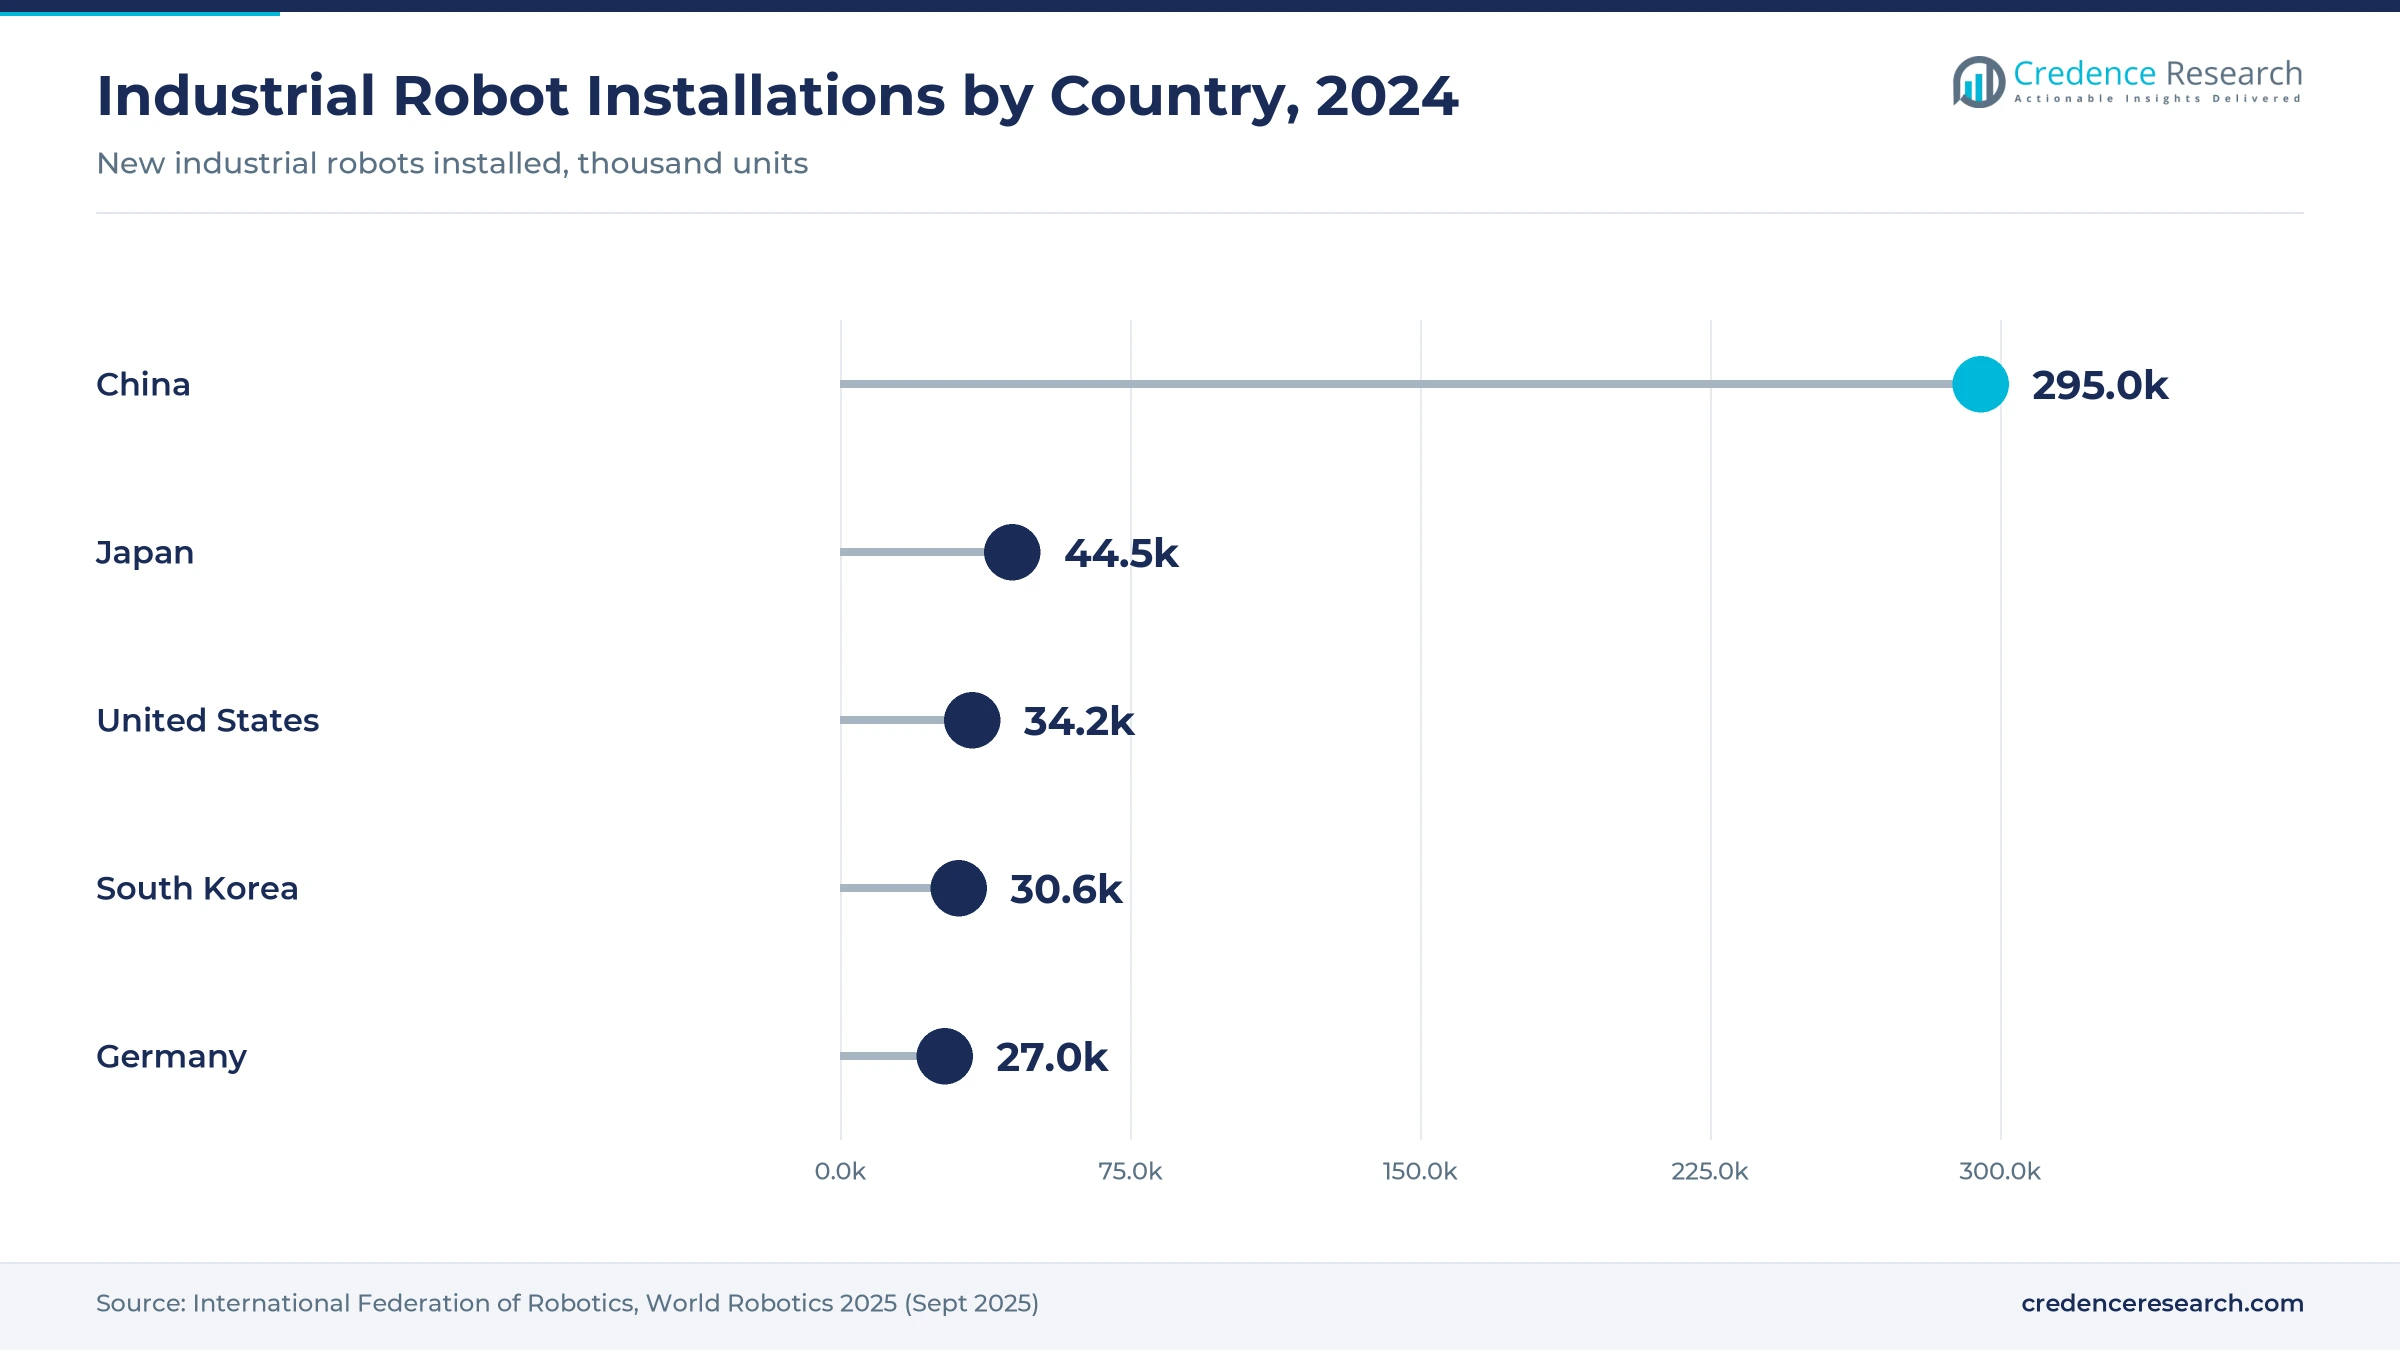
Asia Pacific held 27.5% of 2025 value and is the fastest-growing region at 21.55% a year. China, Japan, South Korea and Taiwan add new electronics, battery and automotive plants, and India's manufacturing base is widening. China installed 295,000 industrial robots in 2024, more than half the global total, according to the International Federation of Robotics. Private 5G networks in Chinese, Korean and Japanese factories create early demand for nodes beside the radio.
Latin America and Middle East & Africa build on mines, oil fields and new industrial zones
Latin America held 4.6% of 2025 value and grows at 19.15% a year, with mining in Chile and Peru and automotive and food plants in Mexico and Brazil as the main buyers. The Middle East & Africa held 3.9% and grows at 20.65% a year, as Gulf oil, gas and utility operators use fog nodes for remote asset monitoring and new industrial zones in Saudi Arabia and the United Arab Emirates add plant demand.
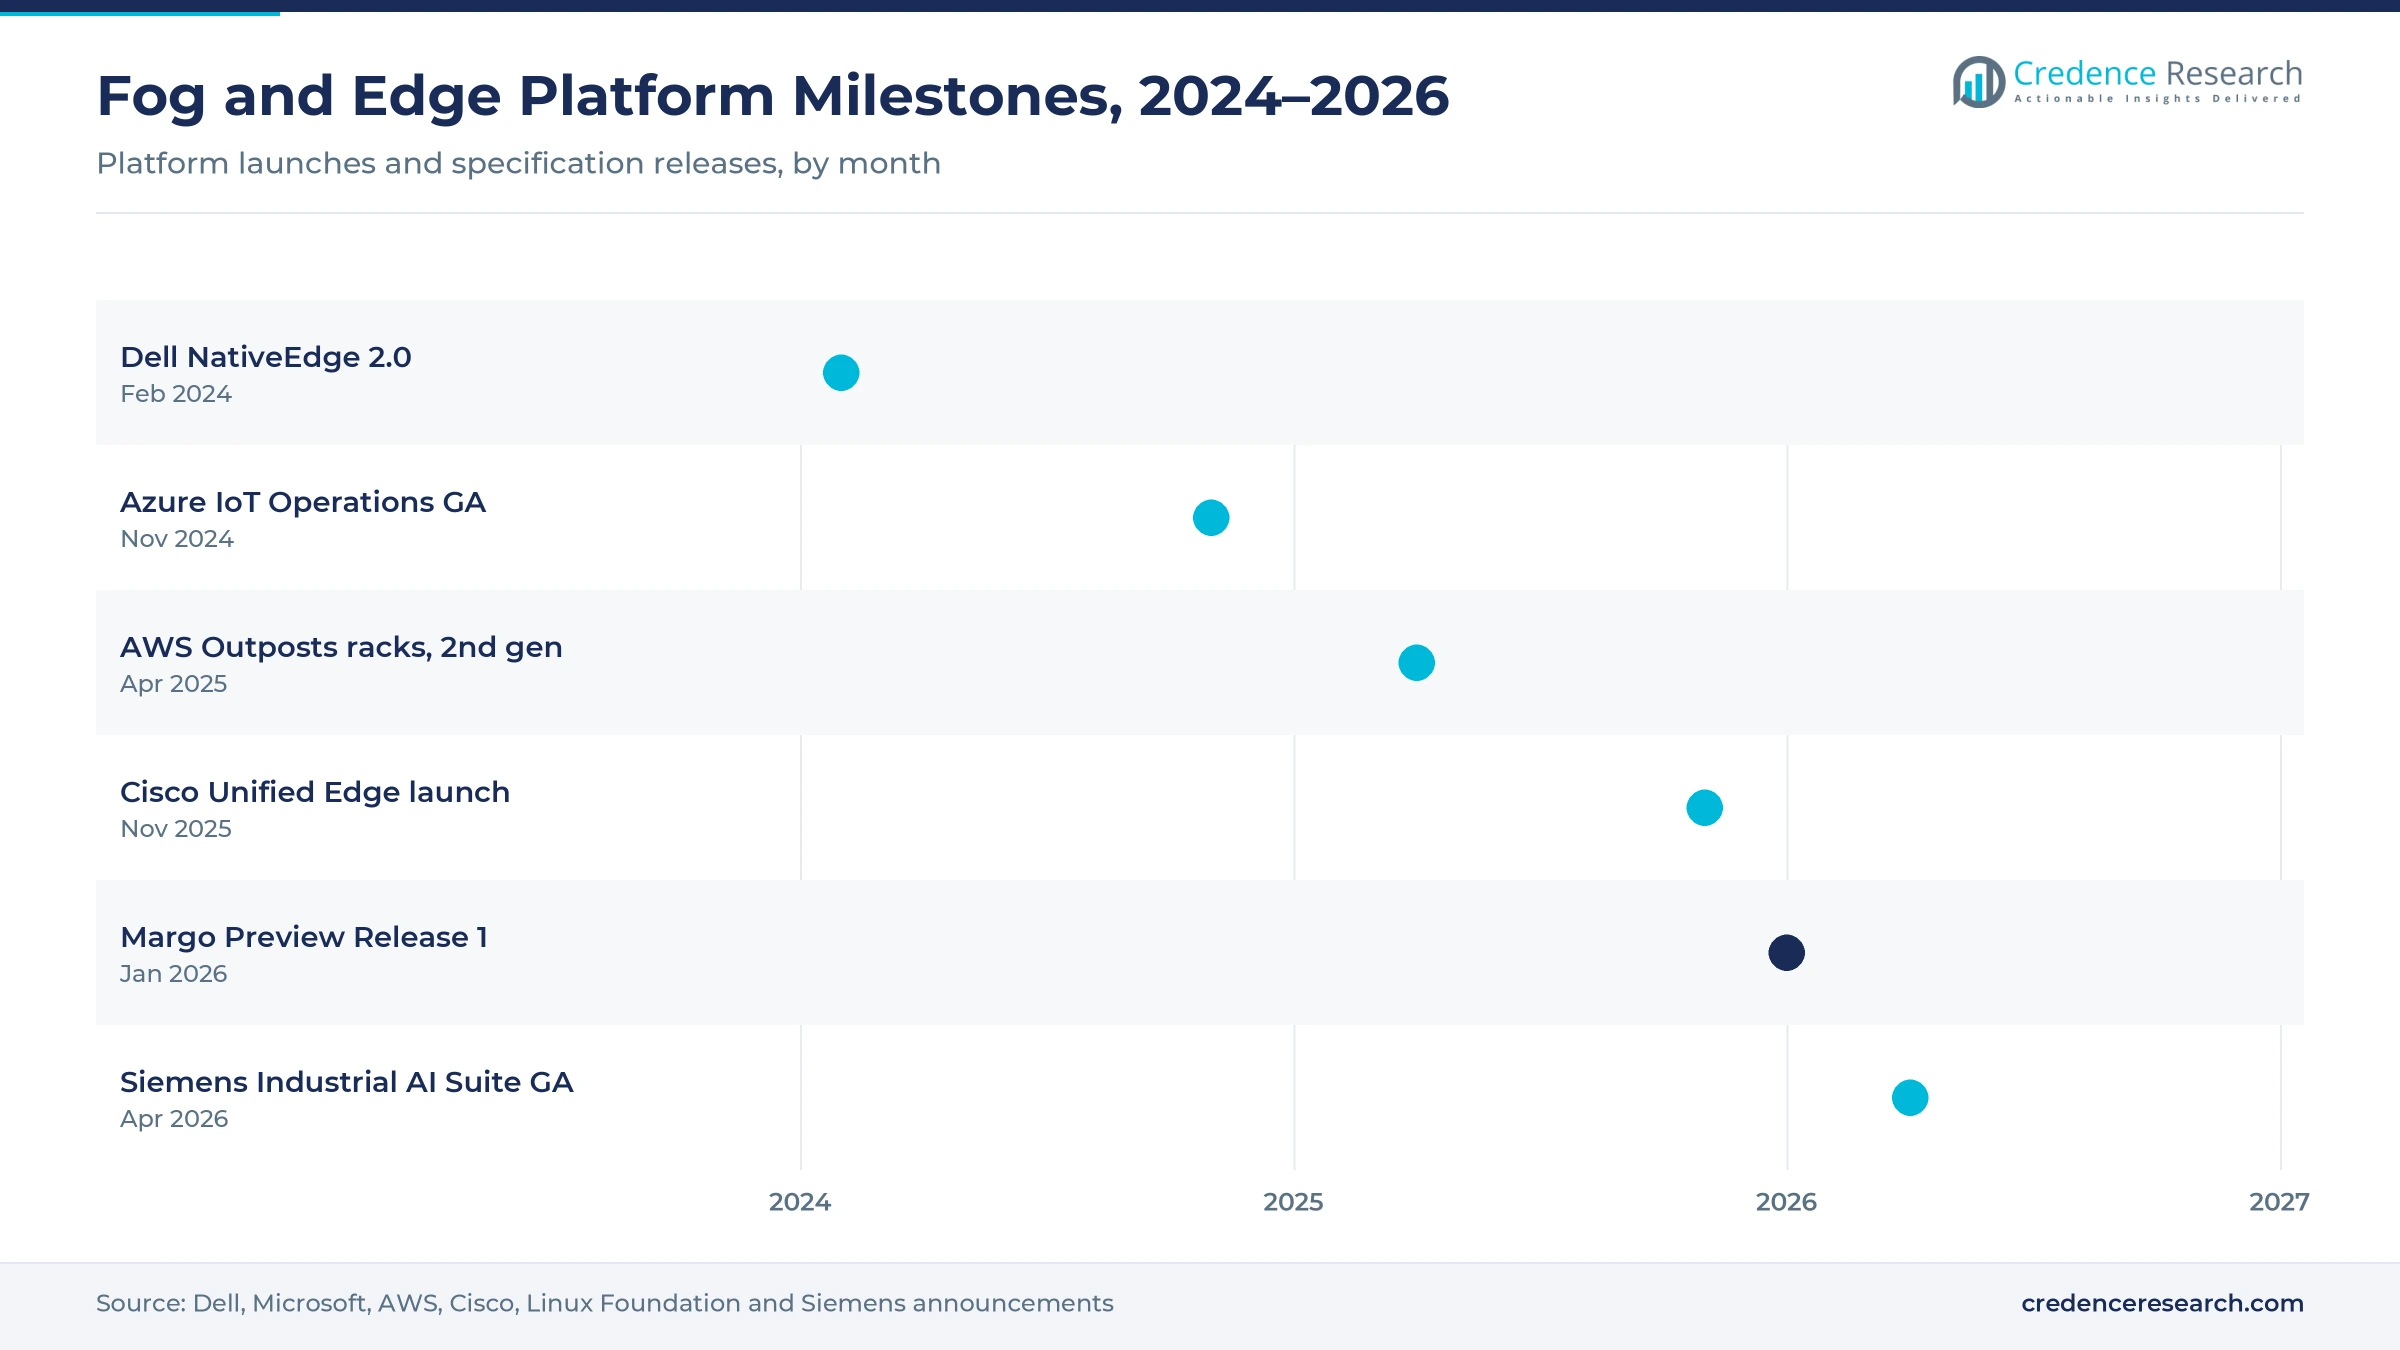
Edge platform launches and open specs mark 2025–2026
| Development | Status and market relevance |
|---|---|
| In April 2026, Siemens made its Industrial AI Suite generally available and showed Industrial Edge Management 2.0 at Hannover Messe 2026. | Available. Brings model deployment and fleet management onto one fog stack. |
| In January 2026, the Margo initiative published Preview Release 1 of its industrial edge interoperability specification, with a general release planned for 2026. | Preview. First public draft of a cross-vendor fog application standard. |
| In November 2025, Cisco launched Unified Edge on Nov. 3 for retail, healthcare and factory sites. | Launched. Integrates compute, networking, storage and security in one appliance. |
| In October 2025, ETSI released its first MEC Phase 4 specifications on Oct. 31, extending multi-access edge computing to the far edge. | Published. Aligns telecom edge interfaces with enterprise and IoT nodes. |
| In April 2025, AWS announced second-generation Outposts racks on April 29 for low-latency and data-residency workloads. | Available. Puts cloud-consistent compute on site. |
Orchestration, node AI and open interfaces shape fog tech
- Orchestration through Kubernetes-based fleet management, blueprints and support for OpenShift and Hyper-V lets one team update large node fleets from a single console.
- AI at the node runs on accelerators in compact edge servers for vision inspection and operator copilots beside the line, raising the value of each node.
- Virtual control through virtual PLCs and containerized SCADA moves control logic from proprietary hardware to general-purpose fog nodes.
- Interoperability specifications such as Margo and ETSI MEC Phase 4 aim to let applications move across vendor stacks and telecom edges.
- Security functions certified to IEC 62443-4-2, secure boot and remote attestation harden nodes in exposed locations.
Need a Custom Version of This Report?
Tailor the scope, geography, or segments to your exact requirements.
- Custom geography or segment scope
- Direct access to our analyst team
Automation houses, network vendors and hyperscalers compete
Four groups meet in the fog layer, starting with automation suppliers Siemens, Schneider Electric, Rockwell Automation and ABB, which own the machines and the plant relationship and sell edge software and industrial compute alongside control systems. Network and server vendors own the hardware channel, among them Cisco Systems, which pioneered the term fog computing with its IOx framework, Dell Technologies with NativeEdge, Hewlett Packard Enterprise with edge-optimized servers and Nokia with MX Industrial Edge. Microsoft and Amazon Web Services extend their clouds into the plant with Azure IoT Operations, IoT Greengrass and Outposts, bringing tools IT teams already know but less depth in plant protocols. Advantech, Moxa and OnLogic build rugged gateways and edge PCs. Software is more concentrated than hardware, because a handful of orchestration platforms manage most nodes, and open specifications such as Margo could lower switching costs over the forecast.
Companies profiled and their roles
| Company | Type | Role in the market |
|---|---|---|
| Siemens | Automation supplier | Industrial Edge ecosystem, virtual PLCs and Industrial AI Suite |
| Schneider Electric | Automation supplier | EcoStruxure Automation Expert and Modicon edge controllers |
| Rockwell Automation | Automation supplier | Edge software and industrial compute alongside control systems |
| ABB | Automation supplier | Edge software and industrial compute alongside control systems |
| Cisco Systems | Network vendor | IOx framework and Unified Edge appliance |
| Dell Technologies | Server vendor | NativeEdge orchestration platform |
| Hewlett Packard Enterprise | Server vendor | Edge-optimized servers and edge networking |
| Nokia | Network vendor | MX Industrial Edge with private wireless |
| Microsoft | Hyperscaler | Azure IoT Edge and Azure IoT Operations on Arc-enabled Kubernetes |
| Amazon Web Services | Hyperscaler | IoT Greengrass and Outposts racks |
| Advantech | Rugged hardware maker | Industrial gateways and edge PCs |
| Moxa | Rugged hardware maker | Industrial gateways and edge PCs |
The value of fog computing moves from the box to the fleet
Credence Research's view is that fog computing is a narrow, practical layer. It is the compute one or two hops from the machine, close enough to act in milliseconds and managed centrally like cloud software. Hardware still leads spending, but value is shifting to orchestration software and managed services as plants move from single gateways to fleets. Suppliers that combine plant relationships, certified security and open interfaces are best placed. The main risk is fragmentation slowing adoption, so buyers should watch Margo's general release and AI workload growth on the shop floor.
How Credence Research sized fog computing spending
The report uses 2025 as the base year and forecasts to 2035, with CAGR calculated over 2025–2035. Market values come from Credence Research's market model, built from estimated node deployments, software subscriptions and service attach rates and checked against suppliers' disclosures about their edge product lines; segment and regional splits are Credence Research estimates. The scope follows the definition in the NIST Fog Computing Conceptual Model. Supporting evidence comes from supplier announcements, standards-body releases and International Federation of Robotics data.
Orchestrated fleets run AI and control at the plant edge
Through 2035, fog computing will move from pilot gateways to orchestrated fleets that run AI inference, virtual control and data operations beside the machine. Software and managed services will take a larger share of spending as node prices fall and subscriptions compound. Asia Pacific will gain share as new electronics, battery and automotive plants open, while North America remains the largest region. Open specifications such as Margo, if widely adopted, will lower switching costs. The pace will depend on how quickly firms resolve IT and OT ownership and node security.
Frequently Asked Questions
What was the size of the fog computing market in 2025?
What is the forecast value and CAGR of the fog computing market?
How is fog computing different from edge computing?
Which region holds the largest share of the fog computing market?
Which component leads the fog computing market?
Which application uses the most fog computing?
Who are the major companies in the fog computing market?
What challenges could slow the fog computing market?
Table of Content
Chapter 1 Market Segmentation
- 1.1 Segmentation Framework
- 1.1.1 Product and Service Classification
- 1.1.2 Application and End-Use Classification
- 1.1.3 Technology and Solution Classification
- 1.1.4 Customer and Distribution Channel Classification
- 1.1.5 Geographic Segmentation
- 1.1.6 Market Segment Definitions and Boundaries
- 1.2 By Component
- 1.2.1 Hardware
- 1.2.2 Software
- 1.2.3 Services
- 1.3 By Application
- 1.3.1 Smart Manufacturing
- 1.3.2 Other Applications
- 1.3.3 Transportation & Logistics
- 1.3.4 Building & Home Automation
- 1.3.5 Connected Health
Chapter 2 Introduction
- 2.1 Report Objectives and Scope
- 2.2 Product Definition and Industry Terminology
- 2.3 Market Inclusions and Exclusions
- 2.4 Research Process
- 2.4.1 Primary Research and Expert Interviews
- 2.4.2 Secondary Research and Source Review
- 2.4.3 Top-Down and Bottom-Up Estimation
- 2.4.4 Data Triangulation and Verification
- 2.5 Market Size Measurement Basis
- 2.5.1 2025: USD 1.51 billion → 2035: USD 8.27 billion
- 2.6 Historical and Forecast Reference Periods
- 2.6.1 Historical Period: 2018-2025
- 2.6.2 Base Year: 2025
- 2.6.3 Forecast Period: 2025-2035
- 2.7 Research Assumptions and Limitations
Chapter 3 Executive Summary
- 3.1 Market Snapshot and Key Findings
- 3.2 Base-Year Market Size, 2025
- 3.3 Forecast Market Size, 2035
- 3.4 Revenue and Volume Growth Outlook
- 3.5 Key Demand and Supply Indicators
- 3.6 Leading Market Segments
- 3.7 Fastest-Growing Market Opportunities
- 3.8 Regional Performance Highlights
- 3.9 Technology and Industry Transformation
- 3.10 Competitive Landscape Summary
- 3.11 Analyst View and Strategic Implications
Chapter 4 Global Fog Computing Market Trends and Developments
- 4.1 Historical Industry Development, 2018-2025
- 4.2 Recent Market Trends and Developments
- 4.3 Demand and Customer Behavior Trends
- 4.4 Technology and Product Innovation
- 4.5 Artificial Intelligence, Automation and Digitalization
- 4.6 Local Manufacturing and Supply Chain Realignment
- 4.7 Industry Partnerships, Mergers and Acquisitions
- 4.8 Sustainability and Circular Economy Developments
- 4.9 Government and Private Sector Investment Trends
- 4.10 Emerging Business Models and Commercialization
- 4.11 Industry Developments and Announcements
Chapter 5 Global Fog Computing Market Production, Supply and Demand Analysis
- 5.1 Demand Trend and Consumption Analysis, 2018-2025
- 5.2 Demand Forecast, 2025-2035
- 5.3 Production and Output Trend, 2018-2025
- 5.4 Production and Output Forecast, 2025-2035
- 5.5 Installed Capacity and Capacity Utilization
- 5.6 Company-Wise Production Plants and Statistics
- 5.6.1 Installed Production Capacity
- 5.6.2 Actual Production
- 5.6.3 Planned Capacity and Expansion Targets
- 5.7 Supply Chain Structure and Procurement Trends
- 5.8 Supply-Demand Gap and Bottlenecks
- 5.9 Import Dependence and Sourcing Structure
- 5.10 Contract Manufacturing and Outsourcing
- 5.11 Regional Supply and Demand Concentration
Chapter 6 Global Fog Computing Market Pricing Analysis
- 6.1 Pricing Structure and Measurement
- 6.2 Historical Pricing Trends, 2018-2025
- 6.3 Pricing Outlook, 2025-2035
- 6.4 Average Selling Price and Unit Economics
- 6.5 Pricing by Product and Market Segment
- 6.6 Geographic Pricing Differences
- 6.7 Key Input, Energy, Labor and Logistics Costs
- 6.8 Contract Pricing and Purchasing Models
- 6.9 Pricing Sensitivity and Competitive Positioning
- 6.10 Price, Margin and Profitability Implications
Chapter 7 Global Fog Computing Market Dynamics
- 7.1 Market Growth Drivers
- 7.1.1 Demand-Side Drivers
- 7.1.2 Technology and Innovation Drivers
- 7.1.3 Infrastructure and Investment Drivers
- 7.1.4 Regulatory and Policy Drivers
- 7.2 Market Restraints
- 7.2.1 Cost and Affordability Constraints
- 7.2.2 Technology and Adoption Barriers
- 7.2.3 Supply Chain and Operational Constraints
- 7.3 Market Challenges
- 7.3.1 Competitive Pressure and Margin Erosion
- 7.3.2 Skills, Infrastructure and Implementation Gaps
- 7.4 Emerging Market Opportunities
- 7.5 Market Dynamics Impact and Time-Horizon Assessment
Chapter 8 Global Fog Computing Value Chain Analysis
- 8.1 Industry Value Chain Overview
- 8.2 Upstream Suppliers and Critical Inputs
- 8.3 Technology and Component Providers
- 8.4 Manufacturing or Service Delivery
- 8.5 Distribution, Channel Partners and Integrators
- 8.6 Downstream Applications and End Users
- 8.7 Value Addition and Profit Pools
- 8.8 Vertical Integration and Outsourcing
- 8.9 Supplier Concentration and Risk
- 8.10 Supply Chain Localization and Resilience
Chapter 9 Global Fog Computing Market Regulations and Policies
- 9.1 Relevant Laws, Standards and Compliance Frameworks
- 9.2 Product, Service, Safety and Quality Requirements
- 9.3 Government Policies, Incentives and Subsidies
- 9.4 Imports, Exports and Trade Barriers
- 9.5 Public Procurement and Local Content Requirements
- 9.6 Environmental and Sustainability Compliance
- 9.7 Data Protection, AI and Cybersecurity Compliance
- 9.8 Upcoming Policy Changes and Market Implications
Chapter 10 Global Fog Computing Market Hotspots and Opportunities
- 10.1 Market Opportunity Mapping and Growth Hotspots
- 10.2 High-Growth Applications and Customer Groups
- 10.3 Underserved Markets and White-Space Opportunities
- 10.4 Emerging Technology and Product Opportunities
- 10.5 New Capacity and Investment Hotspots
- 10.6 Market Entry and Expansion Opportunities
- 10.7 Distribution and Partnership Opportunities
- 10.8 Near-Term and Long-Term Commercial Potential
- 10.9 Opportunity Attractiveness and Execution Risks
Chapter 11 Global Fog Computing Market Outlook, 2025-2035
- 11.1 Market Size and Analysis
- 11.1.1 Revenue (Market Measurement: 2025: USD 1.51 billion → 2035: USD 8.27 billion)
- 11.1.2 Market Volume and Quantity Sold
- 11.1.3 Historical Market Size, 2018-2025
- 11.1.4 Base-Year Market Size, 2025
- 11.2 Market Forecast, 2025-2035
- 11.2.1 Revenue Forecast to 2035
- 11.2.2 Volume Forecast to 2035
- 11.2.3 CAGR and Year-on-Year Growth
- 11.2.4 Incremental Revenue Opportunity
- 11.3 Forecast Assumptions and Scenario Analysis
- 11.3.1 Base-Case Forecast
- 11.3.2 Optimistic and Conservative Scenarios
- 11.3.3 Technology, Pricing and Policy Sensitivities
- 11.4 Market Attractiveness and Growth Outlook
Chapter 12 Global Fog Computing Market Segmentation and Outlook
- 12.1 Segmentation Summary and Market Shares, 2025
- 12.2 Largest and Fastest-Growing Segments
- 12.3 By Component - Market Size and Forecast, 2025-2035
- 12.3.1 Segment Definition and Scope
- 12.3.2 Historical Market Size, 2018-2025
- 12.3.3 Revenue Forecast, 2025-2035
- 12.3.4 Volume Forecast, 2025-2035
- 12.3.5 Base-Year Market Share, 2025
- 12.3.6 Segment CAGR and Growth Drivers
- 12.3.7 Subsegment Market Size and Forecast
- 12.3.7.1 Hardware
- 12.3.7.2 Software
- 12.3.7.3 Services
- 12.3.8 Subsegment Pricing and Adoption Trends
- 12.3.9 Leading Suppliers and Competition
- 12.3.10 Regional Demand and Opportunities
- 12.4 By Application - Market Size and Forecast, 2025-2035
- 12.4.1 Segment Definition and Scope
- 12.4.2 Historical Market Size, 2018-2025
- 12.4.3 Revenue Forecast, 2025-2035
- 12.4.4 Volume Forecast, 2025-2035
- 12.4.5 Base-Year Market Share, 2025
- 12.4.6 Segment CAGR and Growth Drivers
- 12.4.7 Subsegment Market Size and Forecast
- 12.4.7.1 Smart Manufacturing
- 12.4.7.2 Other Applications
- 12.4.7.3 Transportation & Logistics
- 12.4.7.4 Building & Home Automation
- 12.4.7.5 Connected Health
- 12.4.8 Subsegment Pricing and Adoption Trends
- 12.4.9 Leading Suppliers and Competition
- 12.4.10 Regional Demand and Opportunities
- 12.5 Segment Growth Comparison
- 12.6 Segment Attractiveness and Priority Matrix
Chapter 13 Global Fog Computing End-Use and Application Market Outlook
- 13.1 End-Use Industry and Customer Demand Structure
- 13.2 Leading Applications and Customer Groups
- 13.3 End-Use Market Size, Share and Forecast
- 13.4 Major End-Use Industry Deep Dives
- 13.4.1 Customer Requirements and Use Cases
- 13.4.2 Demand and Replacement Cycles
- 13.4.3 Technical and Regulatory Considerations
- 13.4.4 Purchasing and Procurement Models
- 13.4.5 Leading Vendors and Distribution Channels
- 13.4.6 Forecast and Commercial Opportunities
- 13.5 Emerging Applications and Cross-Segment Demand
- 13.6 End-Use Industry Investment Priorities
Chapter 14 Global Fog Computing Geographic Market Outlook, 2025-2035
- 14.1 Regional Market Size and Share, 2025
- 14.2 Regional Market Forecast, 2025-2035
- 14.3 Regional Pricing, Production and Demand Differences
- 14.4 North America
- 14.4.1 United States
- 14.4.2 Canada
- 14.4.3 Mexico
- 14.5 Europe
- 14.5.1 Germany
- 14.5.2 France
- 14.5.3 Italy
- 14.5.4 United Kingdom
- 14.5.5 Spain
- 14.5.6 Poland
- 14.5.7 Russia
- 14.5.8 Netherlands
- 14.5.9 Belgium
- 14.5.10 Sweden
- 14.5.11 Denmark
- 14.5.12 Norway
- 14.5.13 Rest of Europe
- 14.6 Asia Pacific
- 14.6.1 China
- 14.6.2 India
- 14.6.3 Japan
- 14.6.4 South Korea
- 14.6.5 Thailand
- 14.6.6 Indonesia
- 14.6.7 Vietnam
- 14.6.8 Malaysia
- 14.6.9 Australia
- 14.6.10 Rest of Asia Pacific
- 14.7 Latin America
- 14.7.1 Brazil
- 14.7.2 Argentina
- 14.7.3 Colombia
- 14.7.4 Chile
- 14.7.5 Rest of Latin America
- 14.8 Middle East
- 14.8.1 Saudi Arabia
- 14.8.2 United Arab Emirates
- 14.8.3 Turkey
- 14.8.4 Israel
- 14.8.5 Iran
- 14.8.6 Rest of the Middle East
- 14.9 Africa
- 14.9.1 South Africa
- 14.9.2 Egypt
- 14.9.3 Nigeria
- 14.9.4 Morocco
- 14.9.5 Rest of Africa
- 14.10 Regional Investment, Policy and Supply Chain Differences
- 14.11 Regional Competitive Landscape
- 14.12 Geographic Growth Hotspots
Chapter 15 Global Fog Computing Technology, Innovation and Sustainability Outlook
- 15.1 Technology Landscape and Maturity
- 15.2 Product, Process and Service Innovation
- 15.3 AI, Automation and Digital Tools in the Industry
- 15.4 Technology Adoption and Performance Benchmarking
- 15.5 Innovation Pipeline and R&D Investment
- 15.6 Patent and Intellectual Property Trends
- 15.7 Energy Efficiency and Resource Management
- 15.8 Sustainability, Recycling and Circularity
- 15.9 Technology Roadmap, 2025-2035
- 15.10 Risks of Obsolescence and Technology Substitution
Chapter 16 Global Fog Computing Market Key Strategic Imperatives
- 16.1 Growth and Market Entry Priorities
- 16.2 High-Return Products and Segments
- 16.3 Pricing, Profitability and Cost Optimization
- 16.4 Technology Investment and Product Differentiation
- 16.5 Supply Chain Localization and Resilience
- 16.6 Distribution and Customer Acquisition
- 16.7 Partnership, Acquisition and Capacity Strategy
- 16.8 Regional Expansion Priorities
- 16.9 Short-, Medium- and Long-Term Actions
Chapter 17 Competition Outlook
- 17.1 Industry Competition Characteristics
- 17.2 Market Structure and Concentration
- 17.3 Market Share and Competitive Positioning, 2025
- 17.4 Company-Wise Revenue and Product Benchmarking
- 17.5 Production and Service Capacity Benchmarking
- 17.6 Technology, Pricing and Differentiation
- 17.7 Regional Footprint and Distribution Strength
- 17.8 Mergers, Acquisitions and Strategic Alliances
- 17.9 New Entrants and Competitive Threats
- 17.10 Porter's Five Forces and Industry Attractiveness
- 17.11 Competitive Outlook, 2025-2035
Chapter 18 Company Profiles
- 18.1 Company Coverage and Selection Criteria
- 18.2 Siemens
- 18.2.1 Business Description
- 18.2.2 Company Ownership and Geographic Presence
- 18.2.3 Product and Service Portfolio
- 18.2.4 Manufacturing and Operating Footprint
- 18.2.5 Production Capacity and Expansion Plans
- 18.2.6 Financial Performance and Investment
- 18.2.7 Market Share and Competitive Position
- 18.2.8 Technology and Innovation Capabilities
- 18.2.9 Strategic Alliances or Partnerships
- 18.2.10 Recent Developments
- 18.2.11 Growth Strategy and Outlook
- 18.3 Cisco Systems
- 18.4 Dell Technologies
- 18.5 Hewlett Packard Enterprise
- 18.6 Schneider Electric
- 18.7 Nokia
- 18.8 Microsoft
- 18.9 Amazon Web Services
- 18.10 Rockwell Automation
- 18.11 ABB
- 18.12 Advantech
- 18.13 Moxa
- 18.14 Other Relevant Market Participants
Note: Every listed company is profiled on the structure shown under the first company. The company list is preliminary and may change based on research findings, market developments, data availability and client requirements.
Chapter 19 Disclaimer
- 19.1 Research and Forecast Disclaimer
- 19.2 Data Source and Estimation Limitations
Note: The depth of individual sections depends on data availability for this market. Volume, capacity, trade and other unit-based metrics are included where applicable.