
Functional Foods and Natural Health Products Market Overview:
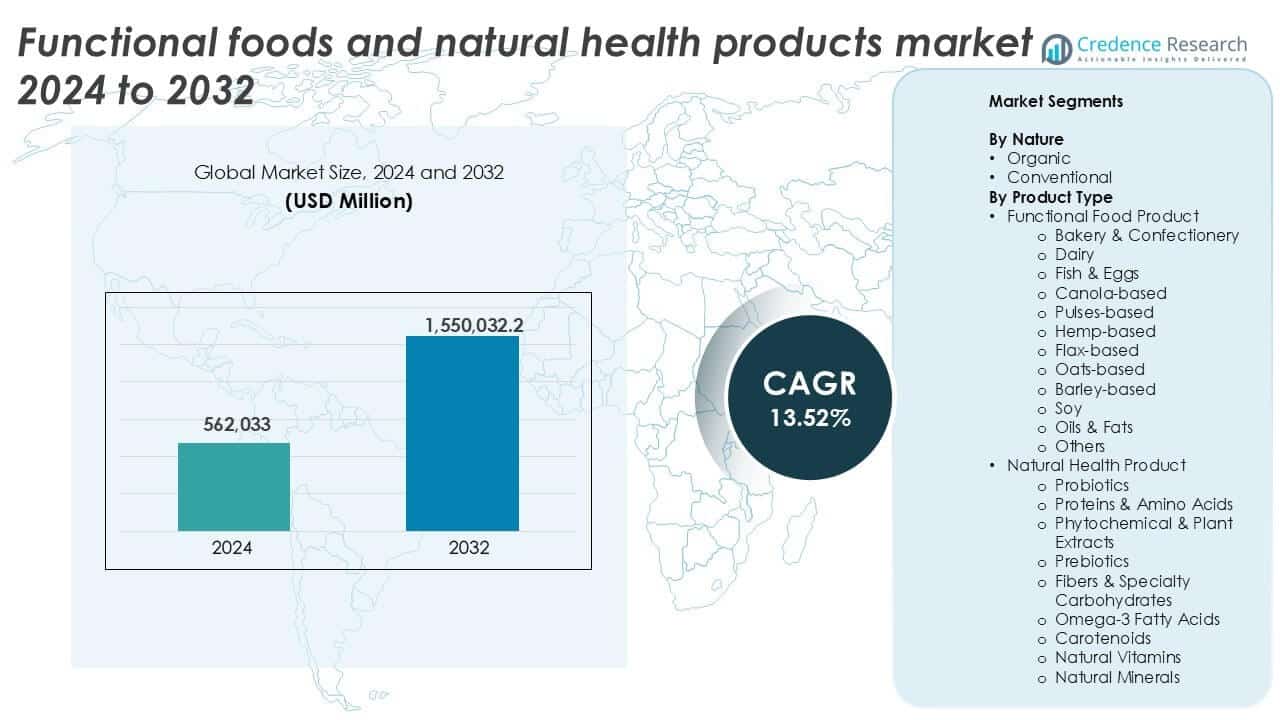
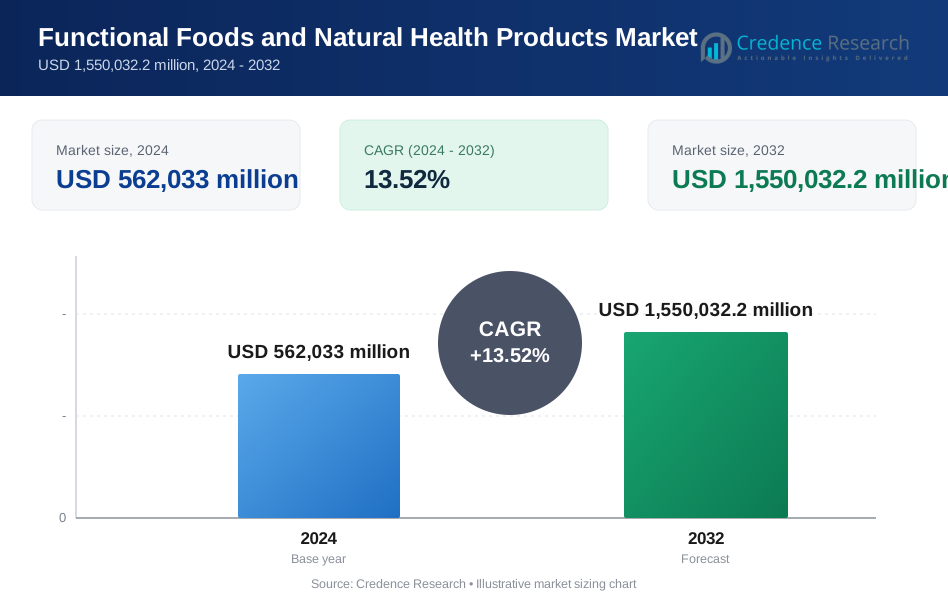
The Functional Foods and Natural Health Products market size was valued at USD 562,033 million in 2024 and is anticipated to reach USD 1,550,032.2 million by 2032, at a CAGR of 13.52% during the forecast period.
| REPORT ATTRIBUTE | DETAILS |
|---|---|
| Historical Period | 2020-2023 |
| Base Year | 2024 |
| Forecast Period | 2025-2032 |
| Functional Foods and Natural Health Products Market Size 2024 | USD 562,033 million |
| Functional Foods and Natural Health Products Market, CAGR | 13.52% |
| Functional Foods and Natural Health Products Market Size 2032 | USD 1,550,032.2 million |
Top players in the functional foods and natural health products market include Nestlé SA, General Mills Inc., Kellogg Company, Mondelez International, Mars Incorporated, and Herbalife. These companies lead through strong global distribution, diverse product lines, and consistent investment in wellness innovation. Niche brands like Bellring Brands, Caveman Foods LLC, 1440 Foods, and Hearthside Food Solutions are also gaining ground with protein-rich, clean-label, and plant-based offerings. North America dominated the market in 2024, accounting for 34% of global revenue, driven by high health awareness, advanced retail systems, and early adoption of functional nutrition trends.
Functional Foods and Natural Health Products Market Insights
- The functional foods and natural health products market was valued at USD 562,033 million in 2024 and is projected to reach USD 1,550,032.2 million by 2032, growing at a CAGR of 13.52%.
- Rising health awareness and increasing preference for preventive care drive demand for daily nutrition through fortified foods and natural supplements.
- Clean-label, plant-based, and personalized nutrition trends are reshaping product innovation across functional snacks, beverages, and supplements.
- Key players like Nestlé, General Mills, Kellogg, and Herbalife dominate the market, while emerging brands such as 1440 Foods and Caveman Foods drive niche category growth.
- North America leads with a 34% market share, followed by Europe at 27% and Asia Pacific at 24%; functional food products account for over 60% of total revenue, with dairy-based and soy-based categories leading among product types.
Functional Foods and Natural Health Products Market Segmentation Analysis:
By Nature
The functional foods and natural health products market is segmented into organic and conventional categories. In 2024, the conventional segment held the dominant share, accounting for over 70% of the market. Its stronghold is driven by affordability, wider availability, and established consumer trust in conventional fortified food products and supplements. Mass retail distribution and large-scale production practices further support the segment’s volume dominance. However, rising consumer awareness of clean-label ingredients and sustainability is accelerating the shift toward organic options, particularly in premium urban markets across North America and Europe.
- For instance, Nestlé Health Science produces over 1.5 billion servings of its Boost and Resource brands annually through conventional production lines across multiple continents.
By Product Type
Among product types, functional food products led the market in 2024 with over 60% share, supported by increasing demand for daily nutrition through fortified foods. Within this, dairy-based products and soy-based items collectively contributed the largest revenue share, fueled by high protein content, digestive health benefits, and wide consumer acceptance. In the natural health products segment, probiotics and omega-3 fatty acids remained top contributors due to rising focus on gut and heart health. Growing preventive healthcare trends and clinical backing continue to drive product diversification across both segments.
- For instance, in 2023, Danone’s Essential Dairy and Plant-based (EDP) division which includes Activia and Actimel generated over €13.5 billion in net sales globally. These brands target gut health and immunity, contributing to the roughly 60% of EDP revenues that Danone derives from high value-added functional health segments.
Functional Foods and Natural Health Products Market Key Growth Drivers
Rising Health Awareness and Preventive Healthcare Focus
Consumers are increasingly shifting from reactive to preventive health approaches, fueling demand for functional foods and natural health products. Chronic diseases such as diabetes, obesity, and cardiovascular issues are prompting individuals to seek daily nutritional support through food. This awareness is strongly supported by global public health campaigns and nutrition education programs, especially across North America and Europe. Functional products like probiotics, omega-3s, and fiber-rich foods are gaining popularity as part of regular diets. Millennials and Gen Z consumers are also driving interest in products with immune-boosting, anti-aging, and digestive health benefits. As healthcare costs rise, consumers prefer cost-effective wellness solutions through dietary choices. This shift plays a key role in expanding product portfolios across categories such as dairy, plant-based proteins, and fortified beverages.
- For instance, Yakult Honsha reported global sales of over 40 million bottles per day in 2023, driven by strong probiotic demand for gut health.
Growth in Aging Population and Lifestyle Diseases
The growing global elderly population significantly boosts demand for natural health supplements and fortified food products. Individuals aged 60 and above are prone to nutritional deficiencies, bone loss, and weakened immunity, creating strong demand for products offering calcium, vitamins, and omega-3 fatty acids. Functional food blends and supplement formulations tailored for seniors are gaining traction, particularly in developed regions like Japan, Europe, and the U.S. At the same time, a rising incidence of sedentary lifestyle diseases among younger adults is accelerating adoption of functional beverages and fiber-rich foods. The dual pressure of aging-related needs and modern health issues is encouraging long-term consumption of natural wellness products. This demographic shift also supports R&D into new delivery formats like gummies, ready-to-drink supplements, and fortified snacks.
- For instance, Abbott’s Ensure line reached over USD 1.2 billion in annual global sales by 2023, largely from senior-focused nutritional beverages.
Expansion of Retail and E-Commerce Distribution Channels
Wider product accessibility through physical and digital retail is a key growth enabler in the market. Supermarkets, health stores, pharmacies, and specialty outlets continue to expand their wellness product shelves. In parallel, e-commerce platforms are streamlining access to niche, premium, and international health food brands, especially in urban and semi-urban areas. Subscription-based delivery models and D2C brands are capitalizing on personalization and convenience. Enhanced product visibility through influencer marketing, health blogs, and mobile apps further supports trial and repeat purchase. Online platforms also allow easier comparison of ingredient transparency, certifications (organic, vegan, non-GMO), and functional claims. This multichannel distribution model helps both legacy brands and startups reach targeted health-conscious consumers efficiently.
Functional Foods and Natural Health Products Market Key Trends & Opportunities
Increased Demand for Plant-Based and Clean-Label Products
Consumers are increasingly favoring plant-based formulations in both functional foods and natural health products. Demand for soy, flax, oats, pulses, and hemp-based items has risen due to their perceived natural origin and sustainability benefits. Clean-label trends, which emphasize fewer artificial additives, transparent sourcing, and organic certification, are influencing both formulation and packaging strategies. Health-conscious consumers now demand ingredient clarity, especially in urban markets. This trend offers opportunities for innovation in plant-based dairy alternatives, meat substitutes fortified with functional ingredients, and allergen-free supplements. Brands investing in traceable supply chains, non-GMO labeling, and minimal processing will gain a competitive edge in both developed and emerging markets.
- For instance, Oatly reported producing over 420 million liters of oat-based products globally in 2023, expanding into 20+ countries with plant-based functional beverages.
Personalized Nutrition and Targeted Health Solutions
The growing interest in personalized wellness is transforming product development in the market. Consumers now seek tailored solutions based on age, lifestyle, allergies, and specific health goals such as immunity, digestion, or cognitive function. This demand is supported by rising use of health tracking devices, DNA testing kits, and AI-driven dietary apps. Companies are responding with personalized supplement packs, microbiome-focused probiotic blends, and functional snacks for specific needs. Brands that offer data-driven customization-especially via digital platforms have a significant opportunity to build loyalty. This trend also opens space for nutraceutical startups and tech-enabled platforms offering tailored nutrition as a service.
Functional Foods and Natural Health Products Market Key Challenges
Regulatory Complexities and Varying Global Standards
The regulatory landscape for functional foods and natural health products varies widely across countries. Approvals for health claims, ingredient lists, labeling, and fortification levels are not harmonized globally. In the U.S., the FDA classifies functional foods differently than the EU’s EFSA, creating hurdles for multinational product launches. Meeting local compliance standards adds time, cost, and complexity to market entry strategies. Moreover, functional claims must be backed by strong clinical evidence, which requires investment in scientific studies. Small and mid-sized players often struggle to navigate this fragmented regulatory environment, delaying product innovation. Regulatory clarity and harmonization remain critical to enable international growth and faster product rollouts.
Consumer Skepticism and Misinformation
Despite growing awareness, a significant portion of consumers remain skeptical about the efficacy of functional foods and supplements. Misleading claims, inconsistent product quality, and lack of visible results can reduce consumer trust. Overuse of marketing buzzwords like “natural” or “immune-boosting” without clinical backing raises concerns, especially among educated buyers. Online misinformation and unregulated product listings on e-commerce platforms further complicate consumer decision-making. This skepticism is more pronounced in developing markets with limited health education. To overcome this challenge, companies must invest in transparent communication, third-party certifications, and science-backed branding. Building consumer trust through evidence-based claims and quality assurance is vital for long-term market adoption.
Functional Foods and Natural Health Products Market Regional Analysis
North America
North America led the functional foods and natural health products market in 2024, accounting for over 34% market share. The region benefits from high consumer health awareness, advanced retail infrastructure, and a strong base of health-conscious aging populations. The U.S. drives the majority of demand, supported by high per capita spending on wellness and preventive care. Functional beverages, probiotics, and omega-3 supplements remain top-selling categories. Canada follows with steady demand for organic and clean-label products. Regulatory clarity, combined with robust innovation from key players, continues to support product launches and market expansion across both countries.
Europe
Europe held a 27% share of the global market in 2024, driven by strong consumer preference for natural, organic, and ethically sourced health products. Countries like Germany, the UK, France, and Italy lead in adoption, especially for plant-based and dairy-alternative functional foods. The European Food Safety Authority’s (EFSA) strict regulations shape market dynamics but also enhance product credibility. Aging populations, rising demand for gut-health-focused supplements, and increasing popularity of on-the-go fortified snacks support growth. E-commerce platforms and pharmacies continue to expand their offerings, enabling wider access across both urban and rural regions.
Asia Pacific
Asia Pacific represented 24% of the global market share in 2024 and is expected to show the fastest growth through 2032. China, Japan, India, and South Korea lead in consumption, driven by rapid urbanization, rising disposable incomes, and increasing interest in preventive health. Traditional dietary habits support easy integration of functional ingredients, especially plant-based and herbal products. Japan has a mature market for fortified foods and beverages, while China and India show surging demand for immunity-boosting and digestive health supplements. Expansion of modern retail and digital platforms further supports product visibility and adoption across varied income groups.
Latin America
Latin America accounted for approximately 7% market share in 2024, with Brazil, Mexico, and Argentina leading regional demand. Rising middle-class populations and growing interest in wellness trends are fueling adoption of fortified dairy products, protein-rich snacks, and herbal supplements. Urban consumers increasingly seek functional products that support energy, metabolism, and immunity. Regulatory improvements and increased participation from international brands are enhancing product variety and quality. However, price sensitivity and limited consumer education remain barriers in rural regions. The region holds steady potential as awareness and distribution networks continue to improve.
Middle East & Africa
The Middle East & Africa held around 5% share of the global market in 2024. Growth is driven by increasing focus on lifestyle-related health issues, rising healthcare costs, and a growing youth population. Gulf countries like the UAE and Saudi Arabia are witnessing increased demand for functional foods and natural supplements, especially in fitness, weight management, and energy categories. Africa’s market remains nascent but shows early growth signs due to improving retail infrastructure and health awareness campaigns. The region offers long-term potential, especially for affordable, plant-based, and locally adapted product formats targeting specific nutritional deficiencies.
Functional Foods and Natural Health Products Market Segmentations:
By Nature
- Organic
- Conventional
By Product Type
- Functional Food Product
- Bakery & Confectionery
- Dairy
- Fish & Eggs
- Canola-based
- Pulses-based
- Hemp-based
- Flax-based
- Oats-based
- Barley-based
- Soy
- Oils & Fats
- Others
- Natural Health Product
- Probiotics
- Proteins & Amino Acids
- Phytochemical & Plant Extracts
- Prebiotics
- Fibers & Specialty Carbohydrates
- Omega-3 Fatty Acids
- Carotenoids
- Natural Vitamins
- Natural Minerals
By Geography
- North America
- U.S.
- Canada
- Mexico
- Europe
- Germany
- France
- U.K.
- Italy
- Spain
- Rest of Europe
- Asia Pacific
- China
- Japan
- India
- South Korea
- South-east Asia
- Rest of Asia Pacific
- Latin America
- Brazil
- Argentina
- Rest of Latin America
- Middle East & Africa
- GCC Countries
- South Africa
- Rest of the Middle East and Africa
Functional Foods and Natural Health Products Market Competitive Landscape
The functional foods and natural health products market features a highly competitive landscape with both multinational giants and emerging niche players actively shaping growth. Companies like Nestlé SA, Kellogg Company, General Mills Inc., and Mondelez International maintain dominance through wide product portfolios, global reach, and sustained investment in R&D. These firms leverage clinical research, strong distribution networks, and brand loyalty to capture large consumer segments. Simultaneously, companies such as Bellring Brands, Caveman Foods LLC, and 1440 Foods are carving space with clean-label, plant-based, and protein-enriched offerings. Herbalife and other nutrition-focused brands drive growth through direct selling and personalized health solutions. Strategic mergers, acquisitions, and new product launches remain common to strengthen market position and expand into high-growth regions. Companies are also increasingly using digital platforms, subscription models, and influencer-driven campaigns to improve consumer engagement. Regulatory compliance, ingredient transparency, and innovation in functional formulations are key factors defining long-term competitive advantage.
Key Player Analysis
- Bellring Brands, Inc
- Nestlé SA
- Mondelez International
- Caveman Foods LLC
- Mars, Incorporated
- Herbalife
- Hearthside Food Solutions LLC
- 1440 Foods
- Kellogg Company
- General Mills Inc.
Recent Developments
- In March 2024, Bellring Brands, Inc. launched a ready-to-drink high-protein shake named Cookie Dough through one of its brands, Premier Proteins. It can be consumed along with breakfast or as a snack in the afternoon. It requires no baking, and considering the health-conscious consumer base, ingredients are used.
- In February 2024, Cargill strengthened its partnership with ENOUGH, a sustainable fermented protein producer, to co-develop nutritious alternative meat and dairy products. The company invested in ENOUGH’s Series C funding round and entered a commercial agreement to use and market its fermented protein.
- In August 2023, ConCordix Inc., a Vitux group food manufacturing company, entered the Canadian food market by opening a production facility in Canada. This set-up will mainly produce smart chews, which are consumed as dietary supplements for immune support and vitamin deficiencies.
Report Coverage
The research report offers an in-depth analysis based on Nature, Product Type and Geography. It details leading market players, providing an overview of their business, product offerings, investments, revenue streams, and key applications. Additionally, the report includes insights into the competitive environment, SWOT analysis, current market trends, as well as the primary drivers and constraints. Furthermore, it discusses various factors that have driven market expansion in recent years. The report also explores market dynamics, regulatory scenarios, and technological advancements that are shaping the industry. It assesses the impact of external factors and global economic changes on market growth. Lastly, it provides strategic recommendations for new entrants and established companies to navigate the complexities of the market.
Future Outlook
- Demand for personalized nutrition solutions will grow due to rising interest in targeted health benefits.
- Clean-label and plant-based products will dominate new product launches across global markets.
- E-commerce and direct-to-consumer channels will continue expanding product accessibility and brand reach.
- Functional beverages and ready-to-eat snacks will gain more traction in busy urban lifestyles.
- Investment in clinical research will increase to support health claims and build consumer trust.
- Companies will focus on fortified products addressing gut health, immunity, and cognitive wellness.
- Asia Pacific will emerge as the fastest-growing region driven by rising incomes and health awareness.
- Regulatory harmonization efforts may improve global market entry for new functional ingredients.
- Startups and niche brands will grow by offering allergen-free and ethically sourced formulations.
- Large players will pursue mergers and acquisitions to expand product portfolios and regional presence.
Request a Free Sample
Fill in your details and we'll send you a free sample report.
- Sample data tables & charts
- Research methodology
Need a Custom Version of This Report?
Tailor the scope, geography, or segments to your exact requirements.
- Custom geography or segment scope
- Direct access to our analyst team
Frequently Asked Questions
What is the current market size for the Functional foods and natural health products market, and what is its projected size in 2032?
At what Compound Annual Growth Rate is the Functional foods and natural health products market projected to grow between 2024 and 2032?
Which Functional foods and natural health products market segment held the largest share in 2024?
What are the primary factors fueling the growth of the Functional foods and natural health products market?
Who are the leading companies in the Functional foods and natural health products market?
Which region commanded the largest share of the Functional foods and natural health products market in 2024?
Table of Content
Chapter 1. Report Introduction
- 1.1 Report Description & Purpose
- 1.1.1 Report Title & Market Definition
- 1.1.2 Unique Selling Propositions (USP) & Key Differentiators
- 1.1.3 Value Proposition for Stakeholders
- 1.2 Research Objectives
- 1.2.1 Market Sizing Objectives (Volume & Revenue) (Volume Where Applicable)
- 1.2.2 Segmentation Objectives
- 1.2.3 Competitive Intelligence Objectives
- 1.2.4 Forecast & Scenario Objectives
- 1.3 Report Scope
- 1.3.1 Functional Foods and Natural Health Products Scope – Segments & Subsegments Covered
- 1.3.2 Geographic Scope – Regions & Countries Covered
- 1.3.3 Historical Period, Base Year & Forecast Period (2024; forecast to 2032)
- 1.3.4 Inclusions & Exclusions
- 1.4 Industry Classification & Applicable Codes
- 1.5 Currency, Measurement Units & Valuation Basis
- 1.6 Target Stakeholders
- 1.7 Limitations & Assumptions
Chapter 2. Executive Summary
- 2.1 Global Functional Foods and Natural Health Products Market Snapshot
- 2.1.1 Market Size – Historical (2024) & Forecast (2024-2032) (2024: USD 562,033 million → 2032: USD 1,550,032.2 million)
- 2.1.2 Volume & Revenue – Global Totals (Volume Where Applicable)
- 2.1.3 Key Market Highlights – Top Five Facts
- 2.2 Functional Foods and Natural Health Products Market Segmentation Snapshot
- 2.2.1 Market Split by Region – 2024 vs. 2032
- 2.3 Competitive Snapshot
- 2.3.1 Top 10 Players by Revenue Share – 2024
- 2.3.2 Top 10 Players by Volume Share – 2024 (Volume Where Applicable)
- 2.3.3 Recent Strategic Developments (18-Month Summary)
- 2.4 Key Investment Highlights & Strategic Conclusions
Chapter 3. Functional Foods and Natural Health Products Market Dynamics & Industry Analysis
- 3.1 Market Overview & Context
- 3.1.1 Functional Foods and Natural Health Products Market Position in the Broader Industry Value Chain
- 3.1.2 Demand Structure & Purchasing Dynamics
- 3.1.3 Market Maturity & Development Stage by Region
- 3.2 Functional Foods and Natural Health Products Market Drivers
- 3.3 Functional Foods and Natural Health Products Market Restraints & Challenges
- 3.4 Functional Foods and Natural Health Products Market Opportunities
- 3.5 Porter's Five Forces Analysis
- 3.5.1 Threat of New Entrants
- 3.5.2 Bargaining Power of Suppliers
- 3.5.3 Bargaining Power of Buyers
- 3.5.4 Threat of Substitutes
- 3.5.5 Competitive Rivalry – Intensity Assessment
- 3.6 Functional Foods and Natural Health Products Value Chain Analysis
- 3.6.1 Upstream – Key Inputs, Resources & Suppliers
- 3.6.1.1 Key Input/Resource 1
- 3.6.1.2 Key Input/Resource 2
- 3.6.1.3 Key Input/Resource 3
- 3.6.2 Midstream – Core Operations & Value Creation
- 3.6.2.1 Operating Model & Process Overview
- 3.6.2.2 Key Operating Locations & Capabilities by Company
- 3.6.3 Downstream – Market Channels & End Users
- 3.6.3.1 Direct Sales & Customer Engagement Channels
- 3.6.3.2 Indirect Sales, Intermediaries & Partner Channels
- 3.6.4 Value Chain Profitability Analysis
- 3.6.1 Upstream – Key Inputs, Resources & Suppliers
- 3.7 PESTEL Analysis
- 3.7.1 Political Factors
- 3.7.2 Economic Factors
- 3.7.3 Social Factors
- 3.7.4 Technological Factors
- 3.7.5 Environmental Factors
- 3.7.6 Legal Factors
- 3.8 Functional Foods and Natural Health Products Supply Chain Analysis
- 3.8.1 Critical Input & Resource Availability Risk Assessment
- 3.8.2 Supplier & Operational Concentration Risk (Geographic Exposure)
- 3.8.3 Supply & Service Disruption Impact Analysis
- 3.9 Regulatory & Policy Landscape
Note: The regulatory and policy landscape section covers regulations based on their applicability to the market, Functional Foods and Natural Health Products category, geography, and scope of the study. Only regulatory frameworks with a material impact on operations, compliance, trade, sustainability, or market access are analyzed in detail.
Chapter 4. Key Investment Pockets & Opportunity Analysis
- 4.1 Functional Foods and Natural Health Products Market Attractiveness Analysis
- 4.1.1 By Region – Investment Attractiveness Matrix (Market Size × CAGR)
- 4.2 Absolute Revenue Growth Opportunity
- 4.2.1 By Region – Absolute Revenue Growth Through 2032
- 4.3 Incremental Demand Opportunity
- 4.3.1 By Region – Incremental Demand Through 2032
- 4.3.2 Segment – Incremental Demand
- 4.4 Emerging Submarket Opportunity Deep Dive (Subject to Applicability)
- 4.5 Priority Market Opportunity Scorecards
- 4.5.1 United States
- 4.5.2 Europe
- 4.5.3 Asia
- 4.5.4 Middle East & Africa
Note: Priority market opportunity scorecards reflect the geographic scope and strategic relevance of the study. Listed markets are indicative and may be adapted to the industry.
Chapter 5. Functional Foods and Natural Health Products Cross-Border Trade & Market Access Analysis
- 5.1 International Trade & Cross-Border Activity Overview
- 5.1.1 Global Export Value by Country (2024)
- 5.1.2 Global Export Volume by Country (2024) (Volume Where Applicable)
- 5.1.3 Global Import Value by Country (2024)
- 5.1.4 Global Import Volume by Country (2024) (Volume Where Applicable)
- 5.1.5 Net Trade Balance by Country (2024)
- 5.2 Export Analysis – Segment
- 5.2.1 Category 1 (Applicable Classification Code)
- 5.2.2 Category 2 (Applicable Classification Code)
- 5.2.3 Category 3 (Applicable Classification Code)
- 5.2.4 Category 4 (Applicable Classification Code)
- 5.2.5 Category 5 (Applicable Classification Code)
- 5.3 Import Analysis – Segment
- 5.3.1 Category 1 (Applicable Classification Code)
- 5.3.2 Category 2 (Applicable Classification Code)
- 5.3.3 Category 3 (Applicable Classification Code)
- 5.3.4 Category 4 (Applicable Classification Code)
- 5.3.5 Category 5 (Applicable Classification Code)
- 5.4 Cross-Border Pricing & Transaction Benchmarks
- 5.4.1 Export Pricing – Segment & Country
- 5.4.2 Import Pricing – Segment & Source Country
- 5.4.3 Price Trends (2024)
- 5.5 Key Cross-Border Trade & Delivery Routes
- 5.5.1 Cross-Border Trade/Delivery Route 1
- 5.5.2 Cross-Border Trade/Delivery Route 2
- 5.5.3 Cross-Border Trade/Delivery Route 3
- 5.5.4 Cross-Border Trade/Delivery Route 4
- 5.5.5 Cross-Border Trade/Delivery Route 5
- 5.6 Trade Policy & Market Access Impact Assessment
- 5.6.1 Tariff & Non-Tariff Barriers
- 5.6.2 Regional Trade & Economic Integration Frameworks
- 5.6.3 Bilateral & Multilateral Trade Agreements
- 5.6.4 Cross-Border Operating, Licensing & Localization Requirements
Note: This chapter applies where cross-border trade or delivery is relevant to Functional Foods and Natural Health Products. Goods, services, and digital offerings are assessed using applicable classifications and transaction measures. Import-export volumes, trade balances, and route analyses are included only where meaningful to the market.
Chapter 6. Competitive Landscape & Company Benchmarking
- 6.1 Functional Foods and Natural Health Products Market Concentration & Structure
- 6.1.1 Herfindahl-Hirschman Index (HHI) – vs. 2024
- 6.1.2 Leading, Mid-Sized & Emerging Player Structure
- 6.1.3 Global, Regional & Local Player Dynamics
- 6.2 Functional Foods and Natural Health Products Market Share Analysis – 2024
- 6.2.1 Global Revenue Share by Company
- 6.2.2 Global Volume Share by Company (Volume Where Applicable)
- 6.2.3 Regional Revenue Share
- 6.2.4 Market Share Evolution ( vs. 2024)
- 6.2.5 Company Market Share by Key Segment
- 6.2.6 Company Market Share by Customer Group
- 6.3 Operating Scale, Capacity & Infrastructure Analysis
- 6.3.1 Global Operating Scale & Supply Capacity
- 6.3.2 Resource Utilization & Operating Efficiency
- 6.3.3 Output, Service Delivery & Activity Metrics
- 6.3.4 Operating Footprint & Infrastructure Map
- 6.3.5 Planned Operational & Capacity Expansion
- 6.4 Functional Foods and Natural Health Products Competitive Benchmarking Matrix
- 6.4.1 Revenue, Growth, Profitability & Operating Metric Comparison
- 6.4.2 Channel Revenue Mix
- 6.4.3 Geographic Revenue Exposure
- 6.4.4 R&D Intensity
- 6.4.5 Sustainability Maturity
- 6.5 Strategic Developments in Functional Foods and Natural Health Products (Last 24 Months)
- 6.5.1 Mergers, Acquisitions & Divestments
- 6.5.2 New Products, Services & Solutions in Functional Foods and Natural Health Products
- 6.5.3 Operational & Infrastructure Expansions
- 6.5.4 Strategic Alliances, Joint Ventures & Partnerships
- 6.5.5 Distribution Expansion & Market Entry
- 6.5.6 Sustainability & ESG Initiatives
- 6.6 Competitive Strategy Mapping
- 6.6.1 Leader, Challenger, Follower & Niche Classification
- 6.6.2 Pricing Strategy Comparison
- 6.6.3 Channel Strategy Matrix
Note: Strategic developments are included based on their materiality and the availability of reliable information.
Chapter 7. Global Functional Foods and Natural Health Products Market – By Sales & Delivery Channel
- 7.1 Segment Overview
- 7.1.1 Volume & Revenue Split by Channel (2024 & 2032) (Volume Where Applicable)
- 7.1.2 Channel Mix Evolution (2024-2032)
Chapter 8. Regional Market Analysis – Global Overview
- 8.1 Global Regional Overview
- 8.1.1 Regional Volume Share (Volume Where Applicable)
- 8.1.2 Regional Revenue Share
- 8.1.3 Regional Volume by Region (Volume Where Applicable)
- 8.1.4 Regional Revenue by Region
- 8.1.5 Regional Forecast Through 2032
- 8.2 Cross-Regional Segment Analysis
- 8.2.1 By Sales & Delivery Channel
- 8.2.2 By Competitive Positioning & Price Tier
Chapter 9. North America Functional Foods and Natural Health Products Market
- 9.1 United States
- 9.2 Canada
- 9.3 Mexico
Chapter 10. Europe Functional Foods and Natural Health Products Market
- 10.1 Germany
- 10.2 France
- 10.3 Italy
- 10.4 United Kingdom
- 10.5 Spain
- 10.6 Poland
- 10.7 Russia
- 10.8 Netherlands
- 10.9 Belgium
- 10.10 Sweden
- 10.11 Denmark
- 10.12 Norway
- 10.13 Rest of Europe
Chapter 11. Asia Pacific Functional Foods and Natural Health Products Market
- 11.1 China
- 11.2 India
- 11.3 Japan
- 11.4 South Korea
- 11.5 Thailand
- 11.6 Indonesia
- 11.7 Vietnam
- 11.8 Malaysia
- 11.9 Australia
- 11.10 Rest of Asia Pacific
Chapter 12. Latin America Functional Foods and Natural Health Products Market
- 12.1 Brazil
- 12.2 Argentina
- 12.3 Colombia
- 12.4 Chile
- 12.5 Rest of Latin America
Chapter 13. Middle East Functional Foods and Natural Health Products Market
- 13.1 Saudi Arabia
- 13.2 United Arab Emirates
- 13.3 Turkey
- 13.4 Israel
- 13.5 Iran
- 13.6 Rest of the Middle East
Chapter 14. Africa Functional Foods and Natural Health Products Market
- 14.1 South Africa
- 14.2 Egypt
- 14.3 Nigeria
- 14.4 Morocco
- 14.5 Rest of Africa
Chapter 15. Functional Foods and Natural Health Products Company Profiles
- 15.1 [Company 01]
- 15.1.1 Company Overview
- 15.1.2 Key Management Personnel
- 15.1.3 Products & Services Portfolio
- 15.1.4 Financial Performance
- 15.1.5 Key Market Focus & Geographic Presence
- 15.1.6 Recent Developments & Strategic Initiatives
Note: The company profile list is preliminary and may change based on research findings, market developments, data availability, and client requirements.
Chapter 16. Appendices
- Appendix A – List of Abbreviations & Acronyms
- Appendix B – Industry Classification Code Reference – Full Series
- Appendix C – Supply, Output & Operating Capacity Data Tables
- Appendix D – End-Use & Demand Base Tables
- Appendix E – Demand, Adoption & Usage Assumptions
- Appendix F – Pricing & Revenue Metric Reference Tables
- Appendix G – Company Operations & Infrastructure Database
- Appendix H – Cross-Border Trade & Activity Data Tables (Where Applicable)
- Appendix I – Regulatory Summary Tables
- Appendix J – Primary Research Participant List (Anonymized)
- Appendix K – Primary Research Questionnaire Framework
- Appendix L – Data Sources & Bibliography
- Appendix M – Market Size Divergence & Source Comparison
Chapter 17. Research Methodology
- 17.1 Research Framework & Philosophy
- 17.2 Secondary Research – Sources, Hierarchy & Data Extraction
- 17.3 Data Modeling – Bottom-Up & Top-Down Market Sizing
- 17.4 Primary Research – Stakeholder Framework, LOI & Sample Sizes
- 17.5 Forecast Methodology – Regression, Scenario & Sensitivity Analysis
- 17.6 Quality Control – Four-Layer Validation Framework
- 17.7 Limitations & Standard Assumptions
- 17.8 Disclaimer
